Topology View Overview
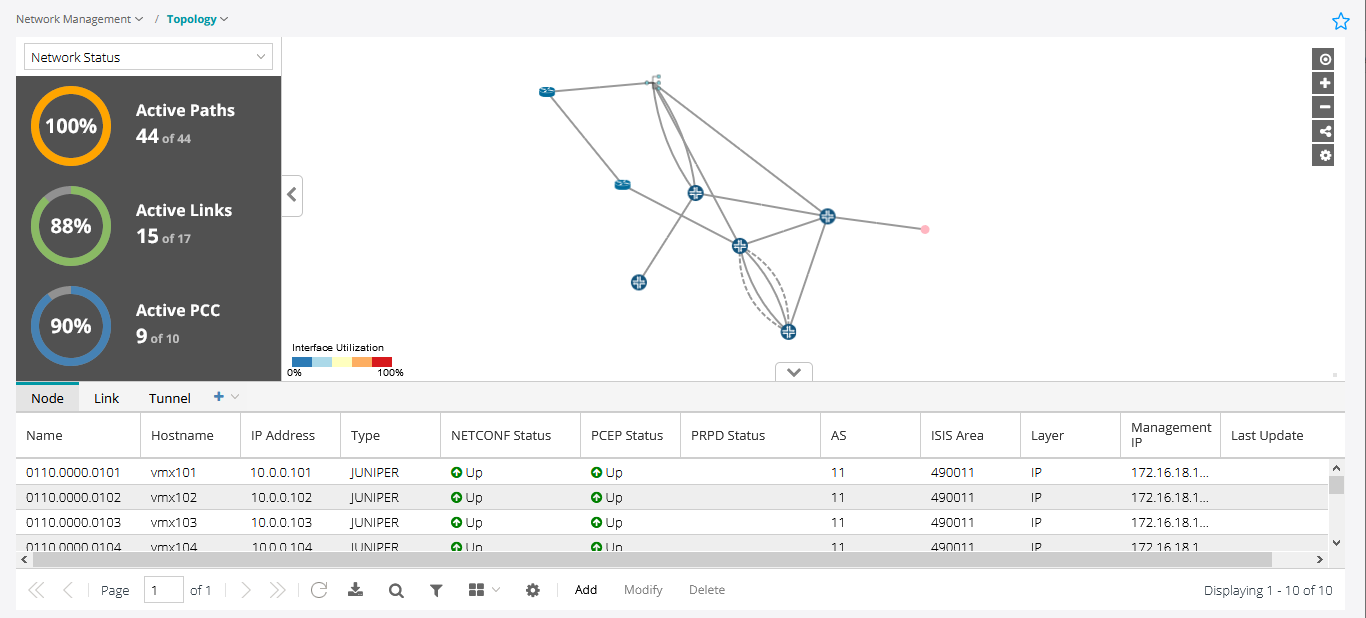
The Topology page (Figure 1) is the main work area for the live network you load into the system. It consists of the following:
Left pane—Drop-down menu for network status, event timeline, and various map presentation options. Your selections are reflected in the topology map where applicable. You can show or hide the left pane by clicking the chevron.
Interactive graphical topology map—Use the topology map to access element information and further customize the map display. You can configure the color legend at the bottom left corner by clicking the legend.
Network information table—The network information table at the bottom of the window can be configured to display Node, Link, Tunnel, Demand, Interface, Anycast Group, Container LSP, IPE Policy, Maintenance, P2MP Group, Service, and SRLG/Facility tabs across the top of the table. Click a tab to display information for the type selected. The Node, Link, and Tunnel tabs are displayed by default. You can add any of the other tabs by clicking the + drop-down menu and selecting a tab. Special purpose tabs are also added in response to right-clicking on certain network information table elements to display more specific data such as various kinds of traffic, interface delay, packet loss, or sub-LSPs. You can show or hide the network information table by clicking the chevron.

If the Topology view fails to refresh, simply click the refresh button below the network information table.
