ON THIS PAGE
Monitor Network Device Health Using Grafana
Read these topics to understand how to view pre-populated graphs and run queries from the Grafana UI.
You use Grafana to create and to view charts, graphs, and other visuals to help organize and understand data. For more information on Grafana and how to access the Grafana UI, see Grafana Overview
Run a Query
You can run queries from the Grafana UI. For more information, see Query a Data Source.
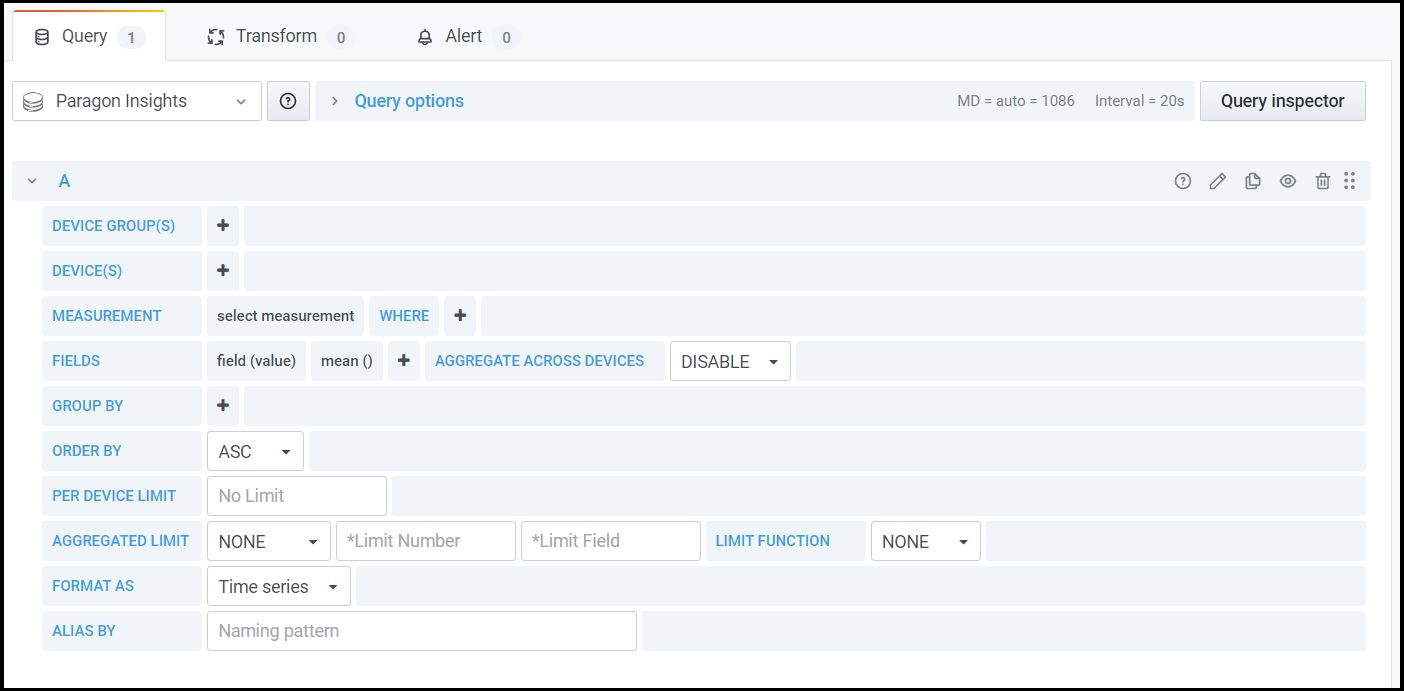
When you create a chart, the data is rendered from the TSDB database. The TSDB database library (shim) is based on InfluxDB, an open-source time series database. Information sent to and received from the TSDB database is in the InfluxDB format. Paragon Automation also supports Grafana's open source InfluxDB plug-in. After you run a query from the Grafana UI, the open-source InfluxDB sends a back-end request to the Paragon Automation TSDB. The Paragon Automation TSDB sends the response in InfluxDB format.
In
earlier releases, when you run a query from the Grafana UI
using influxDB as a data source, you can only view data of a specific device in
a device group. You use syntax parameters such as FROM and
SELECT that the influxDB recognizes. You cannot view
aggregate data of a device group, or view aggregate data of multiple device
groups using the influxDB plug-in. However,
Paragon
Automation
also
supports the Juniper Paragon Insights TSDB plug-in.
This plug-in is installed when you install Paragon Automation. The Juniper
Paragon Insights TSDB plug-in is based on the influxDB plug-in but also supports
the ability to view aggregate data of a device group, or view aggregate data of
multiple device groups. You can view aggregate data by using syntax parameters
such as DEVICE, DEVICE GROUPS, and
MEASUREMENT. The default data source for Paragon Insights
in Grafana is based on the Juniper Paragon Insights TSDB plug-in.
For more information on supported syntax parameters, see Table 1.

| InfluxDB Querying Options | TSDB Querying Options |
|---|---|
FROM—Select the data source (device, device
group, topic/rule). |
DEVICE—Select one or more than one device
for this query. |
SELECT—Select the data field, and apply
aggregation and transformation types to the data. |
DEVICE GROUP—Select one or more than one
device group for this query. |
GROUP BY—Specify how to group data based on
KPI keys. |
MEASUREMENT—Select the Paragon Insights
topic or rule name. |
FORMAT AS—Specify if you want to format as
table, time series, or log. |
FIELDS—Select the fields to which you want
to apply the aggregation. |
WHERE—Filter data based on tags and
fields. |
|
|
GROUP BY—Specify how to group data based on
KPI keys. |
|
FORMAT AS—Specify if you want to format as
table, time series, or log. |
|
PER DEVICE LIMIT—Set the per-device limit of
the base query for each device (database) that you have
selected. |
|
AGGREGATED LIMIT—Set the aggregate limit for
the device (databases) after the base query is run. |
AGGREGATED LIMIT—Rename a field. For
example, if you select mean as an
aggregation function for a field named
bps, you can give it an alias name
called mean_bps. |
View Pre-populated Graphs
You can view pre-populated graphs from the Grafana dashboard.
You can view pre-populated graphs from the Dashboards section of the Grafana Home page. You can also view these pre-populated graphs by clicking Dashboard>Manage>Paragon Insights Cluster Health. The following graphs are available by default:
- CPU Usage—View cluster-wise or node-wise information on CPU (%) usage at different levels.
- Disk Read Usage (
r_await)—View cluster-wise or node-wise information on average time taken for disk reads to be served. - Disk Write Usage (
w_await)—View cluster-wise or node-wise information on average time taken for disk writes to be served. - Node Memory Available—View information on free memory available on a node in a selected cluster.
Click the name of a graph to view more information of that graph. You can view a pre-populated graph of all nodes in a cluster at a time, and also view pre-populated graphs of one or more nodes in a cluster.
