Getting Started
Before you Begin
Before installing Juniper ATP Appliance products, be sure that you meet the following installation, setup, safety, and site requirements:
Read the Juniper ATP Appliance Release Notes for the current release.
Familiarize yourself with the appliance, AWS, SaaS or VM OVA by reading the Juniper ATP Appliance Quick Start Guide specific to your product(s).
Gather the information and equipment outlined in Juniper ATP Appliance Network Information, including the following items:
Juniper ATP Appliance information
Network information
Client information.
Follow the guidelines listed in Accessing Juniper ATP Appliance Device Interfaces.
Juniper ATP Appliance Network Information
For hardware specifications and set up instructions, refer to the JATP700 Appliance Hardware Guide.
Before you connect and configure the appliance, collect the information about your network outlined in Table 2-1 below.
Network Item |
Information Needed |
|---|---|
Juniper ATP Appliance |
|
DNS (Domain Name Service) Service (Optional) |
IP address of one or more DNS server |
NTP (Network Time Protocol) Service (Optional) |
IP address of one or more NTP servers |
Remote Management (Optional) |
If you want to access the Juniper ATP Appliance CLI remotely, the remote system must have one of the following:
Note:
Always use the latest version of Putty for SSH operations, if using Putty as an SSH client. |
CM (Central Manager) |
|
Management Network
The following table summarizes all port and protocol configurations for the Juniper ATP Appliance and CM connectivity. Note that the admin interface on all appliances is eth0 by default. All auto-updates for GSS are handled exclusively by the Core/CM or All-in-One System.
Communication ports and protocols must be opened during installation for both internal and external servers and services.
IMPORTANT: Primary Core/CM and Secondary Cores/Mac Cores must be on the same network, and allow all ports, with no Port Address (PAT) or Network Address Translation (NAT).
The Table 2 delineate all internal and external ports and protocols.
- Internal Servers
- Management Port eth0
- Monitoring Port eth1
- Analysis Engine Exhaust Port eth2
- Port Scan Detector and SSH Honeypot Port eth3
- External Servers
Internal Servers
Description |
Protocol |
Source |
Destination |
Port |
|---|---|---|---|---|
CLI Management |
TCP |
admin workstation |
Core/Collector/ Secondary Core admin interface |
22 |
CM Web UI Management |
TCP |
admin workstation |
CM admin interface |
443 |
DNS Queries |
TCP/UDP |
Core/Collector/ Secondary Core admin interface |
Internal DNS servers |
53 |
NTP |
UDP |
Appliance admin interface |
NTP Servers |
123 |
Syslog |
UDP |
Appliance admin interface |
SIEM/Syslog CEF server |
514 |
CM Connection |
TCP |
Collector and Secondary Core admin interface |
CM admin interface |
443 |
Management Port eth0
Use the management port eth0 interface to administer and use the distributed Juniper ATP Appliances. This is the port through which the Juniper ATP Appliance exchanges security content and through which integration with the CM is managed. The management interface must be network routable with the Juniper ATP Appliance IP/ hostname access over the following ports:
DNS (UDP/53)
HTTPS (TCP/443)
SSL/TLS Port 443 should be open between Collectors and the Core/CM for traffic inspection and malware behavior analysis.
Always use the latest version of Putty for SSH operations, if using Putty as an SSH client.
For setting up the IP address and DNS for the management interface, the name management interface is used (instead of eth0).
Monitoring Port eth1
Use a network tap to send a copy of network traffic from a network segment to the eth1 network monitoring port of a Juniper ATP Appliance Collector. The tap does not interfere with traffic and, if shut down, allows traffic to pass through unhindered. See and for more information.
eth1 is the only supported port for traffic monitoring.
Analysis Engine Exhaust Port eth2
The option is available to configure an alternate interface to move analysis engine traffic exhaust and CnC communications during detection detonation processes off the management network eth0 and to a separate interface eth2.
An eth2 interface can be configured for the primary Core+CM, All-in-One Core, and Mac Mini secondary Cores. The Mac Mini requires a USB-to-NIC adapter to set up the alternate interface.
Port Scan Detector and SSH Honeypot Port eth3
There is also an option to configure the eth3 port for all outbound Collector traffic.
A Juniper ATP Appliance Advanced License is required for SSH Honeypot Lateral Detection configurations. The honeypot interface always enumerates as eth3.
External Servers
The Table 3 lists the ports and protocols, per external server, for which the Juniper ATP Appliance system requires outgoing connectivity. See the warning and notes below for details.
Starting in ATP Appliance release 5.0.7, the GSS services domain has changed from *.cloud.cyphort.com to *.gss.junipersecurity.net. You must change your existing firewall rules to allow outbound traffic to the new *.gss.junipersecurity.net domains. Both the domains will be valid during the transition to the new domain. The *.cloud.cyphort.com will be phased out in the future. We recommend that you transition to the new domain as soon as possible.
If your firewall doesn’t support wildcards for domains, you must open port 443 to the following services:
gss.gss.junipersecurity.net
filestore.gss.junipersecurity.net
rep.gss.junipersecurity.net
update.gss.junipersecurity.net
rs.gss.junipersecurity.net
After opening your firewall to reach the new domain (*.gss.junipersecurity.net), you must restart all services by clicking Restart Services in the ATP Appliance UI so the ATP Appliance Core can connect to the new domain. To avoid restarting ATP Appliance services, you can open the firewall to both the old and the new domain before upgrading to the new release. And once upgrade is successful, you can close the firewall to the old domain (*.cloud.cyphort.com). If the new domain is not reachable during the upgrade, after closing your firewall to the old domain (*.cloud.cyphort.com), you must restart all services by clicking Restart Services in the ATP Appliance UI so the ATP Appliance Core can connect to the new domain (*.gss.junipersecurity.net).
The ATP Appliance core falls back to the old domain (*.cloud.cyphort.com) automatically if it’s unable to reach *.gss.junipersecurity.net after the upgrade. This is done to help you transition to the new domain.
ATP Appliance sends a health notification alert every 12 hours (provided you have configured the System Health Alert notification) if the ATP Appliance core cannot reach the*.gss.junipersecurity.net domain. To stop these alerts, you must open your firewall to allow 443 to the new domain (*.gss.junipersecurity.net) from the ATP Appliance Core.
Description of External Server Relative to the Juniper ATP Appliance Core or vCore |
Source |
Destination Hostname/ IP Address |
Dest. Port |
Protocol |
|---|---|---|---|---|
SIEM/ Syslog Server |
|
IP address of SIEM/ Syslog Server |
514 |
UDP |
DNS Server(s) |
|
Customers’ DNS server IP address |
53 |
TCP/UDP |
Ping Test |
|
8.8.8.8 |
ICMP |
|
Juniper ATP Appliance Software and Content |
|
gss.gss.junipersecurity.net update.gss.junipersecurity.net |
443 |
TCP |
Juniper ATP Appliance GSS Reporting Server |
|
gss.gss.junipersecurity.net filestore.gss.junipersecurity.net |
443 |
TCP |
Reputation Server Juniper ATP Appliance |
|
rep.gss.junipersecurity.net |
443 |
TCP |
Juniper SRX Firewall Note:
For Mitigation via SRX Firewall |
|
Customer’s configured SRX appliance and security policies |
443 |
TCP |
Palo Alto Networks PAN appliance or Panorama, Cisco ASA, Checkpoint, Fortinet or FortiManager Note:
For Mitigation via integrated Firewall |
|
Customer’s configured PAN appliance |
830 |
TCP |
Crowdstrike and/or Carbon Black Response Server Note:
For Mitigation/ Validation through Carbon Black Response |
|
Customer’s configured Carbon Black server |
443 |
TCP |
BlueCoat ProxySG Note:
For Mitigation via Blue- Coat Proxy |
|
Customer’s configured BlueCoat proxy |
443 |
TCP |
In summary, be sure to configure Core/CM outgoing Internet connectivity to:
Configure outgoing access from the Juniper ATP Appliance management interface eth0 to the enterprise SMTP server, DNS servers, and logging/SIEM servers.
The Core engine connects to a separate Mac Mini OSX or other Secondary Core using TCP port 22, be sure to open this port when installing a distributed Mac OS X Engine. All communications take place on eth0. Other ports are reserved in this release (See also Analysis Engine Exhaust Port eth2 and Configuring an Alternate Analysis Engine Interface).
If you configure Juniper ATP Appliance Email Collector(s), ports used to access the email server(s) must also be opened. All communications occur across the Juniper ATP Appliance management network via eth0. Other ports are reserved in this release (See Analysis Engine Exhaust Port eth2 and Configuring an Alternate Analysis Engine Interface).
Primary Core/CM and Secondary Cores/Mac Cores must be on the same network, and allow all ports, with no Port Address (PAT) or Network Address Translation (NAT).
Management interface eth0 requires a static IP address or reserved DHCP address and net mask. However, if this is a CM-connected appliance, use only a static IP address and net mask. See additional Central Manager (CM) communications information below.
Do not use ZeroConf on the primary interface.
Always use the latest version of Putty for SSH operations, if using Putty as an SSH client.
Juniper ATP Appliance Web UI Support
The browsers supported by the Juniper ATP Appliance Web UI are as follows:
Windows Users
Internet Explorer 11.0 or higher
FireFox® 31 or higher
Google Chrome 36 or higher
Mac Users
Safari 7.0.2
Google Chrome 36 or higher
FireFox® 31 or higher
Screen Resolution Support
The Juniper ATP Appliance Web UI supports use of the following screen resolutions:
|
|
|
|
|
|
|
|
|
|
|
Accessing Juniper ATP Appliance Device Interfaces
You can gather information and interact with Juniper ATP Appliances using the following interfaces:
Command Line Interface (CLI)
Juniper ATP Appliance Central Manager Web UI
For more information about the CLI and CLI command syntax and usage, refer to the Juniper ATP Appliance CLI Command Reference.
Launching the Configuration Wizard
To launch the configuration wizard, enter the CLI command wizard.
JATP# wizard
At the CLI prompt, enter your username and password. By default, the admin user name is admin and the password is 1JATP234.
Be sure to change the default password for the admin account after initial setup; the password must be at least 8 characters in length.
Enter yes to use the configuration wizard when prompted, and then respond as shown below.
Configuration Wizard
Configuration Wizard Prompts |
Customer Response from All-in-One |
Customer Response from Core or Mac Mini |
Customer Response from Collector |
|---|---|---|---|
Use DHCP to obtain the IP address and DNS server address for the administrative interface (Yes/No)? Note:
Only if your DHCP response is no,enter the following information when prompted:
Restart the administrative interface (Yes/No)? |
We strongly discourage the use of DHCP addressing because it changes dynamically. A static IP address is preferred. Recommended: Respond with no:
Enter yes to restart with the new configuration settings applied. |
We strongly discourage the use of DHCP addressing because it changes dynamically. A static IP address is preferred. Recommended: Respond with no:
Enter yes to restart with the new configuration settings applied. |
We strongly discourage the use of DHCP addressing because it changes dynamically. A static IP address is preferred. Recommended: Respond with no:
Enter yes to restart with the new configuration settings applied. |
Enter a valid hostname (enter a unique name) |
Type a hostname when prompted; do not include the domain; for example: juniperatp1 |
Type a hostname when prompted; do not include the domain; for example: juniperatp1 |
Type a hostname when prompted; do not include the domain; for example: juniperatp1 |
[OPTIONAL] If the system detects a Secondary Core with an eth2 port, then the alternate CnC exhaust option is displayed: Use alternate-exhaust for the analysis engine exhaust traffic (Yes/No)? Enter IP address for the alternate-exhaust (eth2) interface: Enter netmask for the alternate-exhaust (eth2) interface: (example: 255.255.0.0) Enter gateway IP Address for the alternate-exhaust (eth2) interface: (example:10.6.0.1) Enter primary DNS server IP Address for the alternateexhaust (eth2) interface: (example: 8.8.8.8) Do you have a secondary DNS server for the alternate-exhaust (eth2) interface? Do you want to enter the search domains for the alternateexhaust (eth2) interface? Note:
A complete network interface restart can take more than 60 seconds |
Refer to Configuring an Alternate Analysis Engine Interface for more information. Enter yes to configure an alternate eth2 interface. Enter the IP address for the eth2 interface. Enter the eth2 netmask. Enter the gateway IP address. Enter the primary DNS server IP Address for the alternate-exhaust (eth2) interface. Enter yes or no to confirm or deny an eth2 secondary DNS server. Enter yes or no to indicate whether you want to enter search domain. |
Refer to Configuring an Alternate Analysis Engine Interface for more information. Enter yes to configure an alternate eth2 interface. Enter the IP address for the eth2 interface. Enter the eth2 netmask. Enter the gateway IP address. Enter the primary DNS server IP Address for the alternate-exhaust (eth2) interface. Enter yes or no to confirm or deny an eth2 secondary DNS server. Enter yes or no to indicate whether you want to enter search domain. |
[Traffic Collectors do not send or receive Core analysis engine CnC network traffic, so no eth2 interface is needed.] |
Regenerate the SSL self-signed certificate (Yes/No)? |
Enter yes to create a new SSL certificate for the Juniper ATP Appliance Server Web UI. If you decline the selfsigned certificate by entering no, be prepared to install a certificate authority (CA) certificate. |
Enter yes to create a new SSL certificate for the Juniper ATP Appliance Server Web UI. If you decline the selfsigned certificate by entering no, be prepared to install a certificate authority (CA) certificate. |
Not applicable to Collector. |
Enter the following server attributes: Is this a Central Manager device: Device Name: (must be unique) Device Description Device Key PassPhrase Note:
Remember this passphrase and use it for all distributed devices! |
Enter Yes; the system will auto-set IP 127.0.0.1 as the All-in- One IP address. Enter the Juniper ATP Appliance Collector Host Name; this identifies the Collector in the Web UI. Enter a device Description Enter a user-defined PassPhrase to be used to authenticate the Core to the Central Manager. |
Enter Yes; the system will auto-set IP 127.0.0.1 as the All-in- One IP address. Enter a Juniper ATP Appliance Mac Mini or Core/CM Host Name; this identifies the Mac OS X or Core Engine in the Web UI. Enter a device Description Enter the same PassPhrase used to authenticate the Core or Mac Mini to the Central Manager. |
Enter No; the system will request that you enter the CM IP address now. Enter the Juniper ATP Appliance Collector Host Name; this identifies the Collector in the Web UI. Enter a device Description Enter the same PassPhrase used to authenticate the Collector to the Central Manager. |
[OPTIONAL] If the system detects a Secondary Core with an eth2 port, then the alternate CnC exhaust option is displayed: Use alternate-exhaust for the analysis engine exhaust traffic (Yes/No)? Enter IP address for the alternate-exhaust (eth2) interface: Enter netmask for the alternate-exhaust (eth2) interface: (example: 255.255.0.0) Enter gateway IP Address for the alternate-exhaust (eth2) interface: (example:10.6.0.1) Enter primary DNS server IP Address for the alternateexhaust (eth2) interface: (example: 8.8.8.8) Do you have a secondary DNS server for the alternate-exhaust (eth2) interface? Do you want to enter the search domains for the alternateexhaust (eth2) interface? Note:
Note: A complete network interface restart can take more than 60 seconds ...Restarting alternate-exhaust (eth2) interface ...A complete network interface restart can take more than 60 seconds ...Restarting os_engine_eth2 interface Waiting for os_engine_eth2 to get ready (MAXWAIT is 32 seconds). |
Refer to Configuring an Alternate Analysis Engine Interface for more information. Enter yes to configure an alternate eth2 interface. Enter the IP address for the eth2 interface. Enter the eth2 netmask. Enter the gateway IP address. Enter the primary DNS server IP Address for the alternate-exhaust (eth2) interface. Enter yes or no to confirm or deny an eth2 secondary DNS server. Enter yes or no to indicate whether you want to enter search domain. |
Refer to Configuring an Alternate Analysis Engine Interface for more information. Enter yes to configure an alternate eth2 interface. Enter the IP address for the eth2 interface. Enter the eth2 netmask. Enter the gateway IP address. Enter the primary DNS server IP Address for the alternate-exhaust (eth2) interface. Enter yes or no to confirm or deny an eth2 secondary DNS server. Enter yes or no to indicate whether you want to enter search domain. |
Traffic Collectors do not send or receive Core analysis engine CnC network traffic. |
After all the questions are answered, the wizard summarizes the answers. To change an answer, enter the step number. To save changes and exit, press <enter>.
To return to the configuration wizard to make changes to the configuration, use the following CLI command:
JATP# wizard
Be sure to use the double quotation marks in CLI parameters using special characters.
Refer to the Juniper ATP Appliance CLI Command Reference for command syntax and usage.
Juniper ATP Appliance Web UI Access
The Juniper ATP Appliance Web UI is a secure web-based defense system configuration and malware analysis management interface. You can access it by pointing your web browser to the configured IP address of the appliance using HTTPS. For example, if the configured IP address of the appliance is 10.8.20.2, then you would access the appliance GUI by pointing your browser to https://10.8.20.2.
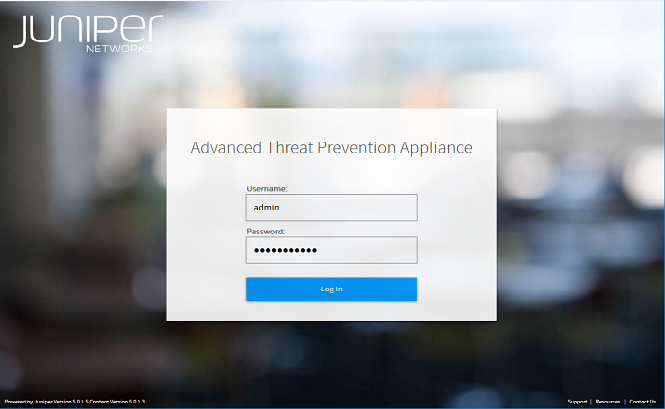
At the login screen, shown in the following figure, enter the default username and password.
The default username is admin and the password is juniper. Be sure to reset this default password after initial login.
The CM Web UI supports passwords up to 32 characters, and at least 8 characters. Letters (uppercase/ lowercase), numbers, and special characters can be used with the exception of double-quotes (”), spaces, or backslash characters (\) in passwords.
The Juniper ATP Appliance Web UI login username and password are separate from the CLI admin username and password.
Login to the Juniper ATP Appliance using SAML Authentication
When SAML settings are configured, users for which SAML authentication is assigned are automatically redirected to the enterprise’s IdP login page when they try to access the Juniper ATP Appliance. For more information about SAML authentication, refer to Configuring SAML Settings and Configuring User Accounts.
For more information about the Juniper ATP Appliance Central Manager Web UI, refer to Working with the Juniper ATP Appliance Web UI.
Login to the Juniper ATP Appliance System using AD Authentication
When AD authentication is configured, users are authenticated via Active Directory (AD) servers using the RADIUS protocol in customer networks.
For more information about AD authentication, refer to Configuring RADIUS Server Settings and Configuring Active Directory.
- Working with the Juniper ATP Appliance Web UI
- Navigating the CM Web UI
- Summary of the Tabs in the Juniper ATP Appliance Web UI
Working with the Juniper ATP Appliance Web UI
This section describes how to navigate the appliance Web UI and describes its tabs:
Navigating the CM Web UI
Summary of Tabs
Summary of the Tabs in the Juniper ATP Appliance Web UI
The Juniper ATP Appliance Central Manager Web UI
The purpose of each Web UI Tab is described as follows:
Dashboard—Displays appliance status information as well as detected threats and incident trends. Context specific Threat Views on the Operations Dashboard and Research Dashboard prioritize the threats that affect your enterprise the most, according to your configurations. The System Dashboard and Collector Dashboards (Web and Email) provide information about System and Collector health status and trends. The Event Timeline Dashboard displays Advanced Threat Analytics (ATA) data per event for a given vendor and Endpoint IP, Hostname, Username or Email.
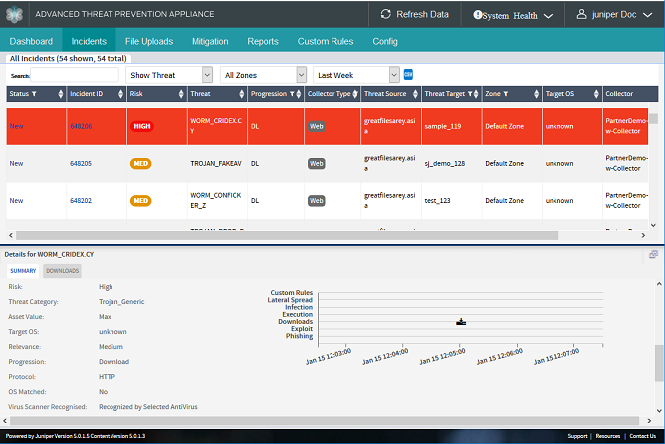
Incidents—Displays levels of detailed information about malicious or suspicious downloads or infections, at various kill chain stages, in your network. See also Navigating the Incidents Page for more information.
File Uploads—Provides detailed information about all file upload malware analysis results, whether malicious or benign, in one Web UI location. File Upload Handling capabilities from the Central Manager Web UI include uploads from a new File Uploads tab. The enhanced file uploads API accepts additional metadata for third party integrations such as Carbon Black Response to provide seamless integration with incidents. For more information, refer to Submitting a Malware File for Analysis.
Mitigation—Presents mitigation options for specific detected threats such as Auto-Mitigation, blocking callbacks from the Gateway or IPS/Next Gen Firewall, or deploying the Juniper ATP Appliance Infection Verification Package (IVP) or Carbon Black Response integration to confirm infection on the targeted endpoint. For more information, refer to Configuring Firewall Auto-Mitigation.
Reports—Allows you to generate or schedule consolidated and detailed executive summary reports, or system Audit Reports. Refer to Generating Reports for more information
Custom Rules—Displays custom Snort rule matches in the Juniper ATP Appliance Central Manager Web UI Custom Rules Tab; correlated Snort Rule matches are available on the Incidents Tab. Refer to Configuring Custom SNORT Rules for information about adding rules to the system.
Config—Allows you to configure appliance and software system settings as well as configure analysis, notifications and mitigation settings.
Refresh—Performs a refresh of the CM browser display. Always perform a refresh following a software or security content update.
System Health—Displays health indicator checks for Juniper ATP Appliance static and dynamic detonation engines and analysis systems. All indicators should display the green checkmark which indicates that the systems are in good health. If a red indicator displays, then troubleshooting actions are required.
Behavior Engine |
 |
Core Detonation Engine |
Static Engine |
 |
Static Analysis |
Correlation |
 |
Event Correlation Engine |
Web Collectors |
 |
Connection status of the enabled Web Collectors |
Secondary Cores |
 |
Connection status of configured Secondary Cores (Mac OSX) |
Log Out—Performs a log out of the current Central Manager Web UI user.
Deploying the Distributed Juniper ATP Appliance System
Deploying the Juniper ATP Appliance Advanced Threat Protection system is covered in the following sections:
For information about validating Juniper ATP Appliance deployment, refer to the Juniper ATP Appliance CLI Command Reference.
- Deployment Scenarios
- Juniper ATP Appliance Defense in an Enterprise Headquarters
- Juniper ATP Appliance Defense in a Distributed Enterprise Environment
- Juniper ATP Appliance Distributed SaaS/OVA Deployment
Deployment Scenarios
Three Juniper ATP Appliance advanced threat protection deployment scenarios are described in this section:
Juniper ATP Appliance Deployment in an Enterprise Headquarters
Juniper ATP Appliance Defense in a Distributed and/or Clustered Enterprise Environment
Juniper ATP Appliance Distributed SaaS/OVA or Virtual Deployment
Juniper ATP Appliance Defense in an Enterprise Headquarters
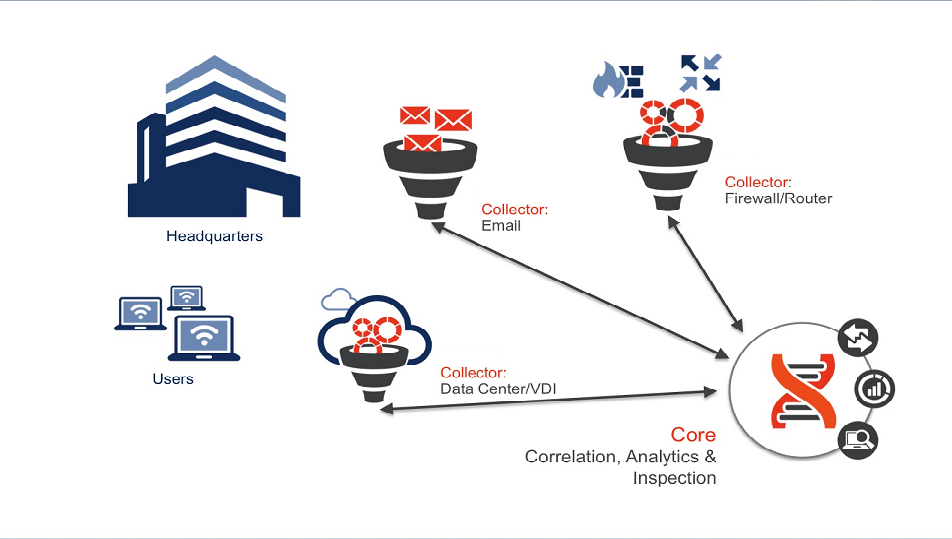
In this scenario (see Figure 5 below), a Core|CM system is installed in an enterprise headquarters with three physical Traffic Collectors deployed for wide traffic coverage and service integration.
Collector 1 positioned for Data Center coverage
Collector 2 positioned for Web traffic coverage
Collector 3 positioned at the firewall for coverage and mitigation/blocking
In this deployment scenario the Traffic Collectors provide network coverage and integrate with existing infrastructure, and the Core|CM provides web and email incident detection while performing risk-aware mitigation and blocking at the firewall.
Juniper ATP Appliance Defense in a Distributed Enterprise Environment
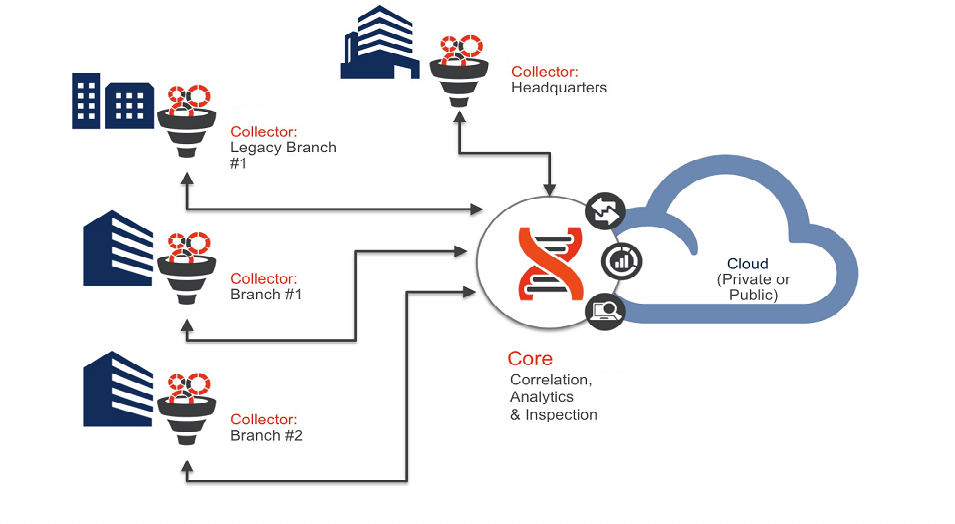
A distributed enterprise requires a distributed threat defense scenario (see Figure below). In this scenario, various physical and virtual Collectors are deployed remotely at branch offices for continuous inspection and extended network visibility.
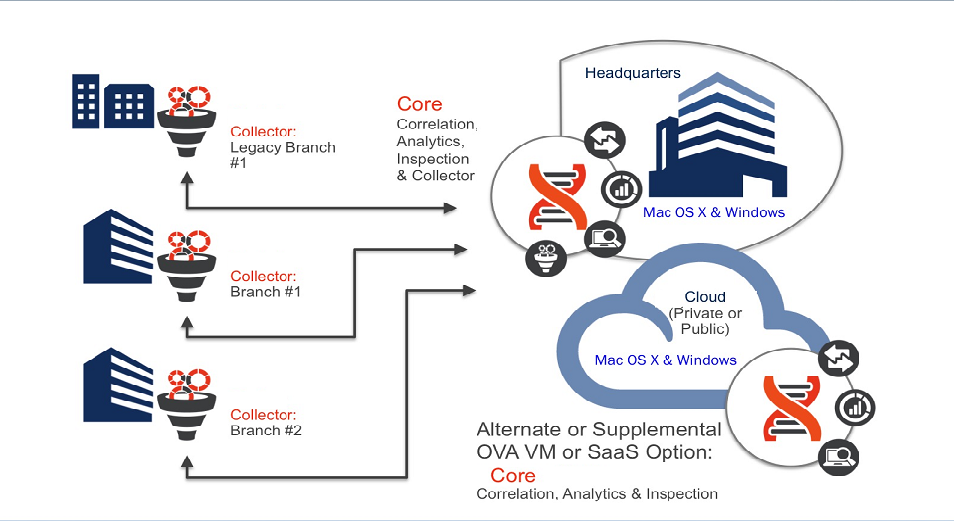
Traffic analysis takes place at the distributed Collectors and objects are then delivered to the Core|CM, deployed at enterprise headquarters, where network objects are subjected to multi-OS detonation chamber execution for final threat assessment and mitigation.
Alternatively, the Core|CM in this distributed deployment could also be configured as an OVA VM or SaaS deployment. In addition, a supplemental Juniper ATP Appliance Core could be deployed in a public or private enterprise cloud.
Juniper ATP Appliance Distributed SaaS/OVA Deployment
In a distributed SaaS/OVA deployment, Traffic Collectors are deployed in several branch offices at critical monitoring locations with the Core|CM at headquarters and a Collector installed as a VM OVA in the cloud to inspect and analyze all content and trigger mitigation actions at configured enforcement servers, such as a PAN or SRX Firewall, for example.
The Juniper ATP Appliance Core can be deployed in a public, hybrid or private cloud.
Deployment Guidelines
The following section provides an overview of details you should review to successfully deploy a Distributed Core|CM or All-in-One Juniper ATP Appliance system. Review these guidelines before deploying devices and/or virtual (software-only or OVA ) devices as well to avoid troubleshooting issues post-deployment.
Obtain the estimated bandwidth traffic, including average/peak information for optimal sizing of the Juniper ATP Appliance Advanced Threat Protection solution. The bandwidth can be acquired from an upstream router or firewall in the network path. Discuss your enterprise network bandwidth and topology requirements with Juniper ATP Appliance Customer Support.
The Web Traffic Collector can be deployed at any headquarters or remote location.
A network switch with a switch mirror (SPAN) or TAP port should be available to connect to the Traffic Collector. The SPAN/TAP feed should carry live HTTP and non-HTTP end-user network traffic.
If NAT (Network Address Translation) or Web proxies that obscure originating IP addresses are used in your environment, the Traffic Collector must be able to see the internal side of your NAT or proxy traffic.
The Juniper ATP Appliance Core or All-in-One can be deployed at any location in the enterprise network, but is often deployed in a management VLAN.
Have an SSH client on the remote admin system ready for remote CLI access to the Juniper ATP Appliance Traffic Collector and Core or All-in-One system.
Note:Always use the latest version of Putty for SSH operations, if using Putty as an SSH client.
Check for network proxies in the management path between the Juniper ATP Appliance Core and the remote admin system, and then configure the proxy appropriately. Refer to Configuring Proxy Settings for the Management Network for information about configuring and managing proxy settings from the Juniper ATP Appliance Web UI, and the Juniper ATP Appliance CLI Command Reference for information about configuring proxies from the Juniper ATP Appliance CLI.
Note:Since malware may propagate using a number of methods, and botnet Command and Control (C) channels may use virtually any port, there should be no special restrictions/ACLs on the traffic fed to the Juniper ATP Appliance device.
Be sure to configure Email Journaling or Gmail BCC handling for the Juniper ATP Appliance Email Collector.
Note:Review all deployment prerequisites in the Juniper ATP Appliance Quick Start Guide for your products.
On the first boot of a virtual core (either AMI or OVA) with two disks configured, the appliance takes time to set up the second disk to be used. During this process, the system is not yet ready for use. This process may take up to 10 minutes.
Juniper ATP Appliance provides integration with firewalls, secure web gateways, and many other security devices.A large advantage of distributed defense is that Juniper ATP Appliance leverages your existing security infrastructure for mitigation and monitoring..Please note the following integration requirements:
Requires Microsoft Exchange 2010+ for the Email Collector
Junos version 12.1-X47.x for Juniper Firewall
Palo Alto Firewall Version x for Palo Alto
Cisco ASA Firewall - be sure to review the “ASA REST API Compatibility” section of the “Cisco ASA Compatibility” document to determine if the REST API is supported on a particular ASA hardware platform.
Check Point Firewall integration requires Check Point GAiA operating system release R76, R77, or later. Check Point IPSO and Secure Platform (SPLAT), which are predecessors of GAiA, are not supported.
Fortinet Firewall integration - latest release.
Carbon Black Response - latest release
McAfee ePO and Symantec - latest releases
Network Tapping
A tap is a device that permits unimpeded traffic flow while simultaneously copying all the traffic from a fullduplex link and sending the information to Juniper ATP Appliance Collectors for object analysis. Tap mode uses an external fiber tap (for GBIC ports) or a built-in internal tap (for 10/100/1000 Monitoring ports). In tap mode, the Juniper ATP Appliance Collector monitors the packet information as it traverses the full-duplex network segment. Like SPAN mode, Tap mode is passive.
Use a network tap to send a copy of network traffic from a network segment to the eth1 network monitoring port of the Juniper ATP Appliance Collector. The tap does not interfere with traffic and, if shut down, allows traffic to pass through unhindered.
SPAN Port Mirroring
The Switch Port Analyzer (SPAN) port on a switch is designed for security monitoring. It allows a connected Juniper ATP Appliance to receive a copy of every packet from all incoming and outgoing traffic moving through the switch. This is port forwarding or port mirroring; a passive non-intrusive packet capture method.
Configure a switch with port mirroring capability to forward a copy of incoming and outgoing traffic passing between selected ports to SPAN ports on the switch. Then, connect the SPAN port to the Juniper ATP Appliance (labeled eth1).
The Juniper ATP Appliance can be configured in SPAN mode by configuring a switch with port mirroring capability to forward a copy of incoming and outgoing traffic passing between selected ports to SPAN ports on the switch. Then connect the SPAN ports to the Collector (ports eth1).
Guidelines for Environments with Web Proxies
The following additional guidelines apply to environments with web proxies:
Refer to Configuring Proxy Settings for the Management Network for information about configuring and managing management network proxy settings from the Juniper ATP Appliance Web UI, and the Juniper ATP Appliance CLI Command Reference for information about configuring proxies from the Juniper ATP Appliance CLI.
Refer to Span-Traffic Proxy Data Path Support for more information about SPAN-Traffic proxy configurations.
If your environment contains web proxies or other NAT devices that obscure originating IP addresses, the Juniper ATP Appliance must be deployed in such a way that it sees web traffic from the internal (or LAN) side of the proxy. If misconfigured, the appliance reports the malicious site as being the LAN IP of the proxy. Misconfiguration may also obscure a compromised endpoint if the LAN IP address of the endpoint is not visible to the Juniper ATP Appliance. If your web proxy supports X-Forwarded-For (XFF) headers, the Juniper ATP Appliance Collector may be placed in front of or behind the proxy. You must make sure that the Collector has X-Forwarded-For support enabled via the CLI. Support for X-Forwarded-For headers is enabled by default.
The appliance must be able to see web (HTTP) traffic and traffic for other network protocols:
Botnet remote command and control traffic, as well as some types of exploits, may use protocols other than HTTP, so it is imperative to have visibility into non-web traffic. Support for this type of proxy is pending.
The Juniper ATP Appliance Collector is not able to decrypt SOCKS tunneled traffic, so if you use SOCKS proxies in your environment, the Juniper ATP Appliance Traffic Collector should SPAN a network segment that is outside the SOCKS proxy in order to monitor non-HTTP traffic.
Configuring Collector Email Journaling
After installing a Juniper ATP Appliance Core or All-in-One system, both of which contain an Email Traffic Collector in the Core component, you will need to configure an exchange server journal account for the Collector to poll, and set Postfix to forward Gmail Bcc (blind carbon copies) of all mail traffic to the Collector as a default forwarding mechanism.
Configuring Journaling for the Email Collector
- Email Journaling
- Creating a Journaling Mailbox on the Exchange Server
- Configuring a Mailbox Database
- Configuring Microsoft Exchange Server 2013 Journaling
- Configuring Exchange-Server Journal Polling from the Web UI
- Configuring Office 365 Journaling
- Configuring Gmail Journaling
- Configuring Gmail Threat Mitigation
- Delegating domain-wide authority to a Gmail service account
Email Journaling
Juniper ATP Appliance Traffic Collectors continuously monitor and inspect all network traffic for malware objects; extracting and sending objects to the Core for distribution to the Windows or Mac Detection Engines.
For Windows traffic, Microsoft Exchange Server journaling can be configured to record a copy (a journal) of enterprise email messages, and then periodically send them to a journal mailbox on the Exchange Server.
No email or email data is stored on the Traffic Collector. On the Juniper ATP Appliance Core, extracted objects and some meta data (such as source and destination email addresses, timestamp data, etc., are stored and Juniper ATP Appliance logs email header info in the log file. No text from the email is retained (except for the attachment(s) for malware detonation and analysis)
Exchange Server 2010 can be configured to support envelope journaling only. This means that a copy is made of each email message body and its transport information. The transport information is essentially an envelope that includes the email sender and all recipients.
The Juniper ATP Appliance Email Collector polls the Exchange Server for journal entries and as-scheduled, pulls all the emails in the journal account from the exchange server to the Collector. The Email Collector uses journaling for initial traffic analysis and email attachment monitoring/inspection. All email traffic (and email attachments) are sent from the Email Collector to the Juniper ATP Appliance Core for detonation in the Windows or Mac OS X detection engines.
When email-based malware or malicious email attachments are detected, the journal entry is incorporated into the analysis results by the Juniper ATP Appliance Central Manager and sent out as a notification to the Juniper ATP Appliance administrator, with corresponding mitigation and/or infection verification actions detailed in the Central Manager Web UI.
Juniper ATP Appliance supports journaling for Exchange 2010 and later.
To setup Email Collector Journaling, follow these procedures:
Creating a Journaling Mailbox on the Exchange Server
See also Configuring Microsoft Exchange Server 2013 Journaling.
Launch Microsoft Exchange Management Console.
Expand Recipient Configuration node and click on Mailbox node.Select New Mailbox… from the Actions pane.
Select New Mailbox… from the Actions pane.
Select User Mailbox option and click Next.
Select New user option and click Next.
New user mailbox details
Enter the ‘User information’ details for the Collector to which the new journaling mailbox will be assigned and click Next.
Enter an ‘Alias’ for the journaling mailbox and click Next.
Click Next again and review the new mailbox summary for the new mailbox to create, then click New.
Now that the journaling mailbox is created, configure standard journaling by configuring a Mailbox Database.
Configuring a Mailbox Database
In the Microsoft Exchange Management Console>Server Configuration, click on Mailbox database.
In the Toolbox Actions of Selected Mailbox Database, click on Properties.
In the Mailbox Database Properties page, go to the General tab and select the Journal Recipient checkbox, BUT, before selecting the checkbox, first click on Browse and choose which mailbox will get all messages from the mailbox database. After checking Journal Recipient, click OK to finish.
Configuring Microsoft Exchange Server 2013 Journaling
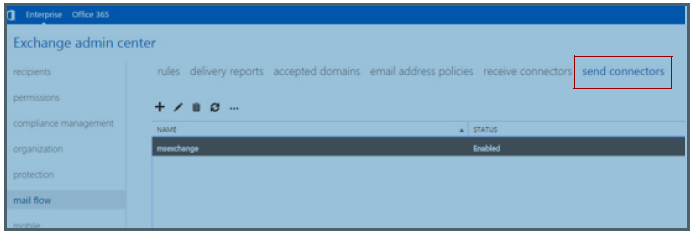
Login to the MS Exchange Server Admin Center at: https://exchnageserverip/ecp/
Select the Send Connectors tab.
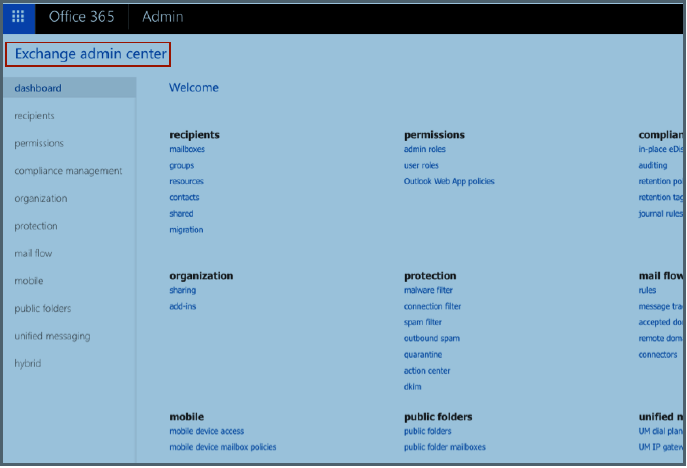
Figure 6: Exchange Admin CenterNavigate to mail flow>>send connectors and enter Send Connector settings:
Figure 7: Send Connector Settings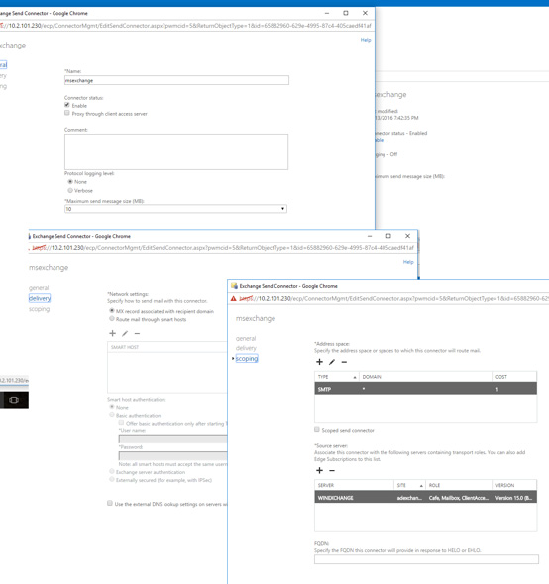
Save the connector settings.
Navigate to Compliance Management>>Journal Rules to configure Journal rules.
Provide the mailboxname and ip address in the “Send Journal Reports To” field .
Note:This should match the mailbox name configured at the Juniper ATP Appliance Email Collector Config>System Profiles>Email Collector Web UI page.
Figure 8: Setting Journal Rules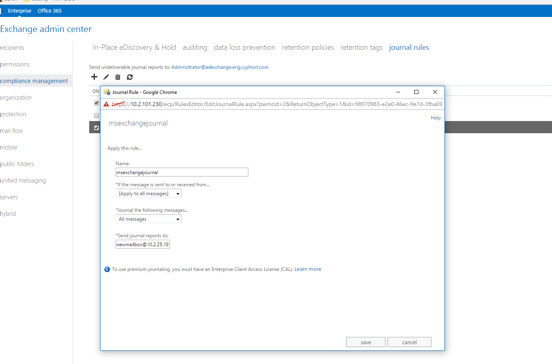
Refer to Configuring Email Collectors for information about configuring Email Collectors.
Configuring Exchange-Server Journal Polling from the Web UI
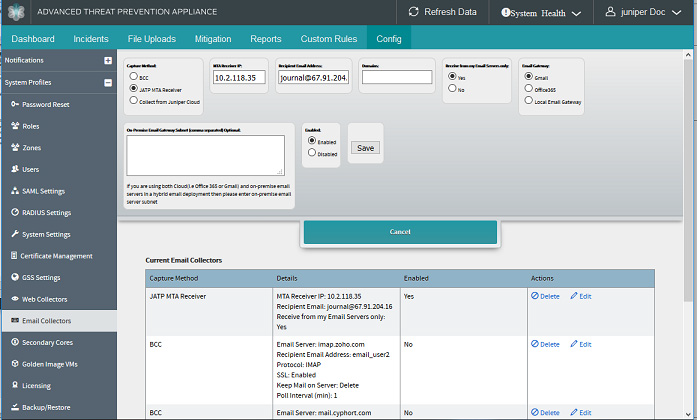
From the Juniper ATP Appliance Central Manager Config>EmailNavigate to compliance management>>Journal rules Collector page, click the Add New Email Collector button, or click Edit for an existing Collector listed in the Current Email Collectors table.
Enter and select the email journaling settings in the displayed configuration fields: Email Server [IP], Protocol, SSL, Mailbox Name, Password, Poll Interval (in minutes), Keep Mail on Server, and Enabled. [See following figure].
Configuring Office 365 Journaling
To set up Office 365 Journaling for Juniper ATP Appliance email mitigation:
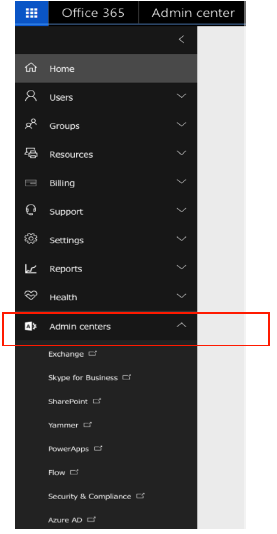
Log in to the Microsoft Office 365 Admin Center.
From the Office 365 Admin Center, select Admin Centers > Exchange.
Figure 9: Navigating to the Microsoft Office 365 Admin CenterFigure 10: Microsoft Office 365 Admin CenterSelect Compliance Management > Journal Rules.
Click on the + sign to add a new Journal Rule.
Complete the new journal rule form fields.
Configuring Gmail Journaling
Use the following procedure to configure email journaling for Gmail:
Navigate to the Google Admin Home site at https://admin.google.com/AdminHome.
From the Google Admin Console Dashboard, navigate to Apps->G Suite->Gmail->Advanced Settings.
Note:To view Advanced Settings, scroll to the bottom of the Gmail page.
Navigate to the Compliance Section and click Add Another Compliance Rule to setup deliver to the Juniper ATP Appliance MTA.
Figure 11: Google Gmail Admin Home Journaling Settings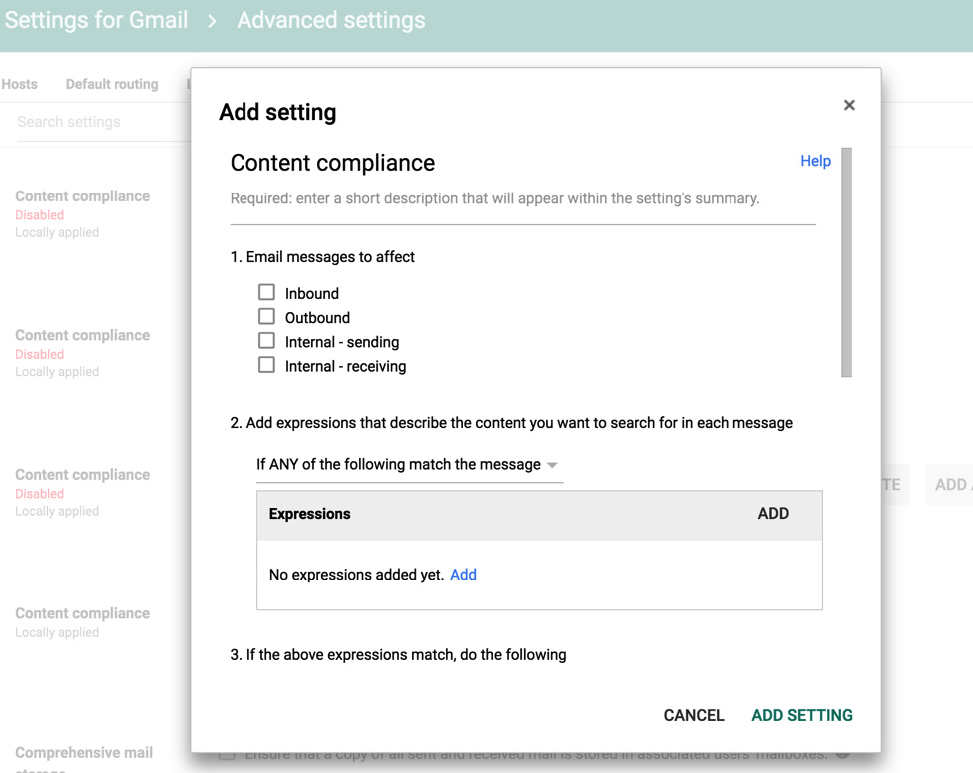
Select the options as displayed in the sample screenshot below (Setting 1 and 2):
Figure 12: Journaling Criteria required by Juniper ATP Appliance MTA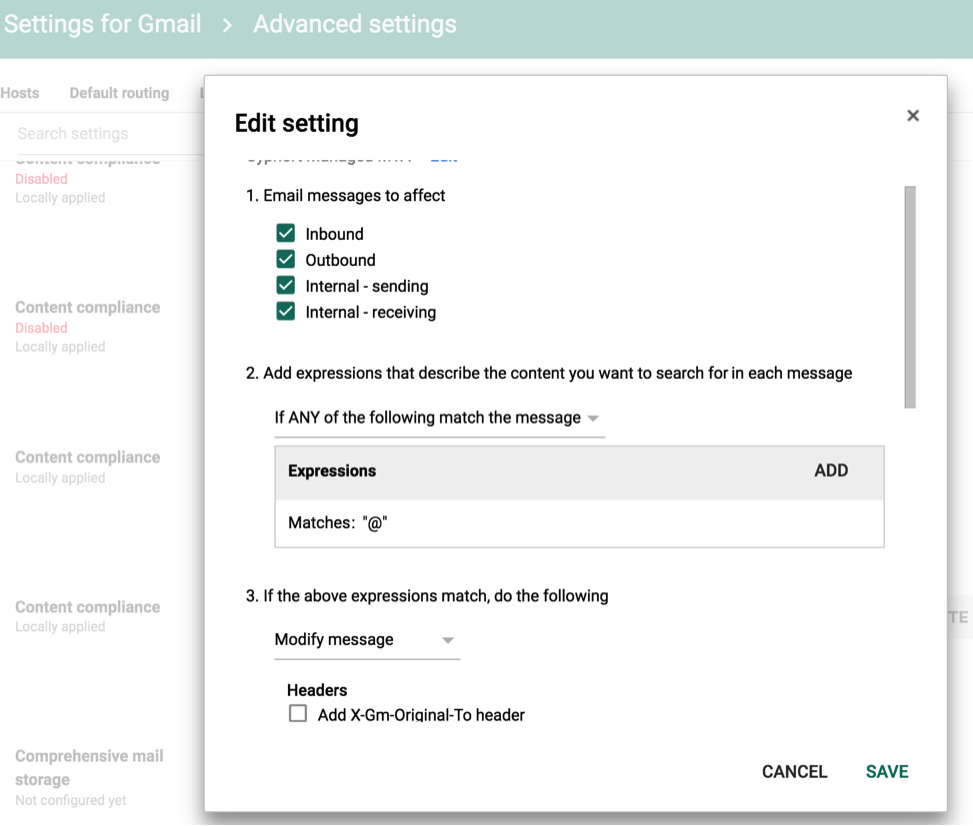
Be sure to add the Recipient information (this is the Juniper ATP Appliance MT); for example: JATP_mta@FQDN or JATP_mta@ip.
Figure 13: Setting the Juniper ATP Appliance MTA as the Gmail Recipient: JATP_mta@FQDN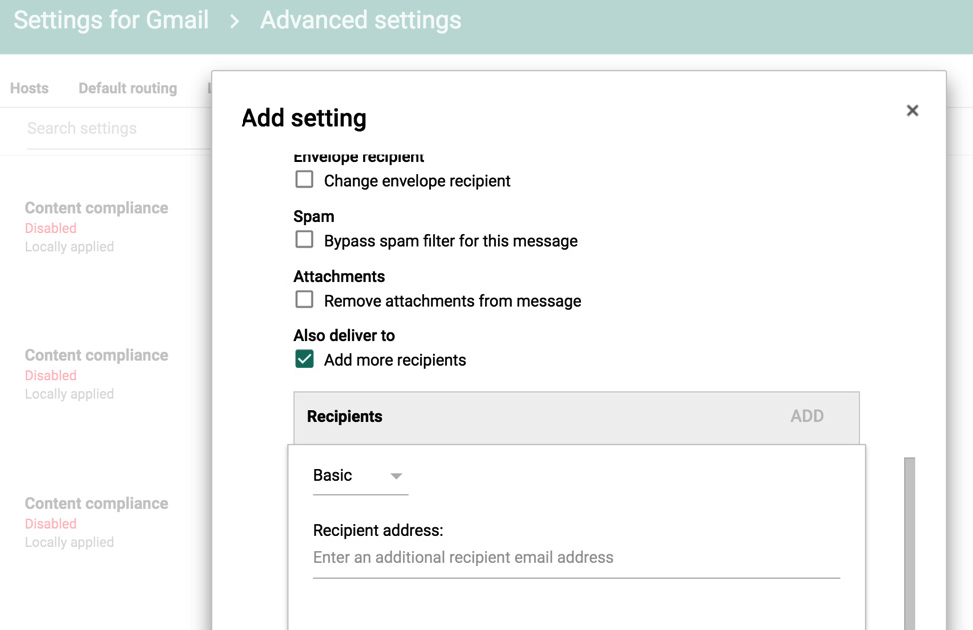
Configuring Email Detection Mitigations
You can configure Gmail and/or Office 365 for Juniper ATP Appliance Email threat event Mitigations. Mitigation Keys allow you to quarantine emails that are detected as malicious by using Gmail APIs or Office 365 APIs.
Configuring Gmail Threat Mitigation in the next section
Configuring Gmail Threat Mitigation
For enterprise environments using a Google Apps domain, an administrator of the Google Apps domain can authorize an application to access user data on behalf of users in the Google Apps domain. Authorizing a service account to access data on behalf of users in a domain is sometimes referred to as "delegating domain-wide authority" to a service account.
Delegating domain-wide authority to a Gmail service account
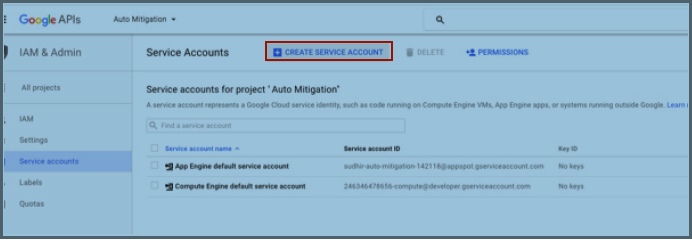
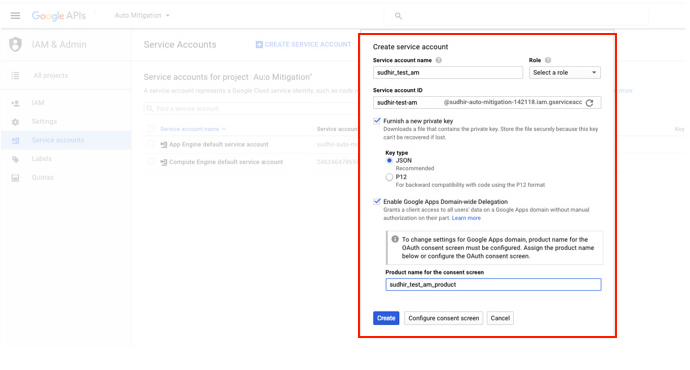
To delegate domain-wide authority to a Gmail APIs Service Account, first enable domain-wide delegation for an existing service account from the Google APIs Service Accounts page, or create a new service account with domain-wide delegation enabled.
To create a new Gmail Service Account:
Navigate to the Google APIs Service Accounts page.
Select an existing Project or Create A New Project from under the Project drop-down menu at the top left corner.
Figure 14: Navigate to the Google APIs Service Account pageFigure 15: Creating a New Google APIs Service AccountNext, navigate to your Google Apps domain’s Admin console.
Select Security from the list of controls. If Security is not listed, select More controls from the gray bar at the bottom of the page, then select Security from that list of controls. If no controls are available, then be sure you are signed in as an administrator for the domain.
Select Show More, then Advanced Settings from the list of options.
Select Manage API Client Access in the Authentication section.
In the Client Name field, enter the Service Account's Client ID. You can find your Service Account's client ID in the Service Accounts page.
In the One or More API Scopes field, enter the list of scopes to which your application should be granted access. For example, if your application requires domain-wide access to the GMAIL API, enter: https:// mail.google.com/.
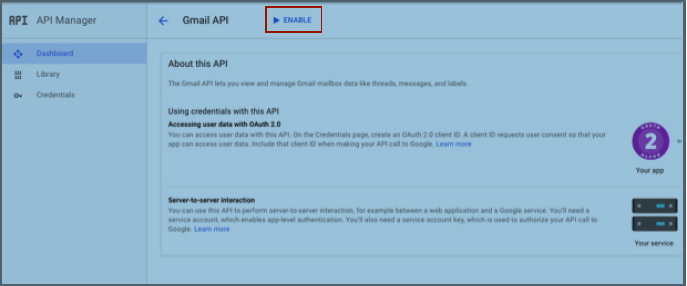
Figure 16: Accessing the Google APIs DashboardClick Authorize.
Note:Be sure to Enable GMAIL APIs by navigating to the Admin Console and clicking “ENABLE API” at the Dashboard under API Manager for the relevant project. Select GMAIL API and click Enable.
Using the Dashboard Views
The Dashboard tab includes four interactive, graphical sub-tab Dashboards:
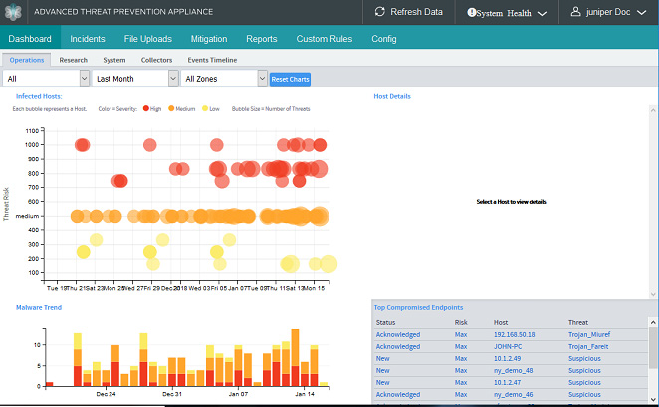
The Operations Dashboard depicts malware statistics for infected hosts (bubble chart threat view) and trends, including host details triggers, Golden Image compromise (if any), and top compromised endpoints.
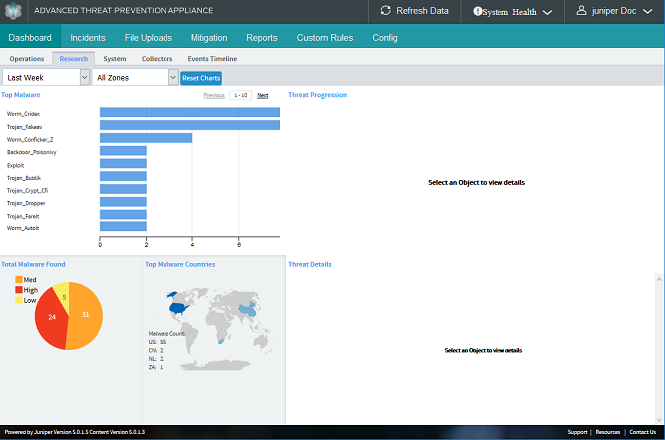
The Research Dashboard shows top malware by name and total malware found, as well as malware progression for infections and downloads (both HTTP ‘”north-south” and SMB “east-west” lateral) throughout the enterprise, with complete threat details per host IP address.
The System Dashboard shows traffic and performance information, including analyzed protocol traffic , current total traffic, Core utilization, objects processed, average analysis time and malware object statistics.
The Web and Email Collectors Dashboards show Juniper ATP Appliance Web and Email Traffic Collector trends as a measure of current total traffic, CPU usage. memory usage, objects analyzed, and overall threats. It also displays graphical per-Collector statistics plots, including Collector name, IP address, memory, CPU, Disk statistics, total current traffic, objects analyzed, threats, last threat seen, status (online/offline) and whether enabled/disabled.
The Event Timeline Dashboard displays Advanced Threat Analytics (ATA) data that focuses on the day to day workflow of Tier 1 and Tier 2 security analysts who work on triaging and investigating malware incidents. A host and user timeline depicts the details and context for the events that occurred on a host or user. Within minutes, a Tier 1 analyst—who is not a detection expert—can easily determine the course of action necessary for the incident. With ATA, analysts have comprehensive information to determine the exact nature of the threat and whether or not it is an advanced threat that requires escalation to Tier 2 teams for mitigation. The Tier 2 analyst is freed up to focus on vetted advanced threats and to use the timeline view provided by ATA to perform detailed investigations on the host and user. This holistic view of information results in provisioning the response teams with rich data that includes the threat context, the host identity, and the end user identity—with no manual data aggregation and analysis required.
The Operations Dashboard provides a context-specific graphical Threat View that includes statistical depictions of threat events, metrics, trends and severity scoring. The Infected Hosts section reports the total infected hosts and total number of incidents that have been observed on the monitored network for the time period selected as a bubble graph where each bubble represents a threat, and the bubble size indicates a number of threats.
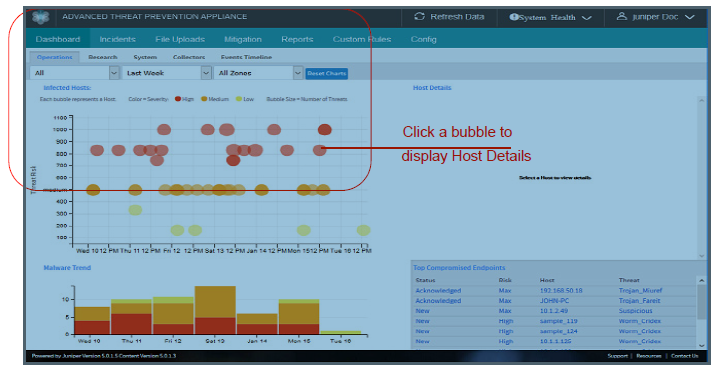
The Zone dropdown on the Operations Dashboard is displayed only when at least one zone is created. All Collectors are designated for the "Default Zone" initially but they must be formally assigned via the Central Manager Web UI Config>System Profiles>Web Collector pages.
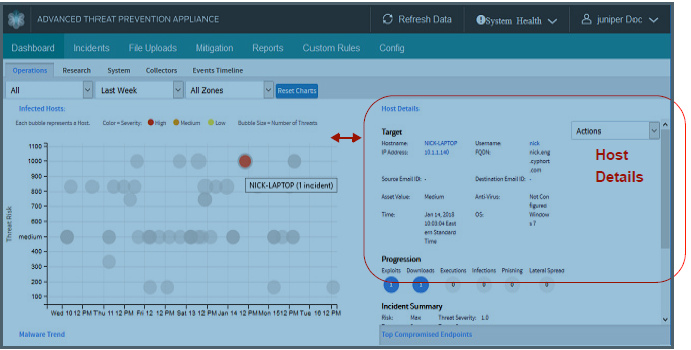
Use the Operations Dashboard Threat View interactivity to drill down into a selected host or malware incident’s statistics.
Click a Bubble to view Host Details in the section to the right of the bubble graph.
Double click a bubble [host] to open the Incidents tab with a focus on the selected host.
To submit a malware file for analysis, use the Upload File option on the Incidents page.
For more information, refer also to:
Understanding Risk Severity
Viewing SMB Lateral Detections
Interacting with Dashboard Views and Components
This section describes the Dashboard components for Dashboard tabs — the Operations, Research, System and Collectors Dashboard tabs, and describes how to interact with the various views and adjustable statistics and displays.
Operations Filter |
Filter threat view results by selecting one of the available filters from the drop down menu: All | New Only | Ack’d & In Progress | Complete |
Make a selection from the dropdown menu. |
Time Period (Operations Dashboard, Research Dashboard, System Dashboard Collectors Dashboard, Events Timeline) |
All Dashboard graphs are synchronized by the time period you select from the dropdown menu at the top of the table. Time period options include: Last 24 Hours Last Week Last Month Last 3 Months Last Year |
Make a selection from the dropdown menu. |
Reset Charts (both Malware Dashboard & System Dashboard) |
Resets all the graphs on the Dashboard to their original state for the time period selected. |
Mouse click |
Infected Hosts (Operations Dashboard) |
This bubble chart is the heart of the Threat View and depicts all infected hosts for the given time period. One bubble represents one infected host. The x axis of the chart represents the time period. The y axis represents the determined severity of the infection. The color of the bubble represents the tiered severity of the malware found on the host along the following spectrum: High (Red), Medium (Orange), Low (Yellow) The size of the bubble represents the total number of malware found on the host. 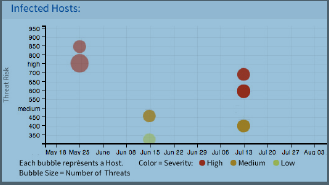 |
Mouse-Hover Over a Bubble “Host”
“ip/name (x threats)” Mouse-Click Over a Bubble “Host”
|
Host Details (Operations Dashboard) |
When an individual bubble is selected in the Threat View bubble graph, the Host Details data is displayed for that host, including data for malware Target, Kill Chain Stage Progression, Incident Summary and Triggers. The Kill Chain Progression contains more interactive data. |
Mouse click:
When a Kill Chain Progression bubble is clicked, the Incidents page is opened displaying the data for the specific Exploit(s), Download(s), Execution(s), Infection(s) and/or Phishing. |
Malware Trend (Operations Dashboard) |
Shows the malware trend for any give malware with given time frame. 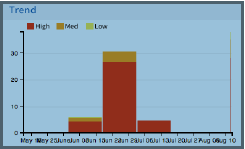 |
Select a bubble in the Threat View bubble graph to adjust Trend Malware timeline. |
Total Malware Found (Research Dashboard) |
A pie chart that shows malware severity percentages in High (Red), Medium (Orange) and Low (Yellow) 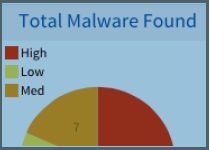 |
No interactivity |
Top Malware Countries (Research Dashboard) |
A geographical graph that displays the incidence of currently-detected malware across the globe. 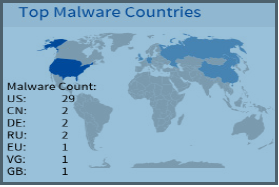 |
Opens Incidents Details page |
Top Compromised Endpoints (Operations Dashboard) |
Displays Status, Risk, Host and Threat per compromised endpoint represented.. 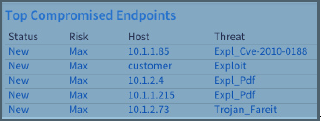 |
No interactivity |
Top Malware (Research Dashboard) |
Lists the top set of malware incidents by malware name for the selected time period. The x axis represents the number of infections; the y axis is the malware name. 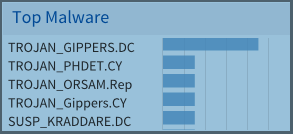 |
Mouse Click: Highlight a malware name in the Top Malware graph to see the Threat Progression display for that malware per endpoint host. The Threat Progression includes:
|
Threat Progression (Research Dashboard) |
Displays an interactive map of Infections and Downloads per malware selection. 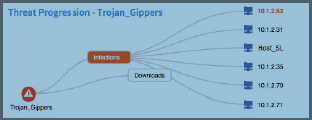 downloads to consecutive hosts across the enterprise is shown in the example below. |
Mouse Clicks:
|
Threat Details (Research Dashboard) |
Displays generalized threat details for the currently selected malware. But, when an endpoint is selected from the Threat Progression map, the displays adjusts to provide Host Details. 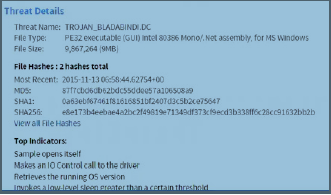 |
Mouse click: Click an endpoint IP address to display Host Details for that endpoint. The circle bullet for the selected endpoint turns orange when clicked. 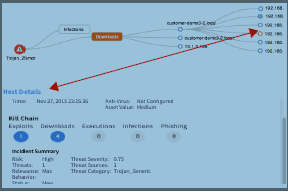 |
Traffic (System Dashboard) |
Displays the total network traffic relative to the Analyzed Protocol Traffic processed in Kbps within the selected time period. The x axis represents the time period in months; the y axis indicates Kbps. 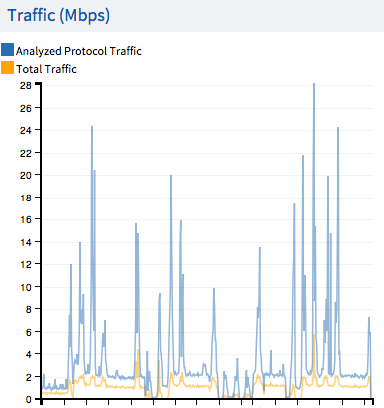 |
Mouse Hover: Perform a mouse hover over any part of the chart; the mouse pointer will turn into a crosshair: drag the mouse inside the chart to change the interval (x axis) for each of the three components. |
Core Utilization (%) (System Dashboard) |
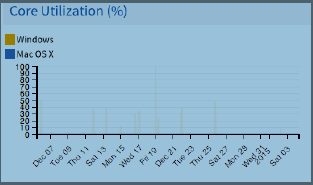 |
Mouse Hover: Perform a mouse hover over any part of the chart; the mouse pointer will turn into a crosshair: drag the mouse inside the chart to change the interval (x axis) for each of the three components. |
Average Analysis Time (Minutes) (System Dashboard) |
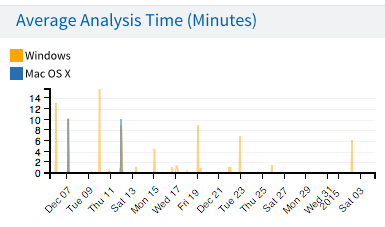 |
Mouse Hover: Perform a mouse hover over any part of the chart; the mouse pointer will turn into a crosshair: drag the mouse inside the chart to change the interval (x axis) for each of the three components. |
Objects Processed (System Dashboard) |
Displays the network objects processed within the selected time period. The x axis represents the time period in months; the y axis indicates number of objects. 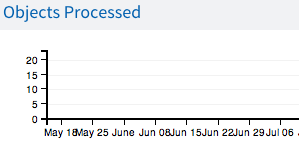 |
Mouse Hover: Perform a mouse hover over any part of the chart; the mouse pointer will turn into a crosshair: drag the mouse inside the chart to change the interval (x axis) for each of the three components. |
Malware Objects (System Dashboard) |
Displays the malware objects processed within the selected time period. The x axis represents the time period in months; the y axis indicates number of objects. 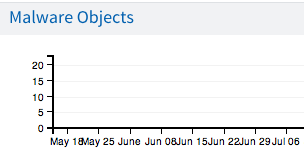 |
Mouse Hover: Perform a mouse hover over any part of the chart; the mouse pointer will turn into a crosshair: drag the mouse inside the chart to change the interval (x axis) for each of the three components. |
Trend (Collectors Dashboard) |
Displays stats for Collector(s) activity and trends. Display options are selected from the Trend dropdown menu and include Total Traffic, CPU Usage, Memory Usage, Found Objects and Malware Objects 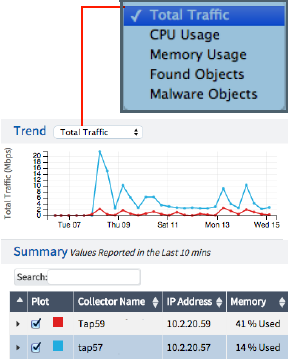 |
Select the Collectors to track from the Summary table below the plot. Values are updated every 10 minutes for each Collector. Click the Plot column(s) checkbox to plot the graphical information for selected Collectors. |
Vendor (Events Timeline Dashboard) |
Select a Vendor from your security infrastructure and view all correlated events for a specified Endpoint IP, Hostname, Username or Email: |
|
Resetting the Threat View
Reset the Dashboard to its original all-hosts, all-threats state by clicking Reset Charts.
Submitting a Malware File for Analysis
The File Uploads tab provides a mechanism for uploading malware files for analysis. The malware analysis results are generated and returned for display in the Details Uploads table, which also includes results for all files uploaded for malware analysis via the Juniper ATP Appliance API.
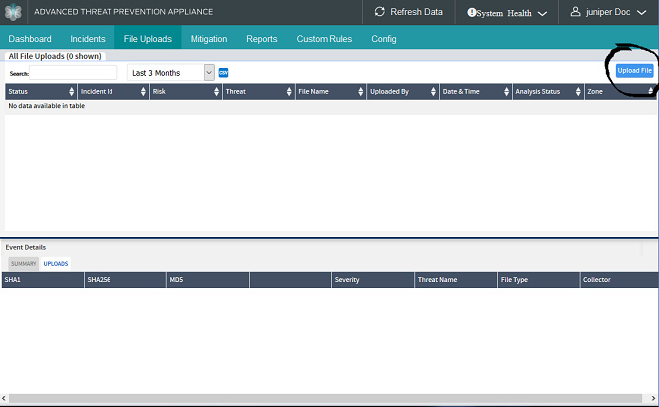
The File Uploads tab presents all uploaded files and analysis results (malicious and benign).
An enhanced file uploads API accepts additional meta-data for third party integrations such as Carbon Black to provide seamless integration with incidents.
Refer to the Juniper ATP Appliance HTTP API Guide for more information about the File Upload API.
When metadata is available and uploaded with the file to be analyzed, data points such as Target IP Address, Target OS, Source Address, and so on, then this metadata can be used in the analysis profile to create a true incident. In this case, such a file submission can instantiate a Download type of incident that contains all of the information available if the Traffic Collector had inspected the download directly.
To Upload a File for Analysis
Click the File Uploads tab, and in the “Submit file for analysis” window, select the file to upload for analysis and click the Submit file button.
Note:The maximum file size that you can upload for analysis is 32MB.
Figure 20: Submitting a File for Malware Analysis from the Incidents Tab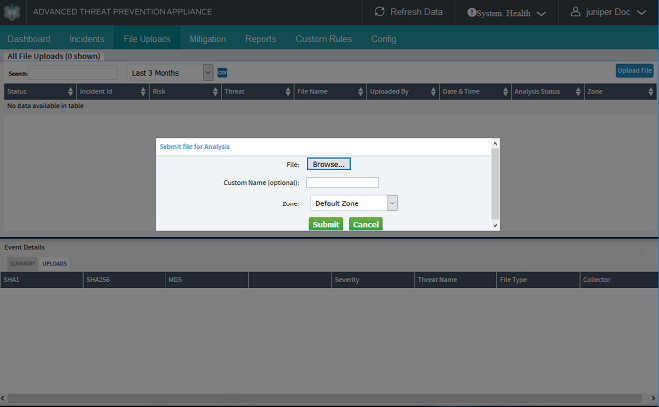
Upon file submission, a SHA1 is displayed.
The Upload File feature calls the “file_submit” API and then, following analysis, displays the results returned from the API in Central Manager Web UI File Uploads tab. The results are also displayed in the Incidents page table with the Kill Chain Progression designation: UP along with the incident sha1sum and filename.
You may also use the Juniper ATP Appliance HTTP API directly to submit files for analysis and get results and incident details via the API JSON outputs. Refer to the Juniper ATP Appliance HTTP API Guide for more information.
Regardless of whether a file is submitted to the Core for malware analysis from the HTTP API or via the Central Manager File Uploads page, the analysis results are always displayed on the File Uploads page.
Configuring Juniper ATP Appliance for Integrated Deployment
Juniper ATP Appliance is designed to integrate with and leverage your existing enterprise security infrastructure. Integrating Juniper ATP Appliance configurations with Firewalls, Proxies, Secure Web Gateways, and other services and devices, requires use of the Central Manager Web UI Config tab options as well as access to the other device or service’s Web UI or CLI to complete the integration.
Refer to the chapter on Configuring Distributed Defense for all Juniper ATP Appliance-side Web UI-based configuration procedures.
To integrate Enterprise network segments with Juniper ATP Appliance malware analysis and defense technologies, refer to Configuring Firewall Auto-Mitigation.
For Anti-Virus static analysis integration, refer to Configuring Anti-Virus Integration.
To configure data theft custom rules, refer to Configuring Anti-Virus Integration.
For PAN Firewall Auto-Mitigation integration, refer to Configuring Firewall Auto-Mitigation.
For Juniper SRX Firewall integration, refer to Defining a Zone-Defined SRX Configuration at the Juniper ATP Appliance Web UI.
For Cisco ASA Firewall Auto-Mitigation integration, refer toConfiguring Firewall Auto-Mitigation.
For Check Point Firewall Auto-Mitigation integration, refer to Configuring Firewall Auto-Mitigation.
For Proxy integration, refer to Configuring BlueCoat ProxySG Integration
For Carbon Black endpoint mitigation integration, refer to Configuring Carbon Black Response Endpoint Integration.
For Crowdstrike endpoint integration, refer to Configuring Crowdstrike Endpoint Integration.
Deploying Juniper ATP Appliance SaaS Virtual Collectors
Juniper ATP Appliance’s extensible deployment options include a Virtual Collector (vCollector) product: an Open Virtual Appliance, or OVA, that runs in virtual machines. Specifically, a Juniper ATP Appliance OVA-packaged image is available for VMware Hypervisor for vSphere via thin provisioning. This includes a 50 Mbps, 100 Mbps, 500 Mbps, 1.0 Gbps and 2.5 Gbps Virtual Collector model to Juniper ATP Appliance product support and services.
See Also: Deploying SaaS Virtual Cores as OVAs.
An OVF package consists of several files contained in a single directory with an OVF descriptor file that describes the Juniper ATP Appliance virtual machine template and package: metadata for the OVF package, and a Juniper ATP Appliance software image. The directory is distributed as an OVA package (a tar archive file with the OVF directory inside).
RECOMMENDATION: Juniper advises use of a dedicated physical NIC assigned to the vCollector for best collection results.
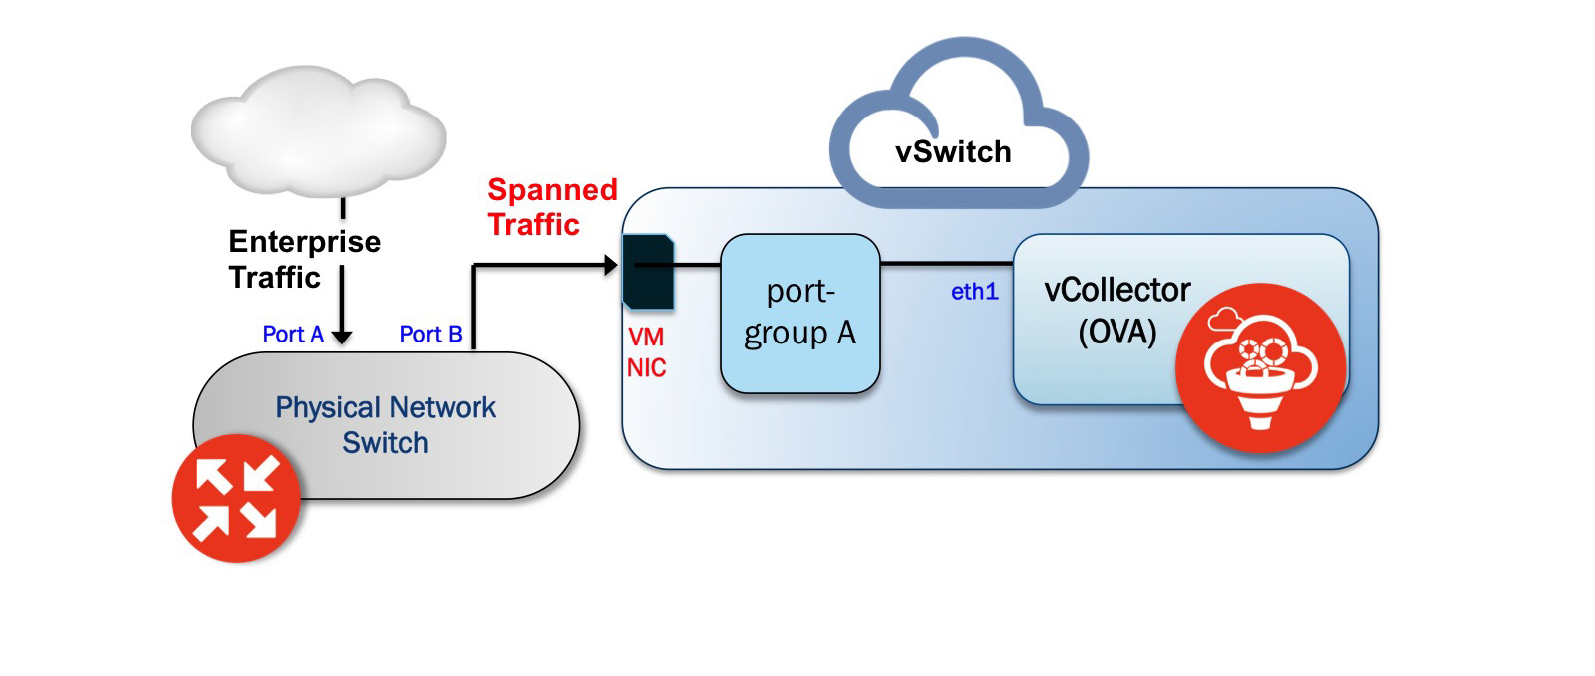
Virtual Collector Deployment Options
Two types of vCollector deployments are supported for a network switch SPAN/TAP:
Traffic that is spanned to a vCollector from a physical switch. In this case, traffic is spanned from portA to portB. ESXi containing the Juniper ATP Appliance vCollector OVA is connected to portB. This deployment scenario is shown in the figure above.
Traffic from a virtual machine that is on the same vSwitch as the vCollector. In this deployment scenario, because the vSwitch containing the vCollector is in promiscuous mode, by default all port-groups created will also be in promiscuous mode. Therefore, 2 port groups are recommended wherein port-groupA (vCollector) in promiscuous mode is associated with the vCollector, and port-groupB (vTraffic) represents traffic that is not in promiscuous mode.
Note:Traffic from a virtual machine that is not on the same vSwitch as the vCollector is not supported. Also, a dedicated NIC adapter is required for the vCollector deployment; attach the NIC to a virtual switch in promiscuous mode (to collect all traffic). If a vSwitch is in promiscuous mode, by default all port-groups are put in promiscuous mode and that means other regular VMs are also receiving unnecessary traffic. A workaround for that is to create a different port-group for the other VMs and configure without promiscuous mode.
Tip:There are two available options to deploying a Virtual Collector (regular as well as small form factor Collector): (1) Use the OVA installation method using vCenter; (2) Use OVF + VMDK without vCenter by directly installing on ESXi. There is no wizard available for deploying the vCollector using the second method; configure the collector from the CLI. For the virtual Core installations, only the OVA/ vCenter method is available.
Provisioning Requirements
The following table details resource and hardware provisioning required for an OVA vCollector deployment.
VM vCenter Version Support |
Recommended vCollector ESXi Hardware |
vCollector CPUs |
vCollector Memory |
|---|---|---|---|
VM vCenter Server Version: 5.5.0 vSphere Client Version: 5.5.0 ESXi version: 5.5.0 and 5.5.1 |
Processor speed 2.3- 3.3 GHz As many physical CORES as virtual CPUs Hyperthreading: either enable or disable |
CPU Reservation: Default CPU Limit: Unlimited Hyperthreaded Core Sharing Mode: None (if Hyperthreading is enabled on the ESXi) |
Memory Reservation: Default Memory Limit: Unlimited |
VDS and DVS are not supported in this release.
OVA vCollector Sizing Options
The sizing options available for a vCollector deployment are provided below.
Model |
Performance |
Number of vCPUs |
Memory |
Disk Storage |
|---|---|---|---|---|
vC-v50M |
50 Mbps |
1 |
1.5 GB |
16 GB |
vC-v100M |
100 Mbps |
2 |
4 GB |
16 GB |
vC-v500M |
500 Mbps |
4 |
16 GB |
512 GB |
vC-v1G |
1 Gbps |
8 |
32 GB |
512 GB |
vC-v2.5G |
2.5 Gbps |
24 |
64 GB |
512 GB |
It is important to reserve CPU and memory for any virtual deployment.
Refer to the Juniper ATP Appliance Traffic Collector Quick Start Guide for OVA Deployment vSwitch Setup instructions and information about installing the Juniper ATP Appliance OVA to a VM.
After installing the OVA vCollector, follow instruction in the Quick Start Guide for configuring the Web or Email vCollector using the Juniper ATP Appliance CLI and configuration wizard.
On the first boot of a virtual core (either AMI or OVA) with two disks configured, the appliance takes time to set up the second disk to be used. During this process, the system is not yet ready for use. This process may take up to 10 minutes.
Some of the configuration process is optional and can be skipped because several settings are addressed during OVA deployment of the VM vSwitch.
Deploying SaaS Virtual Cores as OVAs
Juniper ATP Appliance’s extensible deployment options now include a Virtual Core (vCore) detection engine product, as an Open Virtual Appliance, or OVA, that runs in virtual machines. Specifically, a Juniper ATP Appliance OVA-packaged image is available for VMware Hypervisor for vSphere 5.1 and 5.5 via thin provisioning. This release supports a 500 Mbps and a 1.0 Gbps Virtual Core model to Juniper ATP Appliance product support and services.
An OVF package consists of several files contained in a single directory with an OVF descriptor file that describes the Juniper ATP Appliance virtual machine template and package: metadata for the OVF package, and a Juniper ATP Appliance software image. The directory is distributed as an OVA package (a tar archive file with the OVF directory inside).
It is important to reserve CPU and memory for any virtual deployment. When initially deploying an OVA, the smaller size OVA is configured by default. Use the sizing guide to increase CPUs, memory and so on to the larger size as desired. Sizing information is provided on the previous page.
See the Juniper ATP Appliance Traffic Collector Quick Start Guide for information about the small footprint virtual collector option.
To install the Juniper ATP Appliance OVA to a VM
Download the Juniper ATP Appliance OVA file from the location specified by your Juniper support representative to a desktop system that can access VMware vCenter. See TIP at end of this section to optionally avoid the use of vCenter.
Connect to vCenter and click on File>Deploy OVF Template.
Browse the Downloads directory and select the OVA file, then click Next to view the OVF Template Details page.
Click Next to display and review the End User License Agreement page.
Accept the EULA and click Next to view the Name and Location page.
The default name for the Virtual Core is Juniper ATP Appliance Virtual Core Appliance. If desired, enter a new name for the Virtual Core.
Choose the Data Center on which the vCore will be deployed, then click Next to view the Host/Cluster page.
Choose the host/cluster on which the vCore will reside, then click Next to view the Storage page.
Choose the destination file storage for the vCore virtual machine files, then click Next to view the Disk Format page. The default is THIN PROVISION LAZY ZEROED which requires 512GB of free space on the storage device. Using Thin disk provisioning to initially save on disk space is also supported.
Click Next to view the Network Mapping page.
Set up the vCore interface:
Management (Administrative): This interface is used for management and to communicate with the Juniper ATP Appliance Traffic Collectors. Assign the destination network to the port-group that has connectivity to the CM Management Network IP Address.
Click Next to view the Juniper ATP Appliance Properties page.
IP Allocation Policy can be configured for DHCP or Static addressing-- Juniper recommends using STATIC addressing. For DHCP instructions, skip to Step 12. For IP Allocation Policy as Static, perform the following assignments:
IP Address: Assign the Management Network IP Address for the vCore.
Netmask: Assign the netmask for the vCore.
Gateway: Assign the gateway for the vCore.
DNS Address 1: Assign the primary DNS address for the vCore.
DNS Address 2: Assign the secondary DNS address for the vCore.
Enter the Search Domain and Hostname for the vCore.
Complete the Juniper ATP Appliance vCore Settings:
New Juniper ATP Appliance CLI Admin Password: this is the password for accessing the vCore from the CLI.
Complete the Juniper ATP Appliance vCore Settings:
New Juniper ATP Appliance CLI Admin Password: this is the password for accessing the vCore from the CLI.
Juniper ATP Appliance Central Manager IP Address: If the virtual core is stand-alone (no clustering enabled) or Primary (clustering is enabled), the IP address is 127.0.0.1. If the virtual core is a Secondary, the Central Manager IP address will be the IP address of the Primary.
Juniper ATP Appliance Device Name: Enter a unique device name for the vCore.
Juniper ATP Appliance Device Description: Enter a description for the vCore.
Juniper ATP Appliance Device Key Passphrase: Enter the passphrase for the vCore; it should be identical to the passphrase configured in the Central Manager for the Core/CM. Click Next to view the Ready to Complete page.
Do not check the Power-On After Deployment option because you must first (next) modify the CPU and Memory requirements (depending on the vCore model--either 500Mbps, or 1Gbps; refer to OVA vCollector Sizing Options for sizing information.
To configure the number of vCPUs and memory:
Power off the vCore.
Right click on the vCore -> Edit Settings
Select Memory in the hardware tab. Enter the required memory in the Memory Size combination box on the right.
Select CPU in the hardware tab. Enter the required number of virtual CPUs combination box on the right. Click OK to set.
To configure CPU and memory reservation:
For CPU reservation: Right click on vCore-> Edit settings:
Select Resources tab, then select CPU.
Under Reservation, specify the guaranteed CPU allocation for the VM. It can be calculated based on Number of vCPUs *processor speed.
For Memory Reservation: Right click on vCore -> Edit settings.
In the Resources tab, select Memory.
Under Reservation, specify the amount of Memory to reserve for the VM. It should be the same as the memory specified by the Sizing guide.
If Hyperthreading is enabled, perform the following selections:
Right click on the vCore -> Edit settings.
In the Resources tab, select HT Sharing: None for Advanced CPU.
Power on the Virtual Core (vCore). NOTE: For future reference, allowlist rules rely on normal service shutdown to be backed up. Powering off a VM or Virtual Core directly will lose the current allowlist state because the rules cannot be saved in that case.
Log into the CLI and use the server mode “show uuid” command to obtain the UUID; send to Juniper ATP Appliance to receive your license.
When an OVA is cloned to a create another virtual Secondary
Core, the value for column "id" in the Central Manager Appliance table
is the same by default. Admins must reset the UUID to make it unique.
A new Virtual Core CLI command “set id” is available to
reset the UUID on a cloned Virtual Core from the CLI’s core
mode. Refer to the Juniper ATP Appliance CLI Command Reference to
review the new Core mode "set id" and "show id" commands.
Upgrading of software and security content is automatic when upgrades are configured from the Central Manager Web UI Config>System Settings>System Settings page.
To enable automatic upgrades, check the “Software Update Enabled” and/or “Content Update Enabled” options on the System Settings page.
All automatic updates from all Juniper ATP Appliance components are coordinated and implemented by the Juniper ATP Appliance Core. Ongoing updates take place on a regular schedule:
The Core software and content update (if enabled) checks for available updates every 30 minutes and pushes new files to the Collectors and/or Secondary Cores.
The Core detonation engine image upgrade check occurs daily at midnight.
Upgrading without Allowlisting
Juniper ATP Appliance continues to reduce its operational footprint and no longer requires an extensive set of allowlist external IP addresses for upgrades, telemetry, content updates and other services.
Firewall ports opened previously for specific services can be closed after a Release upgrade is complete.
Note that most modern firewalls support domain allowlists.
Customers can optionally allow just outbound access to the Core/CM device* (not collectors) on HTTPS (port 443); no domain allowlist is required in this case.
*Juniper ATP Appliance has always recommended allowing un-fettered outbound communications for the Core/CM appliance (or All-in-One) in order to allow for kill-chain correlation in sandbox detonations.
Customers concerned about a comprehensive allowlist on port 443 can restrict the allowlist to just Amazon AWS and S3 CIDRs - but note that this is still a quite large range of IP addresses.
About Juniper ATP Appliance Remote Support
Enabling Remote Support allows Juniper Technical Support to SSH into a Juniper ATP Appliance at the customer site to perform troubleshooting activities. The Juniper Support account can be disabled either through the Central Manager Web UI (Config > System Profiles >Remote Support), or via the CLI (see instructions below).
Note the following about Juniper Support accounts and Remote Support.
A Juniper Support account is created only when a product license key is uploaded from the CM Web IU during a product installation.
Adding a license manually does not enable support.
Always use the latest version of Putty for SSH operations, if using Putty as an SSH client.
After an upgrade, an existing Juniper Support account will be maintained; no action is necessary.
If you disable an enabled Juniper Support account, the change will automatically propagate to connected Collectors and Secondary Core Mac OSX Detection Engines.
When a system is installed from AMI, OVA or ISO, the support password is not enabled by default, but rather is set during licensing, then enabled manually. When installing Juniper ATP Appliance AMI, OVA or ISO software, first upload the license and then enable Juniper Support.
Managing your Remote Support Account
- Enabling your Remote Support Account
- Resetting the Administrator Password
- Audit Logs Display UI or CLI Access
Enabling your Remote Support Account
You can enable remote support account either from UI or CLI.
Enable remote support account from the UI
To enable the support account from the Web UI:
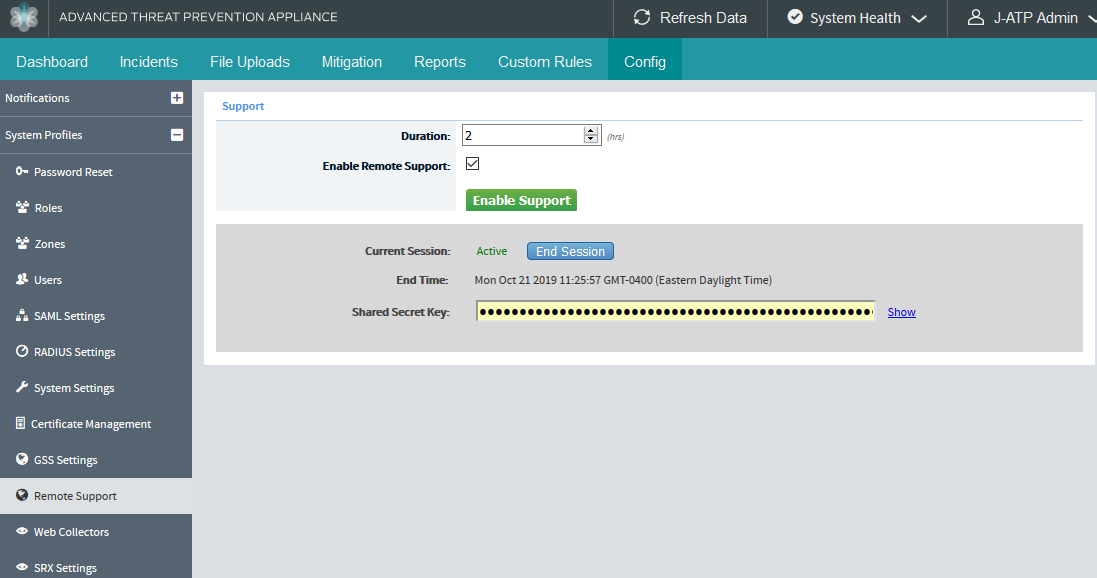
Select Config > System Profiles >Remote Support.
In the Remote Support page, select the Enable Remote Support option.
In the Duration field, enter the time duration (in hours) for the session.
Click Enable Support.
The support password is generated using two secret keys:
One key is automatically obtained by Juniper Support from the ATP Appliance device when Remote Support is enabled.
The other key is provided by Juniper Networks.
When you enable Remote Support, the UI refreshes to display a new secret key as shown in Figure 22. The secret key is unique for every support session.
If ATP Appliance is in Private Mode, Juniper Support cannot automatically obtain the ATP Appliance device secret key. The secret key must be shared manually with the Juniper support team.
If you end a session before it expires or if the session expires on its own, there is a 15 minute grace period where you can extend the session using the same key, but you cannot open a new session. When the grace period expires, you are automatically logged out of the session.
Enable remote support account from the CLI
To enable the support account from the CLI:
T Log in to the CLI, enter server mode, then use the set cysupport enable on command.
user:core# (server)# set cysupport enable on
Enter the Remote Support duration in hours.
Remote support duration (In Hours): 4
Juniper Support User account enabled successfully!
If you need to obtain the secret key from the CLI, use the show remote-access-key command.
user:core# (server)# show remote-access-key
To check Juniper Support status from the CLI, use the show support command.
user:core# (server)# show support
Any Juniper Support changes, such as enable, disable or reset password (even those triggered by a newly installed license key) may take at most 5 minutes to take effect on the Collector or Mac OSX Secondary Core.
Resetting the Administrator Password
To recover the administrator password, you must have physical access to the appliance. You cannot reset the administrator password remotely.
A user with the name “recovery” can log into the appliance without a password and enter a limited amount of commands, including a command to reset the administrator password.
To recover the administrator password using CLI, do the following:
When prompted to login, enter the user name recovery on the appliance and press Enter.
user login: recovery
*******************************************************************
Juniper Networks Advanced Threat Prevention Appliance
*******************************************************************
Welcome recovery. It is now Wed Jan 01 12: 00:00 PDT 2020
user:Core#
exit                 help                 history                 reset-admin-password
Since no password is required the recovery user is automatically logged into the device.
Enter the
reset-admin-passwordcommand to reset the password.user:Core# reset-admin-password
The other commands available to the recovery user are: exit, help, and history.
In addition to viewing UI users in the audit logs, you can now also view admin and recovery-admin CLI users in the audit logs, under Reports in the Web UI. See Audit Logs Display UI or CLI Access for details.
Audit Logs Display UI or CLI Access
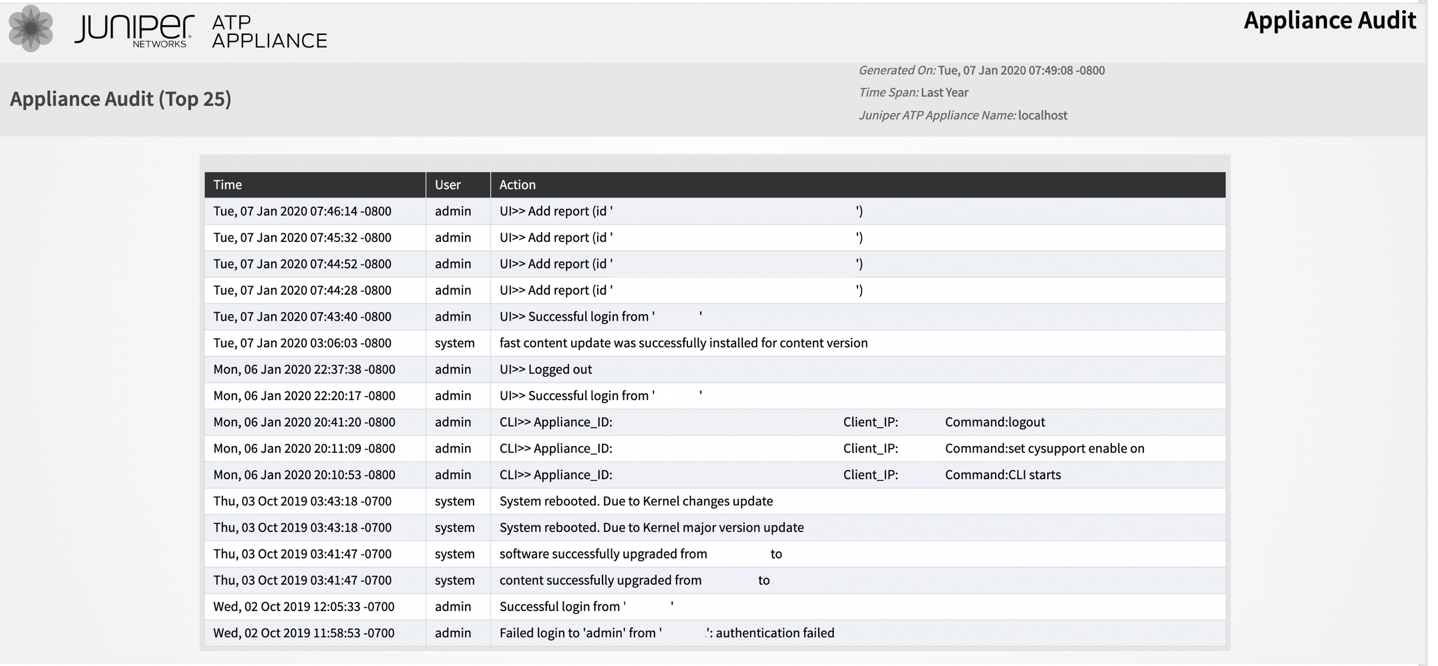
In addition to UI audit logging, there is core and collector CLI activity audit logging. Along with the log data, you can see if the action was performed from the UI or the CLI. See Figure 24.
You can also view the audit logs for software update, static content update, and fast content update that was done either in normal mode or private mode. See Figure 23.
These logs are available from the ATP Appliance UI portal from the Reports tab and in the system log server (the same as previous UI audit logs).

Checking the System Health of ATP Appliance
This section describes how to determine whether there are any health issues with the ATP Appliance appliance.
To check the ATP Appliance system health:
Log into ATP Appliance UI.
Click System Health option that is available at the top-right corner of the page.
The following services are displayed:
Behavior Engine
Static Engine
Correlation
Internet
Web collectors
Secondary Core
Check whether any services are down (look for a red exclamation mark). All indicators should display the green checkmark which indicates that the systems are in good health. If a red indicator is displayed, then troubleshooting actions are required.
If the Behavior Engine, Static Engine, or Correlation is down, check the system dashboard for sudden spikes in core utilization or in the objects processed. Also, during an auto update, all these processes get restarted, so if you see the health status as red, give it 10 minutes, and then re-login to check if the health status is green again.
Sometimes, behavior engine might be down due to unavailability of compatible images, update server not reachable, or insufficient disk space. You can see the status of the behavior engine and the image download.
In normal mode, you can see the status of the image download and behavior engine. You can also view the availability of the required images on the device to start the behavior engine. If the behavior engine does not start due to unavailability of compatible images, you can choose to start the image upgrade immediately by clicking the Start Update button as shown in Figure 25 or wait for automatic upgrade at the scheduled interval.
Figure 25: On-demand Image Upgrade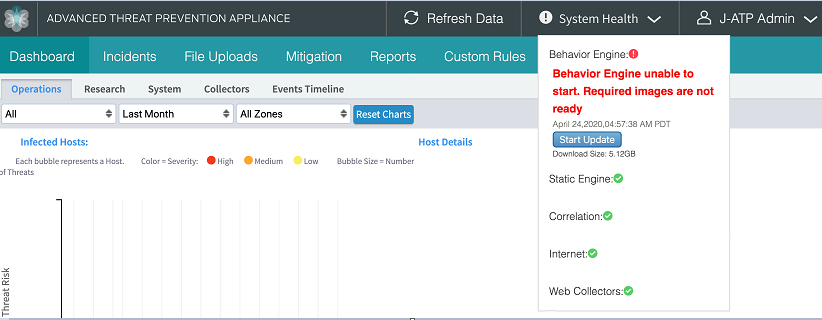
In private mode, customers can upload the required images using ATP Appliance UI or CLI. The uploaded images are audited and the status of the audit is displayed. A sample status message is shown in Figure 26.
Figure 26: Audit Status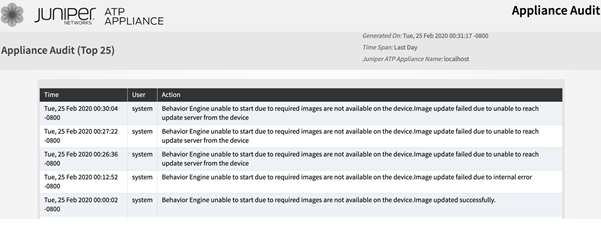
To view the logs for image update, navigate to Reports section and select Report Category as Technical Report , Report Name as System Audit, and Event Type as Software Update.
If Internet status is red, make sure that the ATP Appliance management IP address has port 443 open to *.cloud.cyphort.com.
If the health status is red for Web Collectors, check the Collectors dashboard. Click the triangle beside each Collector to know the services on the Collector that are down.
If Secondary Core is red, make sure that it is online and reachable from ATP Appliance.
Configuring an Alternate Analysis Engine Interface
When network objects are detonated during detection procedures in Core analysis engines, some of them generate network traffic to malicious CnC servers. An optional eth2 interface can be configured for a primary and/ or secondary Core (Mac Mini) or a Virtual Core in order to transmit CnC-specific generated traffic via a different network as an alternate exhaust option.
Review all deployment prerequisites in the Juniper ATP Appliance Quick Start Guide for your SSH Honeypot Requirements
The SSH Honeypot feature detects any attempts to connect to an SSH server in the enterprise network.
A honeypot deployed within a customer enterprise network can be used to detect network activity generated by malware attempting to infect or attack other machines in a local area network. Attempted SSH login honeypots are used to supplement detection of lateral spread. Multiple honeypots can be deployed on a customer Traffic Collector from which event information is sent to the Juniper ATP Appliance Core for processing. Customers can place honeypots on any local network they desire.
A malicious actor attempting to perform brute force SSH entry, or execute targeted SSH access to a “root” account, will also be detected by the Juniper ATP Appliance SSH Honeypot feature.
The Juniper ATP Appliance Central Manager Web UI Incidents tab includes results for the SSH Honeypot feature.
Results of SSH Honeypot detections are displayed on the Central Manager Web UI Incidents page, and included in generated Reports. Data sent to the Juniper ATP Appliance GSS for honeypot detection events include “Threat Target” and a detailing of all attempted “SSH sessions” (including username and password) with timestamps.
Requirements for setting up SSH honeypot lateral detection:
Be sure the honeypot Collector has a minimum of four interfaces (eth0, eth1, eth2, eth3 [honeypot])
Place an SSH server on a network
Log any attempts to connect to the server
Enable the SSH honeypot feature from the Juniper ATP Appliance CLI
If enabling honeypot functionality during an UPGRADE of Juniper ATP Appliance software, the upgrade must be performed twice to ensure that the virtualization emulator is fully updated to the correct version.
Note:SSH Honeypot detections are not relevant for TAP mode Collector deployments.
To configure and monitor SSH honeypot incidents:
Refer to the Juniper ATP Appliance CLI Command Reference for information about configuring SSH Honeypot.
Refer to the Juniper ATP Appliance Traffic Collector Quick Start Guide for information about using the eth3 port for all outbound Collector traffic.

