ON THIS PAGE
Juniper ATP Appliance’s Adaptive Detection Fabric: Defense-in-Depth
Traffic Collector Performance, Confidence and Diagnostics Displays
YARA Rules for Detecting Lateral Spread within a Customer Network
Reverse SSH Tunneling for Optimizing Customer Technical Support
Manager of Central Managers (MCM) Virtual or Hardware Device
Introduction
The following topics are in this chapter:
Juniper ATP Appliance’s Adaptive Detection Fabric: Defense-in-Depth
Security experts agree that cyber threat solutions are not keeping pace with emerging criminal ecosystems. Evolving threat strategies employ stealthier and more insidious mechanisms for infiltrating networks and stealing intellectual property and proprietary data. The increasing use of cloud computing, BYOD and social media in multi-platform enterprise environments means that the industry-wide requirement for “defense in depth” is just getting deeper and deeper.
Juniper ATP Appliance’s continuous traffic monitoring and seamless, extensible, multi-thread, multi-platform malware detonation engine Cores provide truly actionable, context-aware detection and intelligence. This is Juniper ATP Appliance’s Adaptive Detection Fabric. Juniper ATP Appliance products detect evasive threats that cause breaches using a unique combination of Smart Core Technology: behavioral analysis and machine learning that empowers each enterprise’s incident response team with prioritized alerts that eliminate overload and significantly reduce response time.

Juniper ATP Appliance is the industry's first distributed threat protection solution deployed wide and deep to provide a context-aware, multi-platform advanced threat detection and mitigation system, stopping targeted and zero-day attacks along all web and email Kill Chain vectors. With adaptive, anti-evasion detection, Juniper ATP Appliance intelligence and analysis information evolves with advanced threats.
Web-borne Threats:
The Juniper ATP Appliance Web Traffic Collector protects an enterprise against web-borne threats. Web Traffic Collectors provide continuous monitoring and inspection of network traffic either through a mirror/ monitor port on a switch, a network tap, or a load balancer. The Juniper ATP Appliance Web Collector analyzes network traffic and communications, performing packet captures and assessing for indications of malware. Following the initial inspection and analysis phase, the Web Collectors deliver all network objects for detonation inside the Juniper ATP Appliance Core detection engines, identifying and testing the characteristics of detected malware using instrumented virtualization and emulation technologies. The Traffic Collector extracts payload along with envelope information which is sent to the Core. Web collectors also detect command and control (CnC) communications.
Email-borne Threats and Email Phishing Correlation:
Juniper ATP Appliance also provides protection against email attack vectors, defending against spear phishing attacks by detecting and preventing advanced malware from infecting the endpoint via attachments and URLs in emails intended to compromise a host and/or initiate CnC extraction of sensitive organizational data. The Email Traffic Collector can be configured for BCC or Email Journaling via a Mail Transfer Agent (MTA) Juniper ATP Appliance Receiver.
Core Windows & Mac OSX Threat Detonation Engines:
As part of the Juniper ATP Appliance Core, multi-phase, multi-OS detonation engines perform detailed, context-aware forensic analysis of advanced malware, zero-day, and targeted APT attacks embedded in common file formats, email attachments, URLs binaries, and web objects. The Core and Mac OSX Secondary Core also perform callback analysis to track advanced malware and exfiltrations.
Flexible Appliance-based, Software-Only, VCore for Amazon Web Services (AWS), or OVA VM Distributed Deployments
The Juniper ATP Appliance scalable threat protection system via Juniper ATP Appliance deployments, SaaS or VM options, is designed to integrate with, and leverage, existing infrastructure and network security services. Juniper ATP Appliance allows you to customize its technology and components to match your network environment.
SMB Lateral Detection Support:
Via the Juniper ATP Appliance Advanced license, monitoring and analysis of the SMB protocol stack includes extract ion of file transmissions between clients or between clients and servers, similarly to the way Juniper ATP Appliance currently monitors HTTP traffic. With SMB lateral detection, the endpoint that downloads malware is the target endpoint, and the host that serves the malware is the threat source. The incident uses each of these hosts’ IP addresses. This “east-west” traffic monitoring, in addition to established “north-south” monitoring of ingress and egress traffic, helps identify malware as it spreads to other hosts within an enterprise, tracking the progression from “patient zero.” Because HTTP is rarely used to communicate between endpoints within an organization, SMB (See SMB Lateral Detection) is a proven candidate for malware transmission within the organization and across file shares.
Network and Endpoint Mitigation with Remediation Prioritization:
Juniper ATP Appliance generates actionable intelligence and provides mitigation options for each determined threat; this is a large part of the Juniper ATP Appliance advanced defense system. Prioritization of mitigation actions in the network path and at the enterprise endpoint, specifically for the threats that matter the most to your enterprise, are derived from a combination of threat intelligence assessments referred to as the Juniper ATP Appliance Threat Metric:
Threat Severity — The behavior and goal of the detected malware
Threat Progression — The stage of the attack’s Kill Chain
Threat Relevance — Whether the malware was recognized or blocked by static analysis scanners like VirusTotal; whether the targeted OS was available on the targeted endpoint; whether execution of a download took place at the endpoint; and whether the custom-configured asset value for the network segment that was attacked represents a significant risk to the enterprise
For more information, refer to Threat Metric Prioritization Mapping of this guide
Open API Platform Incident Tracking:
The Juniper ATP Appliance Central Manager also provides a comprehensive open platform HTTP-based API for accessing all threat and processing data as well as device and software configuration. See Juniper ATP Appliance HTTP API.
Juniper ATP Appliance’s architecture allows for faster, more accurate detection. The Juniper ATP Appliance system employs four cooperative dimensions of malware analysis with correlated machine learning:
Network
Static
Reputation
Dynamic (Behavioral)
Juniper ATP Appliance detection and analysis is context-aware and identifies infected endpoints while providing actionable intelligence about each infection. Juniper ATP Appliance catches zero-day threats, including armored and VM-resistant malware against more file types and more platforms, with more behavioral traces than any other technology, using real machine learning as opposed to heuristic shortcuts.
Juniper ATP Appliance products provide details of the threat incidents detected for a specific attack vector and supports notification, reporting, and real-time integration with blocking mitigation and security analysis work flows.
Advanced Threat Analytics (ATA)
Juniper ATP Appliance’s Advanced Threat Analytics features are critical to incident response, providing a comprehensive view of threat activities. While many organizations have implemented security information and event management (SIEM) platforms, the lack of unified threat context limits the effectiveness of the operational intelligence that allows immediate, informed responses to threats. Juniper ATP Appliance ATA enables your security team to maximize the value of the intelligence captured by your existing security tools, allowing analysts to optimize their ability to analyze and respond to data from SIEM systems while providing a better understanding of the incident context associated with SIEM events.
Juniper ATP Appliance ATA is a holistic view of threat activity from diverse information sources such as:
Active Directory
Endpoint Anti-Virus,
Firewalls
Secure Web Gateways
Intrusion detection systems
Endpoint Detection and Response Tools
Traditional security devices collect valuable information, but most of it goes unused as the devices are not specifically looking for advanced threats. Juniper ATP Appliance’s ATA looks at data from different sources, identifies advanced malicious traits and correlates the events to provide complete visibility into the kill chain of a threat. This becomes especially useful in the case of noisy devices such as intrusion prevention systems. And customers that do not use SIEM also benefit because ATA ingests data directly from other security devices in their network to secure them from cyber attack.
Juniper ATP Appliance ATA focuses on the day to day workflow of Tier 1 and Tier 2 security analysts who work on triaging and investigating malware incidents. A host and user timeline is provided to the security analyst to reveal the specific events that occurred on the targeted host. Within minutes, a Tier 1 analyst—who is not a detection expert—can easily determine the course of action necessary for the incident. With ATA, analysts have comprehensive information to determine the exact nature of the threat and whether it is an advanced threat that requires escalation to Tier 2 teams for mitigation. The Tier 2 analyst is freed up to focus on vetted advanced threats and to use the timeline view provided by ATA to perform detailed investigations on the host and user. This holistic view of information results in providing response teams with rich data that includes the threat context, the host identity, and the end user identity—with no manual data aggregation and analysis required.
Single Pane View of Advanced Persistent Threats (APTs)
By providing a single-pane-of-glass view of advanced threats coming from both the enterprise perimeter as well as laterally from within an enterprise network, Juniper ATP Appliance’s visibility and correlated intel uniquely identify the next generation of threats (that often evade other solutions) so an administrator or incident response team can quickly mitigate the threat to the enterprise.
Juniper ATP Appliance Cyber Threat Kill Chain Progressions
A “Kill Chain” is defined as those attack vectors and attack stages that characterize a cyber threat. Juniper ATP Appliance detects and analyzes all extended links in the cyber threat Kill Chain — providing a distinctive cyber security solution that offers comprehensive and actionable visibility into all relevant network traffic and data along the kill chain and its associated attack vectors.
Exploits |
XP |
Activity that could expose users to malicious objects. |
Downloads |
DL |
Download of an object identified as malicious. |
User Uploads |
UP |
A data upload performed at an endpoint. |
Executions |
EX |
Execution of malicious code on the enterprise endpoint [identified through Carbon Black Response API integration] |
Infections |
IN |
Identified evidence of infection (CnC, IVP verification). |
Lateral Spread |
LS |
Detected spread across enterprise hosts within the east-west traffic. |
Phishing |
PHS |
Email with malicious URL (often correlated with Download(s)) |
Juniper ATP Appliance Kill Chain Detection Designations
XP + UP + DL + EX + IN + LS + PHS

Refer also to Incidents Tab Kill Chain, Correlation & Lateral Spreads and the section Kill Chain Breakdown for information about the interactive Kill Chain, Email Correlation and Lateral Spread displays.
Juniper ATP Appliance’s one-of-a-kind hierarchical reasoning and machine learning engines employ virtualized as well as emulated object analysis, combined with Juniper ATP Appliance’s distributed big data correlation engines, to accurately and dynamically detect advanced malware threats in network traffic and generate actionable intelligence about the threats that matter to your particular organization.
Juniper ATP Appliance’s multi-OS detection engines (Windows and Mac OS X) provide malware detonation as well as detailed, context-aware coverage of all attack vectors with deep analysis of all attack stage activities along the Threat Kill Chain. Immediate verification and auto-mitigation is also provided via Palo Alto Networks (PAN), Juniper SRX Firewall, Cisco ASA, Check Point firewalls, Fortinet firewalls and BlueCoat Proxy SG integrations along the network path, in addition to Carbon Black Response integration at the network endpoint. Juniper ATP Appliance’s on-demand endpoint IVP (Infection Verification Package) brings Juniper ATP Appliance’s advanced threat protection full circle to secure your enterprise’s entire infrastructure.
Juniper ATP Appliance’s distributed architecture is designed to break the Threat Kill Chain while adapting to literally any enterprise network architecture. Juniper ATP Appliance separates continuous inspection of traffic data and network objects from threat detection and analytics, using Juniper ATP Appliance’s unique object-based Traffic Collector technology. The distributed Juniper ATP Appliance system is a significant advantage over existing analysis and detonation technologies because it allows for the deployment of various traffic Collectors throughout the network, in a substantially cost-effective manner, incurring less latency during dynamic behavioral-analysis cycles, and greater visibility and coverage of the breadth of an enterprise network and its kill chain vulnerabilities.
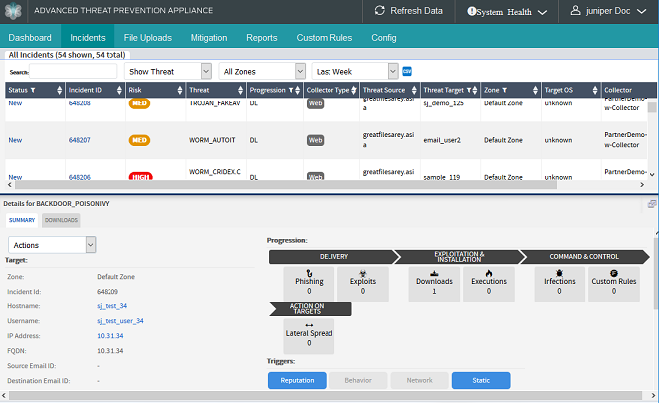
Juniper ATP Appliance threat intelligence pinpoints and highlights:
The threat aspects that constitute kill chain progression
The attack location in the “kill chain”
The in-context metrics about how close the malware is to achieving an intended kill and posting kill exposure
Context-Aware Detection and Juniper ATP Appliance Intel
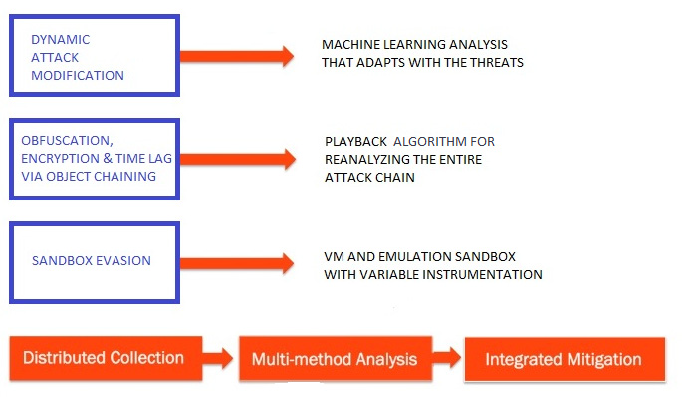
Recently there has been a marked increase in advanced payload delivery mechanisms that use advanced evasion techniques. These threats are stealthily designed to bypass network security solutions by changing dynamically during an on-going attack and becoming stackable through parallel executions on multiple protocol layers, making it difficult for traditional security solutions to detect them. Also, the delivery of a payload is mostly distributed across multiple platforms such as Mobile or Web, or over an extended period of time.
Evasive attacks are successful due to the lack of contextual awareness and full visibility by current security solutions. The challenge in detecting advanced evasive threats at an early stage is tied to the fact the security solutions and analysts have to find numerous low-level signals and correlate the appropriate pieces of various threats against each other. This breeds complexity since the data is a combination of structured and unstructured signals combined with various levels of meta-data from different network segments. Considering the scale and complexity of most enterprise infrastructures, the task of validating, prioritizing and mitigating relevant threats requires Juniper ATP Appliance’s distributed architecture coverage and context-aware, object-focused intelligence.
The prerequisite to detecting advanced threats is establishing full visibility by leveraging a distributed architecture combined with “long” data analysis combined with in-depth assessment of the threat’s impact on the full ecosystem. Understanding how various aspects of a threat relate to each other is required for stopping determined adversaries.
The Juniper ATP Appliance product suite provides a unique solution that combines intelligence technology from the Web/Email Traffic Collectors and detonation engines to provide a defense-in-depth architecture. This end to end correlation protects the entire enterprise network and performs as a protective layer against attacks that employ advanced malware.
When operating in concert, the context-aware Juniper ATP Appliance product suite complements the effectiveness of other layers of the enterprise architecture while supporting existing security infrastructure. The following figure shows a distributed enterprise deployment with appliances in each of the available configurations, and with Juniper ATP Appliance Central Manager deployed for centralized collection and detection management.
Juniper ATP Appliance Multi-Platform Product Suite
Juniper ATP Appliance’s multi-OS product solutions are designed to monitor and defend the entire enterprise against malicious attacks from all threat vectors. Many threats use different channels and incremental stages to bypass traditional protections. An attack might enter the network when a user clicks a URL, causing an array of drive-by downloads that assault the browser while searching for vulnerabilities. The Juniper ATP Appliance product suite components works together to detect and stop such blended threats.
Product Component |
Deployment Location(s) |
Model Options |
Juniper ATP Appliance Core Engine (Windows) |
Locate anywhere in the enterprise network, in a clustered deployment, and/or in remote branch office(s) |
Juniper ATP700 Appliance |
Juniper ATP Appliance Virtual or Secondary Core Engine (Windows) |
Locate anywhere in the enterprise network and/or in remote branch office(s); Connected logically to the Primary Core. |
Juniper ATP Appliance, OVA VM, vCore for AWS, or Software-only |
Juniper ATP Appliance Central Manager |
Locate anywhere in the enterprise network as part of the [Primary] Core; Manages traffic collector objects and multi-platform Detonation engine detection, analysis and reporting (Web UI). |
Packaged with the Core Engine [Primary Core in the case of clustered deployments] |
Juniper ATP Appliance Web Traffic Collector |
Locate at any network location; most typical: Internet (or network) egress. If a web proxy is present, refer to optional deployment scenarios in the next chapter. |
Juniper ATP Appliance Web Collector Appliance, Virtual, OVA or Software-only |
Juniper ATP Appliance Email Traffic Collector |
Locate between the anti-spam gateway and the network’s internal mail server(s), such as MS-Exchange. The Email Collector does not parse email messages out of a SPAN port; deployment requires an account to login to a special email account (Journaled or BCC) to get email for analysis using POP or IMAP. |
A component of the Juniper ATP Appliance Core or Allin- One System |
Juniper ATP Appliance Secondary Core (Mac OSX Detection) |
Locate anywhere in the enterprise network and/or in remote branch office(s); Connected logically to the Primary Core. |
Juniper ATP Appliance software for Mac Mini Devices |
Juniper ATP Appliance All-In- One |
Locate anywhere in the enterprise network. Logically connect a Mac Mini Secondary Core for Mac OSX Detection coverage. (Central Manager | Core (Windows) | Collector) |
Juniper ATP700 Appliance |
Global Security Services (GSS) |
Configured for any of the Juniper ATP Appliance CM/ Core appliances or All-in-One appliances. |
Service |
clustered or virtual |
Software and Cloud-based deployment: Virtual Collector, Virtual Core for AWS, and vCore (OVA) |
Many options; refer to respective Juniper ATP Appliance Quick Start Guide |
- Juniper ATP Appliance Core and Secondary Core Detonation Engines
- Quick Links to More Juniper ATP Appliance Core Information
Juniper ATP Appliance Core and Secondary Core Detonation Engines
Juniper ATP Appliance’s Core integrates Windows platform malware analysis with Mac OS X monitoring and malware detection.
The Juniper ATP Appliance Windows detonation engine resides on the Core (regardless of whether you are implementing an All-in-One deployment, or a clustered or virtual or physical Core/CM deployment in the enterprise network or in the Amazon cloud).
The Juniper ATP Appliance MAC OS X detonation chamber (Secondary Core) runs on a Mac Mini (not supplied by Juniper) and is for detecting both known and unknown threats in web and email traffic.
The Juniper ATP Appliance Core Central Manager coordinates all detection and intelligence data in its Web UI displays and threat views, in concert with Juniper ATP Appliance’s GSS, Global Security Services.
Juniper ATP Appliance detonation engines fully execute suspicious traffic objects: code, attachments, files, and URLs. Juniper ATP Appliance Collector automation moves suspicious traffic through a series of known-rules static, reputation, network and behavioral reasoning sequences with machine learning adaptation as the traffic is moved into and through Juniper ATP Appliance’s instrumented execution engines.
In the Core Windows and Mac OS X, suspected malware is executed in the virtualization environment and fully examined. In Juniper ATP Appliance’s Core Windows and Mac OS X environment, real-world malware is allowed to trigger zero-day assaults, escalations, and other next-generation functions so that Juniper ATP Appliance can examine and assess it’s full threat potential.
Following detonation in the virtualization chamber, the malware is next run through its paces using emulation. For example, the internal Core Windows and Mac OS X of the Juniper ATP Appliance Web appliance emulates the browser (client) side of suspicious web transactions between actual network users and web servers to determine if the web server is attempting to infect the browser. Suspicious code is replayed into and analyzed inside the emulation engine, enabling it to discover polymorphic or zero-day malware that may not have been seen before. Real threats to the enterprise are identified and stopped in their tracks by Juniper ATP Appliance’s malware protection system engines, and analyses are available as detailed reports in the Central Manager Dashboard, Incidents Tab and Mitigation pages for malware remediation and forensics teams.
Juniper ATP Appliance detonation engines accumulate detailed information about the examined threat: malware analysis results provide the IP addresses associated with the malware, the network protocols employed, specific ports that are targeted, and intelligence about how attackers cloak, communicate, and distribute payloads. Using this data, Juniper ATP Appliance captures callbacks and all data exchange between the malware and its remote command and control (CnC) center. With detailed context-driven malware analyses and threat metric reporting, administrators can select real time mitigation options available from the Central Manager, including Juniper ATP Appliance’s integrated PAN OS, SRX, Cisco ASA, Check Point, Fortinet and BlueCoat ProxySG mitigations, endpoint infection verification (Juniper ATP Appliance IVP), and the Carbon Black Response Juniper ATP Appliance-partner response system for real time endpoint mitigations inside, as well as outside, the enterprise network perimeter.
Quick Links to More Juniper ATP Appliance Core Information
Refer to the Juniper ATP Appliance Quick Start Guides for your products for information about initial installation and configuration of Juniper ATP Appliance Cores:
Juniper ATP Appliance All-in-One System Quick Start Guide
Juniper ATP Appliance Core/CM Quick Start Guide
Juniper ATP Appliance Virtual Core for AWS Quick Start Guide
Juniper ATP Appliance Traffic Collectors
The Juniper ATP Appliance Traffic Collector appliance scans and analyzes web objects and emails to identify malicious threats. Web Collectors inspect network callbacks and perform object collection, including user session data and link tracebacks. Email Collectors perform email attachment collection and email metadata inspection.
Juniper ATP Appliance Collectors can be deployed as a physical appliance, as a software-only ISO, or as a VM OVA. Collectors connect to the network switch SPAN/TAP port.
For multi-tenancy MSSPs, Juniper ATP Appliance Traffic Collectors can be deployed for tenant specific MSSP sites. Refer to Multi-Tenancy Web Collector Zones: Managed Security Service Provider (MSSP) Support for more information.
A portable small form factor Traffic Collector OSI for the Mac Mini is also available.
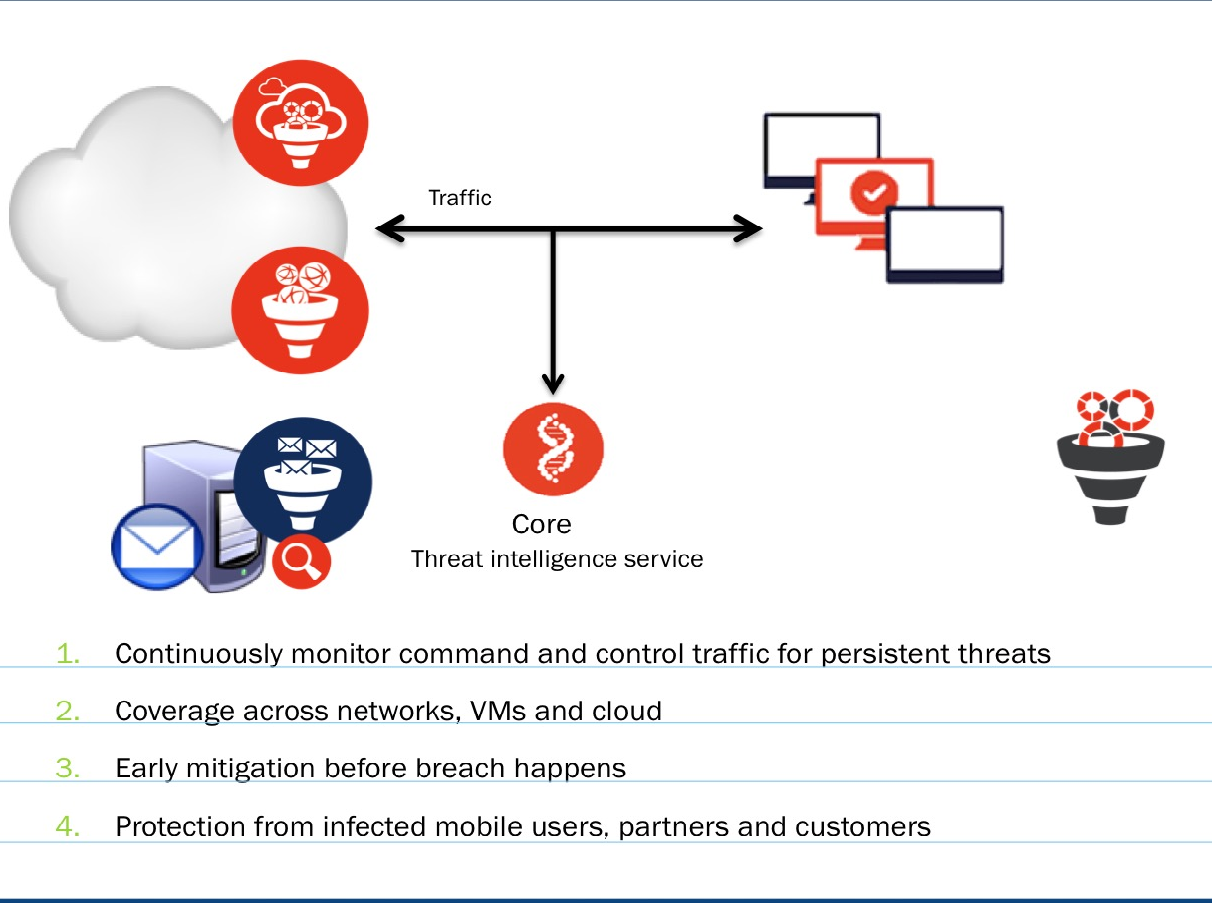
Multi-Tenancy Web Collector Zones: Managed Security Service Provider (MSSP) Support
Juniper ATP Appliance integrates Traffic Collector deployments at tenant sites. Each tenant-configured Collector is connected to the Juniper ATP Appliance Core Cluster hosted at the MSSP site. All management of incidents is performed by the MSSP; tenants do not have access to the Core cluster.
A configured Zone is defined at the Juniper ATP Appliance Central Manager Web UI to identify and correlate incidents and events per tenant. The MSSP defines a Zone per tenant and groups all Collectors associated with a tenant to a tenant-specific Zone, which is then added to the Juniper ATP Appliance CM Web UI Zones configuration page. Thereafter, all event correlation progressions track events per originating Zone, and correlate events within the same Zone. In this way, the multi-tenant MSSP manages incidents per Zone/Tenant using the Juniper ATP Appliance Central Manager.
Traffic Collector Performance, Confidence and Diagnostics Displays
Traffic Collector performance metrics are provided in the new Central Manager Web UI Collector Dashboards (Web and Email).
Top-level health indicator summaries are color coded to indicate total Collector health. For example:
The indicator for an Offline Collector is RED.
The indicator for a Degraded Collector is YELLOW.
When all elements are nominal, the indicator is GREEN.
Clicking on a health-indicator on a Collector Dashboard page opens the System Dashboard. The System Health page summarizes all system alerts.
No user configuration or action is required.
Web UI Cyber Kill Chain Progression Mappings
The Log Event Extended Format (LEEF) is a customized event format for IBM® Security QRadar®. Juniper ATP Appliance supports the sending of SIEM threat alerts for malware events in LEEF format for QRadar integration.
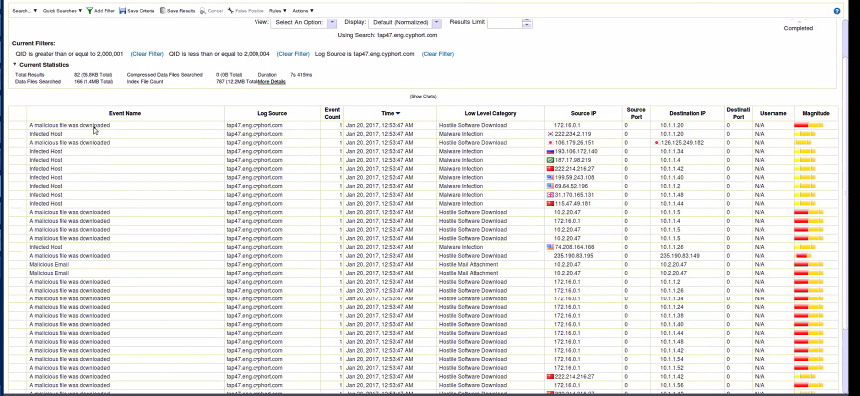
Installation of the DSM-Juniper ATP Appliance extension plugin on the QRadar server is required.
For configuration information, refer to Configuring SIEM Settings and the CEF, LEEF & Syslog Support for SIEM User's Guide.
Integrated Network | Endpoint Mitigation
Object-based end-to-end malware defense is performed in two parts: detection and mitigation. The blocking of web-based threats requires that the Juniper ATP Appliance Core be integrated during configuration with the network IPS/Next Gen Firewall, Proxy or Web Gateway. In addition endpoint protection is secured with Carbon Black Response and Crowdstrike Endpoint integrations as well as the Juniper ATP Appliance IVP, Infection Verification Package. The Juniper ATP Appliance Threat View on the Central Manager Web UI Dashboard, Incidents and Mitigation pages enable real time incident response. And malicious CnC callbacks are also actively detected and blocked on the outbound with these integrated systems in place.
Juniper ATP Appliance uses its in-depth threat intelligence to detail and prioritize defensive actions using an enterprise’s existing security infrastructure: integrated auto-mitigation with existing FW, SWG and IPS. In this way, Juniper ATP Appliance can push malicious content per host IP address to existing blocking rules in Palo Alto Networks firewalls, Cisco ASA, Check Point, Fortinet or Juniper SRX firewall equipment, for example, or push URLs associated with detected threats to the PAN firewall or a BlueCoat ProxySG.
Juniper ATP Appliance Endpoint Mitigation Options:
Juniper ATP Appliance Global Security Services (GSS)
Integration with existing security and blocking infrastructure, including automatic and proactive mitigation options and URL blocking
False Positive (FP) and False Negative (FN) Reporting via the Central Manager Web UI.
SIEM integration and CEF Logging Support
Juniper ATP Appliance blocking and enforcement support with selected network and endpoint vendors/ partners such as Carbon Black Response and Crowdstrike.
Juniper ATP Appliance Infection Verification Package (IVP)
Crowdstrike Endpoint Integration
Juniper ATP Appliance’s “CrowdStrike Endpoint Integration” supplements Juniper ATP Appliance’s established Carbon Black Response integration for endpoint threat detections and mitigation. Specifically, Crowdstrike endpoint integration determines whether a binary that Juniper ATP Appliance detected over an enterprise network is executed at an endpoint. Juniper ATP Appliance incidents are then marked “EX” to indicate a higher threat risk in order to help an incident response team to assess their response.
To configure CrowdStrike integration at the Juniper ATP Appliance Central Manager Web UI, users need to enter:
CrowdStrike Falcon API server hostname
CrowdStrike Falcon API user
CrowdStrike Falcon API key
At the Juniper ATP Appliance Central Manager Web UI Incidents page, an exploit (EX) flag is displayed if an endpoint has executed detected malware. The Web UI self-updates to display information from the endpoint agent when a certain file is executed on an endpoint host.
AD integration must be enabled as a prerequisite for Crowdstrike Endpoint Integration.
Refer to Configuring Endpoint Integration: Crowdstrike and Carbon Black Response for configuration information.
SMB Lateral Detection
Juniper provides support for monitoring the SMB network file sharing protocol version 2.1. This allows for the extraction of file transmissions between clients, or between clients and servers, similarly to the way Juniper ATP Appliance currently monitors HTTP traffic. Juniper ATP Appliance’s support of lateral “east-west” SMB traffic monitoring and detection, in addition to the monitoring of “north-south” ingress and egress traffic, helps identify malware as it spreads to other hosts within an organization from an infected endpoint. Because HTTP is rarely used to communicate between endpoints within an organization, SMB is a significant vector for malware transmission and infection proliferation within an enterprise.
Support includes Windows 7 Windows Server 2008 R2 Version 2.1 and Windows 7 Windows Server 2008 R2 Samba Server 2.1. This means that either the client or the server must be running Windows 7 or Windows Server 2008 R2, and on the other end, either the client or the server must be running Windows 7/ Windows Server 2008 R2 or later. On Linux platforms, for SMB lateral detections, run Samba Server Version 2.1 on one end, and Windows 7/Windows Server 2008 R2 on the other end.
An Advanced License Key must be installed to activate SMB support.
To view SMB detections from the Central Manager Web UI, refer to Viewing SMB Lateral Detections in the Incidents Tab Downloads summary tables.
Juniper ATP Appliance also supports SSH Honeypot lateral detections; refer to the next section, as well as Lateral Detection Enhancements: SSH Honeypot for more information.
Lateral Detection Enhancements: SSH Honeypot
The Juniper ATP Appliance Central Manager Web UI Incidents tab includes results for its SSH Honeypot feature. A honeypot deployed within a customer enterprise network can be used to detect network activity generated by malware attempting to infect or attack other machines in a local area network. Attempted SSH login honeypots are used to supplement detection of lateral spread. A honeypot can be deployed on a customer Traffic Collector from which event information is sent to the Juniper ATP Appliance Core for processing. Customers can place a honeypot on any local network they desire.
A malicious actor attempting to perform brute force SSH entry, or execute targeted SSH access to a “root” account, will also be detected by the Juniper ATP Appliance SSH Honeypot feature.
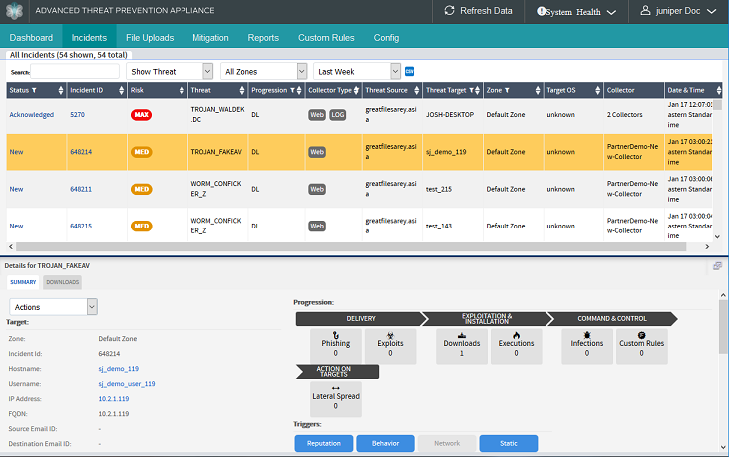
Results of SSH Honeypot detections are displayed on the Central Manager Web UI Incidents page, and included in generated Reports. Data sent to the Juniper ATP Appliance GSS for honeypot detection events include “Threat Target” and a detailing of all attempted “SSH sessions” (including username and password) with timestamps.
A Juniper ATP Appliance Advanced license is required for SSH Honeypot Lateral Detection configurations. The honeypot interface always enumerates as eth3.
For more information:
Refer to the Juniper ATP Appliance CLI Command Reference for more information about configuring SSH Honeypot.
Refer to SSH Honeypot Requirements.
Refer to Viewing SSH Honeypot Lateral Spread Incidents for information about viewing the new lateral detection incidents and details.
Refer to the Juniper ATP Appliance Traffic Collector Quick Start Guide for information about using the eth3 port for all outbound Collector traffic.
Incidents Tab Kill Chain, Correlation & Lateral Spreads
An interactive Kill Chain on the Incidents>Details Summary page visually pinpoints the traversal of malware in the enterprise network, and links this information with related Kill Chain stages and Incident data pages.
The Kill Chain Progression categories include:
Exploits | Downloads | Executions | Infections | Lateral Spread | Phishing | Custom Rules
Juniper ATP Appliance’s interactive graphical Kill Chain includes Lateral Spread displays on the Incidents tab Summary Details page.
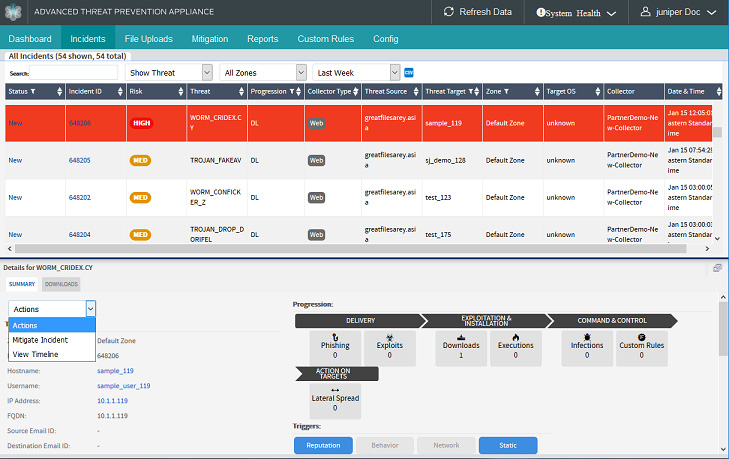
The Kill Chain Progression graph shows dated occurrence mapping of LS (Lateral Spread), IN (infection), DL (downloads), XP (Exploits), Lateral Spread (LS), Phishing (PHS), and so on. The Kill Chain icons help administrators, at a glance, determine quickly what event(s) took place and at which stage in the Kill Chain at which time.
Clicking on a Kill Chain Progression button opens its corresponding page of detailed information; for example, Clicking the Infections button opens the Infections Details page.
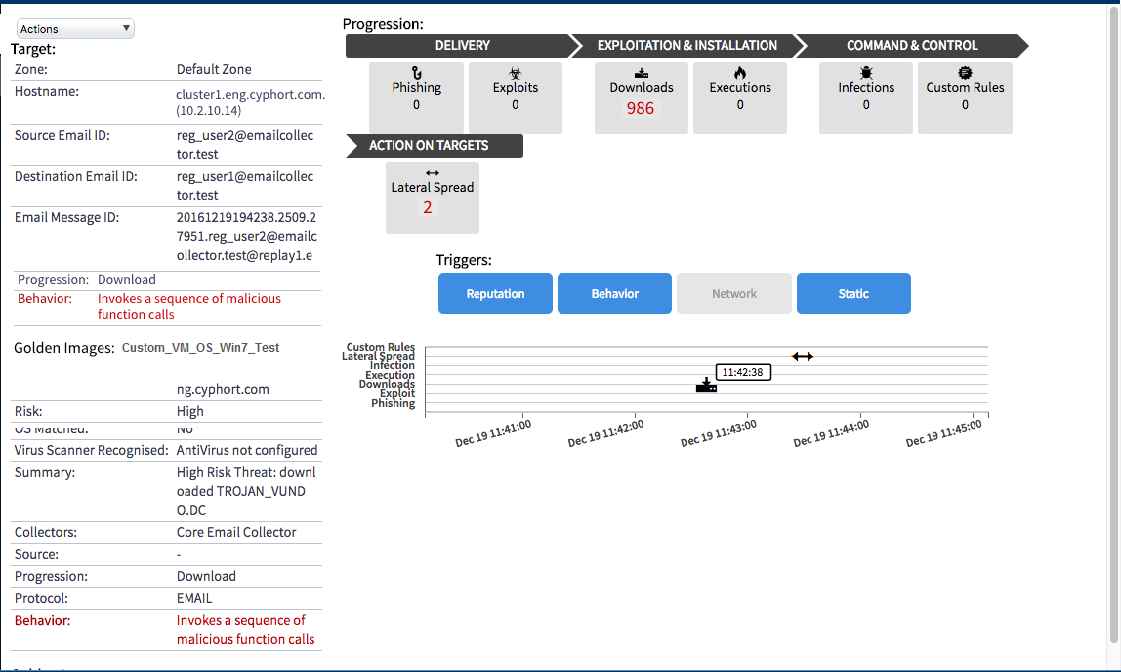
The detection Triggers for this Kill Chain incident are displayed directly above the Progression graph. Those triggers displayed in blue were actively triggered during monitoring and analysis. The Triggers include: Reputation | Behavior | Network | Static.
When the Kill Chain Progression display shows Lateral Spread activity, as in the example below, you can click the interactive Lateral Spread button icon in the Kill Chain to open the Lateral Spread Details page:
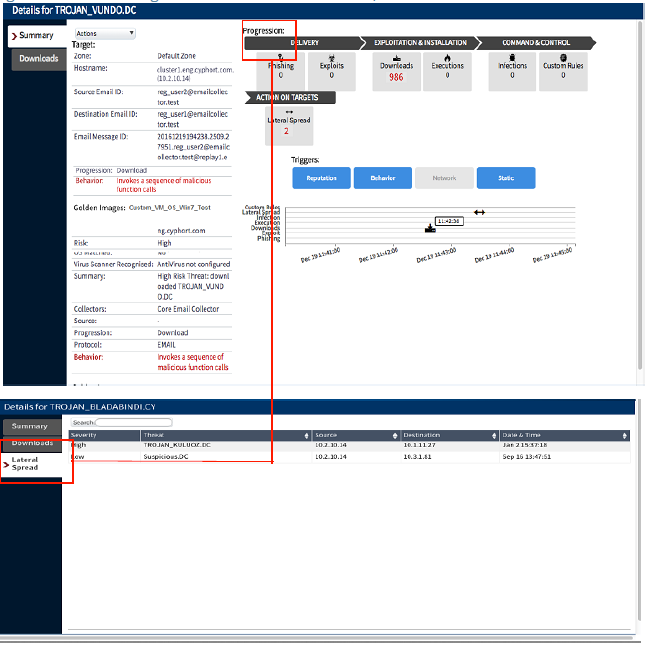
Downloads and Lateral Spread events can look similar on the Juniper ATP Appliance Web UI Incidents page. The difference is specific to whether the host IP is the malware source or destination. If the malware source is a lateral spread event that targets a recipient, in other words, the Juniper ATP Appliance host receiving the malware, then it is considered a download.
No configuration is required. Refer to Kill Chain Breakdown for more information.
With endpoint identity integration, the Lateral Spread graph displays the endpoint hostname as the node name if it’s available; otherwise, the endpoint IP address is supplied.
Kill Chain Stages
Juniper ATP Appliance’s Central Manager Web UI Incidents page includes kill chain progression mapping showing incident alignment with the Gartner kill chain stages.
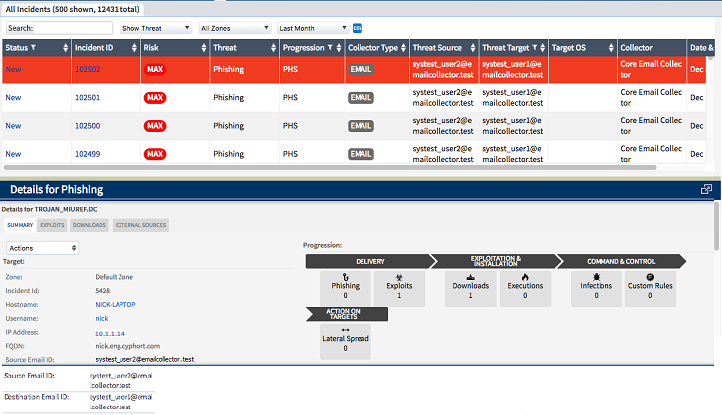
The different kill chain stages are:
Reconnaissance,
Weaponization
Delivery [Juniper ATP Appliance’s progressions start here with the Kill Chain Delivery stage.]
Exploitation
Installation
Command and Control
Action on Targets
Juniper ATP Appliance’s progressions start with the Delivery stage. The Juniper ATP Appliance Progressions are mapped to the Cyber Kill Chain Stages as shown below:
Juniper ATP Appliance Progression Mappings Per Kill Chain Stages
Delivery > |
Phishing, Exploits, Downloads |
Exploitation and Installation > |
Execution |
Command and Control > |
Infections, Custom Rules |
Action on Targets > |
Lateral Spread |
Refer to Understanding Threats and Incidents for more information.
YARA Rules and Lateral Detection
Remote Administration Tools (RATs) can be detected using YARA rules. By adding the ability to push YARA rules to Juniper ATP Appliance devices, Juniper ATP Appliance can detect the lateral spread of Remote Administration Tools (RATs) within a network.
Each Juniper ATP Appliance YARA rule includes the following additional information:
Rule Name
Rule Description
Severity (between 0 and 1)
File Types for which the rule is to be applied
Juniper ATP Appliance’s analysis engines test new downloads against each YARA rule, and the YARA results are used by the machine learning components to help generate a final severity score and malware name.
YARA rules are always installed and applied against downloads.
The Juniper ATP Appliance YARA engine uses YARA Version 3 (backwards compatible with version 2). Details of matched YARA rules are shown in the Downloads tab of the Incidents page.
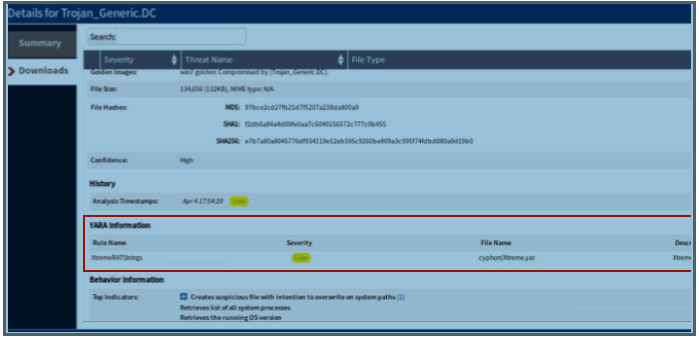
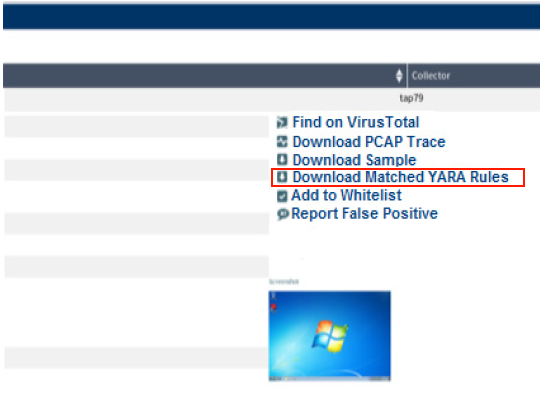
All matched YARA rules can be downloaded from the Incidents page:
An Advanced license is required to enable SMB, but YARA rules are always installed and used regardless of SMB status.
Juniper ATP Appliance HTTP API
The Juniper ATP Appliance Central Manager supports an HTTP API for accessing all threat and system processing data as well as device and software configuration. All functionality available from the Central Manager Web UI is also accessible via the HTTP API.
As part of all API requests, JSON is returned in all responses from the API, including errors.
The Juniper ATP Appliance Smart Core Platform is specifically designed to work seamlessly with existing security infrastructure, providing rules and mitigation options that contribute to full contextual awareness of each enterprise environment, including its enforcement points. This integration helps to prioritize threats and reduce threat response time (blocking and situation-aware mitigation rules) from hours or days to minutes.
Juniper ATP Appliance’s built-in API pushes mitigation rules to existing infrastructure, leveraging existing enforcement solutions via firewalls, IPS/IDS (for blocking), or AV. And infection validation using IVP and Carbon Black Response allows the Juniper ATP Appliance platform to become a deeper part of the infrastructure mesh rather than just another security patch point solution.
STIX API Integration
Structured Threat Information Expression (STIX™) is a language used to qualify cyber threat data and intel so it can be exchanged, stored, and analyzed. Juniper ATP Appliance includes an API that allows users to query Juniper ATP Appliance to obtain Indicators of Compromise (IOC) in a standard STIX format.
Refer to the Juniper ATP Appliance HTTP API Guide for details and usage information.
Juniper ATP Appliance Global Security Services (GSS)
Juniper ATP Appliance global security service (GSS) provides cloud services for Juniper ATP Appliance and its customers. Juniper ATP Appliance’s Global Security Service is a cloud-based subscription service that works in conjunction with the Juniper ATP Appliance Advanced Threat Defense Platform to provide enhanced threat detection and migration. The Juniper ATP Appliance Global Security Service continually updates all aspects of the Juniper ATP Appliance Advanced Persistent Threat Platform’s multi-method detection engine, providing new threat intelligence, machine learning models and static analysis signatures.
The GSS provides:
System monitoring and reporting services
Automatic software and security content updates and refreshes
Automatic report and alert generation
The Core checks for Core image upgrades every day at midnight. Checks also take place for new software and content updates (if enabled) every 30 minutes. To enable GSS updates, refer to Configuring GSS Settings.
Automatic updates are performed for:
Machine learning model updates
Ongoing threat intelligence
Static analysis updates
Machine Learning Model Updates
Juniper ATP Appliance uses machine learning analytics for analyzing malware behavior and to provide an analysis assessment. The Juniper ATP Appliance Labs team continuously trains the machine-learning engine with millions of new samples of malicious and non-malicious code. This allows Juniper ATP Appliance to increase the efficacy of detection while learning key characteristics of known good objects, allowing Juniper ATP Appliance to flag object behavior that does not conform to norms. As part of GSS, these updates are provided to customers’ Juniper ATP Appliance deployments.
- Static Analysis Signature Updates
- One-Way vs Two-Way GSS Service Options
- Quick Link to More Juniper ATP Appliance GSS Information
Static Analysis Signature Updates
Juniper ATP Appliance continuously adds new signatures for newly found malware across its customer base. These signatures are updated by GSS.
Threat Intelligence Updates
The Juniper ATP Appliance Labs team creates and aggregates threat intelligence from various sources including our crawler network, as well as public and private intelligence feeds. Updated threat intelligence is essential to understanding the detected threats in depth. GSS continually provides the most current threat intelligence to our customers.
Juniper provides automated refreshing of security content releases.
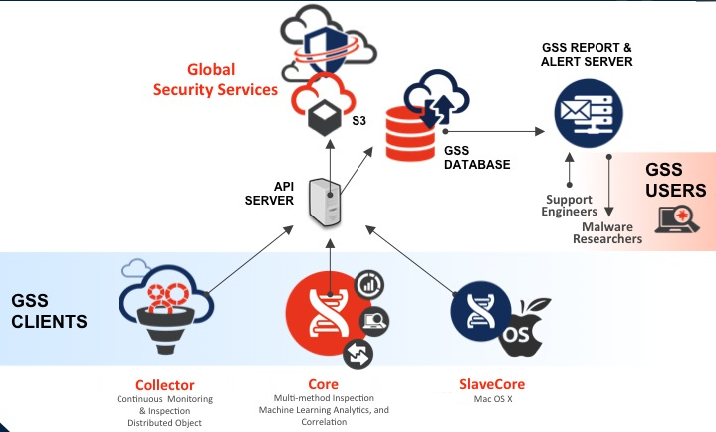
The Juniper ATP Appliance software/security content updates and health and monitoring functionality are incorporated into GSS. Future GSS cloud services will include distributed detonation and analysis handling and remote debugging.
One-Way vs Two-Way GSS Service Options
In order to share the benefits of real-time malware intelligence gathered by local analysis engines around the world, Juniper ATP Appliance has built a global network to distribute auto-generated security intelligence reports about advanced malware worldwide, including any covert call-back channels. As Juniper ATP Appliance analyzes code and traffic for malicious objects, it creates a dynamic fingerprint of all confirmed malware. These malware fingerprints are shared in real-time with subscribers.
Real-time sharing of local malware intelligence is achieved when individual Juniper ATP Appliance Traffic devices connect and share their locally generated malware intelligence, ensuring that the entire Juniper ATP Appliance deployment has protections for the targeted threats designed to infiltrate the enterprise network. When the GSS collects and distributes threat information, it is shared as security content updates:
All threat data contained in security content is specific only to malware and malicious activities.
No customer specific data is transferred as part of security content sharing and automatic refreshes.
The data is transferred over encrypted protocol (HTTPS).
Juniper ATP Appliance GSS is offered in the following two optional ways:
Juniper ATP Appliance GSS two-way option
With this option, customers receive all of the benefits of Juniper ATP Appliance GSS and also contribute back to the service by automatically providing to GSS the metadata about new threats found in their environment. All threat data contained in metadata is specific only to malware and malicious activities. No customer specific data is transferred as part of security content updating.
Juniper ATP Appliance GSS one-way option
This option allows customers to benefit from GSS updates without contributing malware information back to the service.
Benefits of two-way sharing:
Leveraging of the Juniper ATP Appliance Labs threat intelligence to identify and stop threats early in their life cycle
Keep the machine learning models updated to identify yet unseen threats
Improve threat categorization and prioritization
Accelerate threat containment and remediation
Quick Link to More Juniper ATP Appliance GSS Information
Refer to the Configuring GSS Settings for configuration information.
See also Configuring System Settings.
Juniper ATP Appliance Dashboard Threat View
The Juniper ATP Appliance Central Manager Web UI Dashboard includes a “Threat View” panel on the Operations Dashboard page, shown below. The Threat View is designed to help users prioritize and focus on the most important attacks within the enterprise network. Implemented as a bubble view, or bubble diagram, the Threat View bubbles graphically represent those threats an admin needs to be most aware of.
Each bubble represents an individual host for which suspicious activity has been observed by Juniper ATP Appliance’s detection and analysis engines. The higher each bubble is displayed on the Y-axis, the more serious is the potential threat; the larger the bubble is in the display, the more correlated or more individual threats have been observed and are in play for that host. The color is another indicator of threat severity, with dark orange representing the greatest threat.
Available Dashboards:
Operations
Research
System
Collectors
Events Timeline
- Operations Dashboard
- Research Dashboard
- Traffic Collectors Dashboard
- Events Timeline Dashboard
- Email Detection Enhancements
- Email Threat Mitigation: Gmail and Office 365 Quarantine Options
- Email URL Reputation Detection
Operations Dashboard
The Threat View filters out the noise on the network and displays the threats that matter the most to your enterprise for the time period selected in the dropdown menu above the graphs.
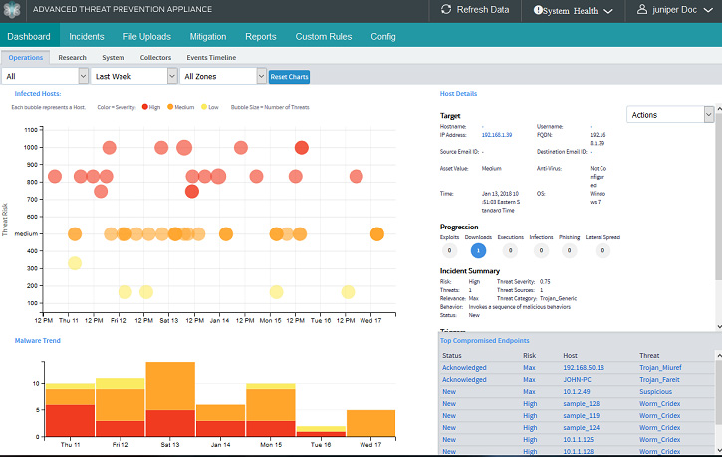
Threat value colors are translated as:
Critical, High (Red), Medium (Orange), Low (Yellow)
This threat coloring scheme is consistent throughout the Juniper ATP Appliance Central Manager Web UI.
The Infected Hosts area of the Dashboard displays bubble graphs of all host-specific incidents detected by the entire distributed system; the size of the bubbles represents Juniper ATP Appliance’s determination of the currently most severe or less severe infections.
Infected Hosts The layout of the Dashboard and its Threat Metric allows you to then drill down into the most critical threats for mitigation or to verify auto-mitigation (if configured).
Click the Reset Charts button to return to the original all-threats view.
To display a bubble’s Host Details, click a bubble. Details are immediately displayed to the right of the bubble graph Threat View.
When you double click a bubble in the Threat View, it opens the Incident tab of the Central Manager Web UI to provide a summary and details for the incidents associated with the selected host. In other words, the entire Dashboard UI follows your navigation focus, while detailing threat context and relevance.
For more usage information, refer to Using the Dashboard Views.
Research Dashboard
The Research Dashboard is another context-specific analyst’s tool available from the Dashboard tab.
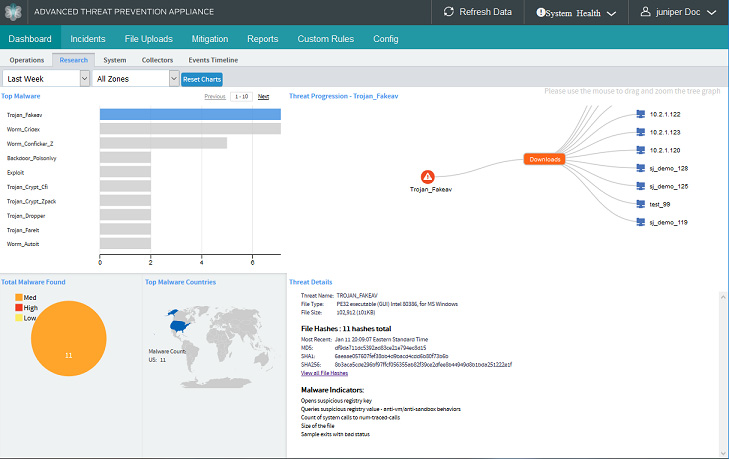
The longest line presentation in the Top Malware graph typically represents the greatest threat to the enterprise. When you click on that (or any) single line count in the Top Malware Threat View graph, the Threat Progression array to the right displays the hosts associated with that selected malware threat.
Drag the threat name in the Threat Progression View to adjust and fan out the array display.
Click a host IP Address in the array to display Host Details immediately below the array. The host circular bullet turns orange in the array when selected.
Select to move and reposition or enlarge/reduce the entire array in order to view all displayed IP addresses.
To recap: when you click on a malware name in the Top Malware graphical list, the Threat Progression View adjusts to display all hosts that have been targeted by that particular malware.
When you double click a Top Malware line in the Top Malware list, it opens the Incident tab of the Central Manager Web UI to provide a summary and details for the incidents associated with that malware. In other words, the entire Dashboard UI follows your navigation focus, while detailing threat context and relevance.
For more usage information, refer to Using the Dashboard Views.
The Research and Operations Dashboards integrate sets of north-south (ingress-egress) HTTP traffic detection incidents and events as well as lateral east-west incidents and events (detected within the enterprise via SMB monitoring). The Juniper ATP Appliance Central Manager Web UI Dashboards help administrators identify an infected endpoint as well as track the vector of a malicious object throughout the enterprise network from host to host. Moreover, lateral spread east-west malware events are carefully correlated with related web-based incidents (downloads, infections, phishing and exploits).
No configuration is required to access Operations and Research Dashboards, but an Advanced license key is required for mapping the SMB lateral monitoring data. For more information about using the redesigned Dashboards, refer to Using the Dashboard Views. For information about SMB lateral detection incidents, refer to the Incidents tab Viewing SMB Lateral Detections of this guide.
System Dashboard
The System Dashboard is also available from the Dashboard tab as well:
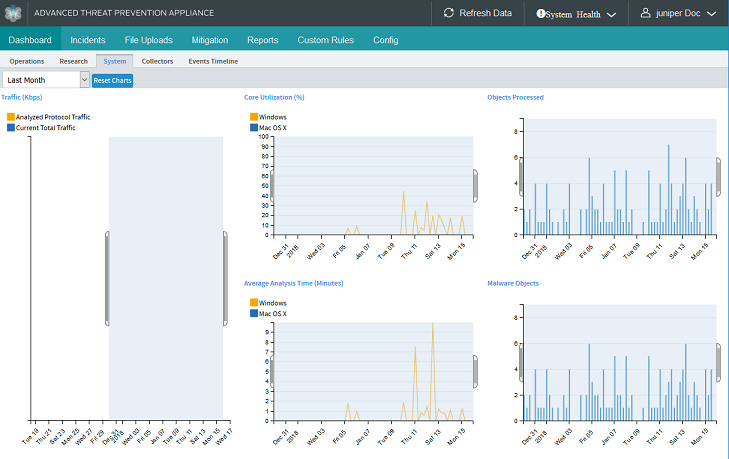
The System Dashboard includes metrics for the following:
Traffic (Mbps)
Total Traffic refers to traffic seen on the wire.
Analyzed Protocol Traffic refers to all traffic that is used for analysis.
Note:In previous releases, traffic was categorized as "Offered" and “Inspected.” Offered corresponds to the current Total Traffic metric. However inspected is not the same as Analyzed Protocol Traffic. Analyzed traffic includes all HTTP traffic, including the bytes that do not form objects. So there may be an expected increase in this metric than measured in the past.
Core Utilization (Windows and Mac OSX)
Objects Processed
Average Analysis Time (in Minutes) (Windows and Mac OSX)
Malware Objects
System Charts can be displayed for:
Last 24 Hours | Last Week | Last Month | Last 3 Months | Last Year
For more usage information, refer to Using the Dashboard Views.
Traffic Collectors Dashboard
The Collectors Dashboard is another dashboard set available from the Dashboard tab:
Select Web or Email Collector views to display graphical trends and details.
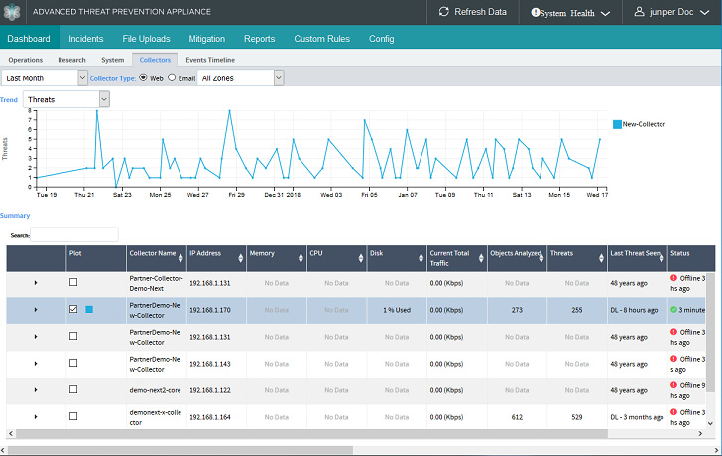
Up to 5 Web or Email Collectors can be selected for comparison graphical-trend plotting at the same time.
The Collectors Dashboard includes metrics for the following Trend displays (options are select from the Trend dropdown menu):
Current Total Traffic (Mbps)
CPU Usage
Memory Usage
Links Analyzed
Objects Analyzed
Threats
There is also a Collector Services section provided in the Details; scroll down the Collector Dashboard page to view Services. This section contains data about services that are down or affecting the health of the Collector. If all services are up and running as expected, then an "OK" line is printed:
Graphical data charts can be displayed for Last 24 Hours | Last Week | Last Month
Summary Column |
Description |
|---|---|
Plot |
Click to display [multiple] plots for comparisons in the graph above; colors are displayed for each selected graphical plot line |
Collector Name |
Name of the installed Traffic Collector |
IP Address |
IP Address of the Collector |
Memory |
Memory Usage statistics |
CPU |
CPU usage statistics |
Disk |
Disk Usage |
Current Total Traffic |
Total Traffic Scanned in Kbps or Mbps - all the traffic seen on the wire from various Collectors at any instant (not cumulative) |
Objects Analyzed |
Objects analyzed - cumulative |
Links Analyzed |
URL extraction and analysis |
Threats |
Malware Objects detected that account for all types of threat - exploit, malware download, infection - cumulative |
Last Seen |
Last malware incident detected and analyzed |
Status |
Last status check on the Collector (example: “83 seconds ago”) |
Enabled |
Green checkmark indicates that the Collector is currently enabled; a red X indicates that the Collector is disabled or offline. |
Refer to Interacting with Dashboard Views and Components and Navigating the CM Web UI for more information about Juniper ATP Appliance Dashboards and usage options.
Events Timeline Dashboard
The Events Timeline Dashboard is a recent addition to the product dashboard views available from the Dashboard tab:
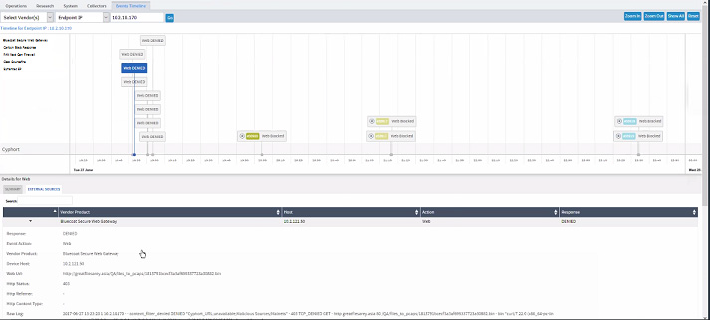
The Event Collector displays every event and action taken to protect a given endpoint or host along a timeline for each integrated vendor as well as for Juniper ATP Appliance detections and actions. You can expand a Timeline view to see how and when the end user enacted a malicious download.
The Events Timeline Dashboard includes event metrics for the following vendors (for a HOSTNAME | ENDPOINT IP | USERNAME | or EMAIL option that you select from the dropdown menu, specify in the corresponding field, then click GO to process for events display along the timeline view):
Bluecoat Secure Web Gateway
Carbon Black Response
PAN Next Gen Firewall
Symantec EP
McAfee ePO
Email Detection Enhancements
Juniper ATP Appliance-MTA-Receiver and Juniper ATP Appliance-MTA-Cloud
Juniper ATP Appliance offers several significant enhancements of email-borne malware detection and mitigation. Both Juniper ATP Appliance Cloud Email Deployment and On-Premise Juniper ATP Appliance- MTA-Receiver Email Deployment scenarios are supported in this release.
A Juniper ATP Appliance Advanced License is required for all Email Detection configurations.
On-Premise Juniper ATP Appliance-MTA-Receiver Deployments
Juniper ATP Appliance MTA Receiver deployments support receiving emails from different servers including Office 365, Gmail and MS Exchange. It also supports any other email servers/anti-spam gateways that support adding additional SMTP receivers to send emails to the Juniper ATP Appliance MTA Receiver (without adding any SMTP envelop headers to make the original email an attachment).
The admin must configure the supported servers to direct the email stream to the Juniper ATP Appliance MTA Receiver using the email address setup on the MTA Receiver (for example: CustomerX@MTA-IP or CustomerX@DomainName. When using a domain name, the MX records should be resolvable by the servers). In all cases, Juniper ATP Appliance’s On-Premise MTA Receiver extracts objects/URL links and submits them to the Juniper ATP Appliance Core for analysis.
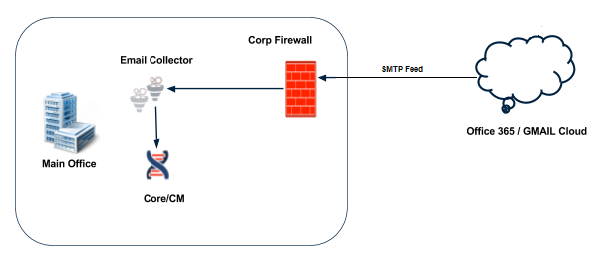
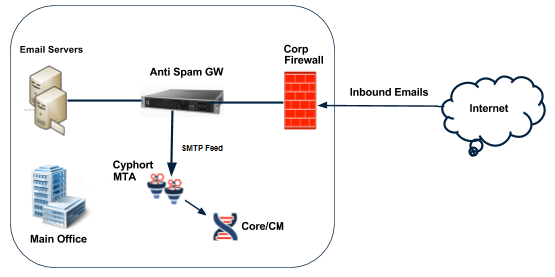
Again: this release supports 1) On Premise MTA for Cloud emails, and 2) On Premise MTA for Microsoft Exchange, etc. For On-Premise Email Deployments, the supported Mail Solutions are:
Office 365
Gmail
MS Exchange
Any mail solution that provides a journaling output using SMTP
An admin must configure their email solution to direct the journaling stream to the Juniper ATP Appliance MTA Collector deployed on-premise at the customer’s site (for example: CustomerX@Collector-IP or CustomerX@Collector-hostname). Juniper ATP Appliance’s On-Premise MTA Collector extracts objects/URL links for analysis from the email received and redirects the email stream to the Juniper ATP Appliance Core for processing.
Email Threat Mitigation: Gmail and Office 365 Quarantine Options
With Juniper ATP Appliance, you can quarantine emails that are detected as malicious by using Office 365 APIs or Gmail APIs,
Note that all content on the Juniper ATP Appliance email cloud is encrypted; email quarantine options require encryption of email attachments saved on the disk using a Mitigation Key provided by the user. The Juniper ATP Appliance Central Manager includes a form for user-input of the required mitigation encryption key.
A Juniper ATP Appliance Advanced license is required for advanced Email Detection configurations.
For more information, refer to:
Configuring Email Mitigation Settings for information about setting the Gmail JSON Key file and generating new Azure Key Credentials.
Email URL Reputation Detection
Additionally, threat detection and mitigation is supported by the sending of malicious URLs to the Juniper ATP Appliance reputation server for analysis. When there is an URL link in an email, Juniper ATP Appliance submits it to the reputation server and performs a reputation lookup. In this way, Juniper ATP Appliance can proactively identify a URL as malicious or as a threat without waiting for an actual download and exploit to happen. On the Juniper ATP Appliance Central Manager Web UI Incidents page, suspicious or malicious URLs are represented by the label “Malicious URL detected by Juniper ATP Appliance ATA.”
URL Reputation Results are categorized as follows:
Malware: The URL is known to host malicious payloads.
Benign: The URL is known to be clean or the URL is not known.
No configuration is required. Refer to Proactive Email URL Reputation Inspections for more information.
Threat Metric Prioritization Mapping
Because “malware severity” on its own does not always reveal deep context and actionable threat relevance, ATP Appliance provides “threat metrics” that combine threat severity with other relevance factors to help prioritize and identify whether the threat poses a risk specific to a given enterprise environment. These factors include:
Asset Value— A customizable value that allows admins to prioritize the value of assets in their enterprise, based on IP address ranges, so that malware detected in high asset network segments can be immediately recognized and remediated.
OS Relevance — A threat metric based on an understanding of whether the threat contains the potential to compromise the target endpoint’s Operating System. For example, a significant threat may be reported in the Dashboard Threat View with a low severity because it is a Windows virus that was downloaded to a Mac OSX host—an OS Mismatch will cause an adjustment in the severity rating.
Virus Scanner Relevance — Determines whether the configured virus scanner recognizes the identified threat at the time of a download.
Execution Relevance — Bi-directional Carbon Black Response integration helps identify whether a malicious object actually executed on the target endpoint.
Progression — A threat metric that displays which triggers of the kill chain have been identified: XP+UP+DL+EX+IN
New Severity Range— In the previous release, the severity range was a positive integer value between 1-4. The range is a value (including decimals) between 0 and 1.
All factors are used to determine the final threat metric. Threat values are translated as Critical, High (Red), Medium (Orange), Low (Yellow), and Clean (Green) in the Juniper ATP Appliance Central Manager Web UI.
Incident vs Event Context Detailing and Reporting
Juniper ATP Appliance transitioned from an “events” based model to an “incidents” model early on in its technology development process, meaning that in order to more closely represent attack processes, Juniper ATP Appliance now combines multiple related events into a single incident.
The Juniper ATP Appliance defines “incidents” as a group of events that share the same endpoint. In other words, an incident contains events that the Juniper ATP Appliance threat detection system has determined are likely part of the same attack. Currently, the grouping of events into an incident is primarily a measure of time; the events occurred at or from the same endpoint within a 5-minute timespan.
Previously, Juniper ATP Appliance represented each download as an individual threat line item, but in this release and going forward, Juniper ATP Appliance now integrates related items into a single incident to realistically represent related events. This change provides greater context when viewing some attacks that may generate a large number of downloads, CnC activities or events.
False Negative | False Positive Reporting on the Incidents Tab
Juniper ATP Appliance Central Manager Web UI reporting of False Positive (FP) and False Negative (FN) detections is available from the Incidents Tab. This feature facilitates customer reporting of FPs and FNs from the product Web UI, and automatically attaches all related details about the event required for analysis by the Juniper ATP Appliance Technical Support team.
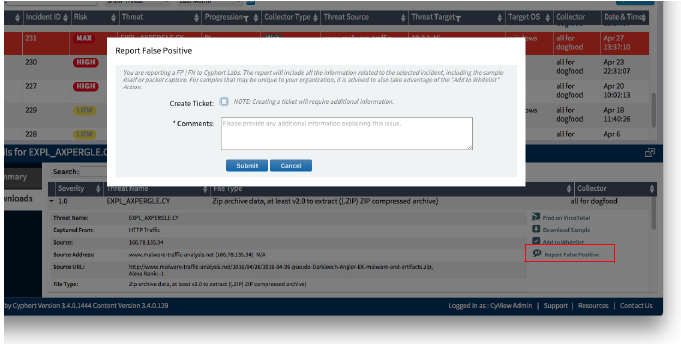
The option to Report False Positive is available from the Incidents page. For incidents that are benign, the reporting link option displays Report False Negative.
No configuration is required. For more information, refer to Reporting False Positive or False Negative Incidents.
Auto-Mitigation with Existing Security Infrastructure
Threat intelligence is translated into prevention in real time using your enterprise’s existing security infrastructure. With Auto-Mitigation, an admin can configure the following integrated auto-mitigations as part of its malware analysis response:
Palo Alto PAN Firewall Integration — IP addresses of hosts determined to contain malicious objects can be delivered to Palo Alto Networks appliances, where the IP can be blocked. Blocking based on URLs to Palo Alto Networks firewalls is also available. URL-based blocking allows more precise blocking control.
Juniper SRX Firewall Integration — IP addresses of hosts determined to be infected can be delivered to Juniper SRX appliances, where the IP can be blocked.
Cisco ASA Firewall Integration — In addition to Juniper ATP Appliance’s established firewall integration support, Cisco ASA Firewall support is available. Now, enterprises using ASA Firewalls, are able to push IP addresses to the Cisco ASA Firewall platform for malware blocking. Juniper ATP Appliance uses a REST interface to communicate to the ASA Firewall.
Fortinet Firewall Integration — Fortinet Firewall and management platform is also supported. This integration includes submission of blocking information using Fortinet’s Management APIs, including IP addresses and URLs as appropriate.
Crowdstrike Integration — Juniper ATP Appliance’s “CrowdStrike Endpoint Integration” supplements Juniper ATP Appliance’s established Carbon Black Response integration for endpoint threat detections and mitigation.
Check Point Firewall Integration — Check Point Firewall integration is also available. The Juniper ATP Appliance communicates with configured Check Point appliances whenever a Juniper ATP Appliance administrator chooses to mitigate a particular threat or remove a previously propagated mitigation. Communication takes place via the SSH interface through which Check Point users may also access the CLI of the Check Point device.
Blocking information is submitted using Check Point APIs. This release supports pushing malicious IP addresses to integrated Check Point appliances. Similar to Juniper ATP Appliance’s established PAN and Juniper integration support, an administrator identifies threats in the Firewall or Secure Web Gateway, and submits the selected objects to the configured Check Point Firewall from the Central Manager Web UI.
Check Point Firewall integration requires Check Point GAiA operating system release R76, R77, or later. Check Point IPSO and Secure Platform (SPLAT), which are predecessors of GAiA, are not supported.
BlueCoat ProxySG Integration — Malicious URLs associated with threats can be sent to BlueCoat’s ProxySG equipment so that users can take desired actions (including blocking).
Blocking does not need to be part of an auto-mitigation operation.
Integration Requirements
Requires Microsoft Exchange 2010+ for the Email Collector
Junos version 12.1-X47.x for Juniper Firewall
Palo Alto Firewall Version x for Palo Alto
- PAN Firewall Integration
- URL Blocking Support for Palo Alto Networks Firewall Integration
- Centralized Panorama Integration for PAN Firewall Devices
- SRX Series Firewall Integration
- Cisco ASA Firewall Integration
- Check Point Firewall
- BlueCoat ProxySG Integration
PAN Firewall Integration
Configuration of PAN integration for auto-mitigation is a two-step process;
First, configure Juniper ATP Appliance recognition on the vendor equipment.
Next, configure auto-mitigation from the Juniper ATP Appliance Central Manager (CM) Web UI Config tab.
See complete procedural information at Configuring Firewall Auto-Mitigation of this guide.
URL Blocking Support for Palo Alto Networks Firewall Integration
Integration with Palo Alto Networks (PAN) Firewalls uses IP addresses for malware blocking as well as provides blocking based on URLs to Palo Alto Networks firewalls. URL-based blocking is also supported and allows more precise blocking control. In addition, centralized PAN FW mitigation management is also supported via Juniper ATP Appliance and Palo Alto Network’s PANORAMA integration.
For configuration information, refer to:
Centralized Panorama Integration for PAN Firewall Devices
The Juniper ATP Appliance platform monitors and detects malicious IP addresses and the URLs that link to malware. In previous releases, Juniper ATP Appliance’s integration with Palo Alto Networks (PAN) firewalls allowed Juniper ATP Appliance to block malicious URLs and IPs by pushing those IP addresses and URLs to individual PAN FW devices. But because some enterprises utilize an array of PAN firewalls deployed in various locations, integration of each PAN FW with Juniper ATP Appliance could become cumbersome. Therefore, Juniper ATP Appliance offers integration with Palo Alto Network’s Panorama, a network security management device that controls the distributed network of PAN firewalls from a central location. Juniper ATP Appliance provides the flexibility to either configure integration with individual PAN-OS FWs as usual, or configure integration with a centralized Panorama device as part of Juniper ATP Appliance’s Firewall and Secure Gateway auto mitigation options.
Refer to Configuring a PANORAMA Device for Centralized PAN FW Mitigation Management.
SRX Series Firewall Integration
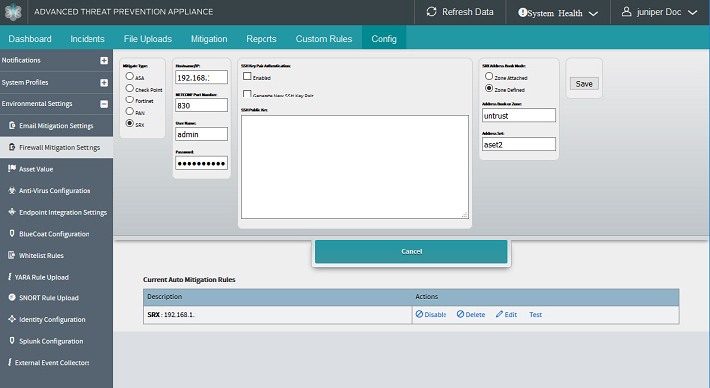
Configuration of Juniper SRX Firewall integration for auto-mitigation is a two-step process;
First, configure the Juniper SRX firewall: Create an address set to contain all mitigated IP addresses to be pushed by the Juniper ATP Appliance Central Manager (CM). Then enable remote configuration via the NETCONF protocol. Also, gather the appropriate user credentials that the Juniper ATP Appliance CM will use to configure the SRX. Configure the security policy address book and address sets from the SRX CLI.
Address sets and zone-defined or zone-attached policies are discussed in the configuration section of this guide as well as in the Juniper Junos SRX documentation.
Next, configure auto-mitigation from the Juniper ATP Appliance Central Manager (CM) Web UI Config>Environmental Settings>Firewall Mitigation Settings tab.
Cisco ASA Firewall Integration
With integrated Cisco ASA Firewall support, enterprises with deployed ASA Firewalls are able to push IP addresses from Juniper ATP Appliance products to the Cisco ASA Firewall platform for malware blocking. Juniper ATP Appliance uses a REST interface to communicate with the ASA Firewall.
Refer to Configuring a Cisco ASA Firewall.
Check Point Firewall
Configured Check Point Firewall integration allows Juniper ATP Appliance products to communicate and perform threat mitigation in concert with Check Point firewalls. A Juniper ATP Appliance administrator can choose to block a particular threat or remove a previously propagated mitigation via Check Point Firewall integration.
Communication takes place via the SSH interface through which Check Point users may also access the CLI of the Check Point device.
Blocking information is submitted using Check Point APIs. By pushing malicious IP addresses to integrated Check Point appliances, similar to Juniper ATP Appliance’s established PAN and Juniper integration support, an administrator identifies threats at the Firewall or Secure Web Gateway, and submits the selected objects to the configured Check Point Firewall from the Central Manager Web UI.
Juniper ATP Appliance firewall blocking corresponds to Check Point CLI SAM commands, as follows:
fw sam -J any <blocked_address>
 # Drop and close
fw sam -C -i any <blocked_address>
fw sam -C -j any <blocked_address>
fw sam -s <sam_server> -S <SIC_name> -f
<fw_host> -[ i | j | I |J] any
<blocked_address>
fw_host can be All, localhost, Gateways, or a group or object name
fw sam -s <sam_server> -S <SIC_name> -f
<fw_host> -C -i any <blocked_address>
fw sam -s <sam_server> -S <SIC_name> -f
<fw_host> -C -j any <blocked_address>
The Check Point “FW SAM CLI Reference” guide is available online.
After configuring the Check Point server, set up integration with Juniper ATP Appliance products from the Central Manager Config>Environmental Settings>Firewall Mitigation Settings page:
Refer to Configuring a Check Point Firewall.
BlueCoat ProxySG Integration
For BlueCoat ProxySG integration, Juniper ATP Appliance publishes a “web page” with a list of URLs to which the BlueCoat device is directed. ProxySG polls the malicious URL list periodically to collect blocking details.
BlueCoat can be configured to apply various rules to the Juniper ATP Appliance list, including blocking, as desired.
Refer to Configuring BlueCoat ProxySG Integration.
Endpoint Mitigation with Carbon Black Response
Juniper ATP Appliance provides comprehensive closed-loop integration between its threat analysis and detonation services, and the enterprise endpoint via Carbon Black Response partner service.
Juniper ATP Appliance and Carbon Black Response integration combine Juniper ATP Appliance’s network-based threat defense with Carbon Black Response’s next-generation endpoint and server security service to provide bidirectional visibility and mitigation support.
While Juniper ATP Appliance detects malware on the network, Carbon Black Response is assessing where the detected malware landed, if it executed, and how many host machines in the enterprise were affected. This real time visibility enables security analysts to filter out non-actionable events, prioritize high-impact alerts faster, and improve response times to potential intrusions.
Juniper ATP Appliance confirms the location, scope and severity of a threat, and simultaneously queries Carbon Black Response to determine if the malicious file was executed at the endpoints. In this way, the Juniper ATP Appliance Platform can efficiently determine exactly where an attack sits in the kill chain and if a download progressed to infection, expediting targeted enterprise remediation.
In addition, if mobile users download potential malware objects while outside the boundaries of their organization, Carbon Black Response software running at the endpoint can use its blocklist to allow or deny opening of the file. However, in case of a zero-day threat, the blocklist entry does not exist. In such a scenario, the Carbon Black Response solution can submit the file to the Juniper ATP Appliance Core and get a verdict before allowing execution of the file and thus protect the mobile user.
Also, as new files arrive on your endpoints and servers, Carbon Black Response can submit them—on-demand or automatically— for analysis by Juniper ATP Appliance. If Juniper ATP Appliance determines that the file is malicious, Carbon Black Response will stop it from executing and can block the execution of this file across the enterprise’s entire user base. As a result, additional users downloading the same malware objects are automatically protected from malware infections.
Juniper ATP Appliance integration with Carbon Black Response provides significant threat defense benefits:
Continuous, real-time visibility into what’s happening on every computer
Real-time threat detection, without relying on signatures
Instant response by seeing the full “kill chain” of any attack
Prevention that is proactive and customizable
Refer to Configuring Endpoint Integration: Crowdstrike and Carbon Black Response for more information, and the Juniper ATP Appliance/Carbon Black Response Integration Guide.
CEF, QRadar LEEF Logging Support for SIEM
Juniper ATP Appliance’s detection of malicious events generates incident and alert details that can be sent to connected SIEM platforms in CEF and QRadar LEEF format.
The Juniper ATP Appliance Central Manager WebUI Config>System Settings>SIEM Settings provides the option to configure event, incident and alert notifications for rSYSLOG, LEEF or CEF-based SIEM servers. The servers, in turn, must be configured to receive the Juniper ATP Appliance notifications in CEF or LEEF format.

Installation of the DSM-Juniper ATP Appliance extension plugin on the QRadar server is required.
Identity information is sent as part of SIEM, and SIEM events are sent for Email detections for Downloads+Phishing (DL + PHS), Download (DL), and Phishing (PHS).
For configuration information, refer to Configuring SIEM Settings. and the Juniper ATP ApplianceCEF, LEEF & Syslog Support for SIEM User's Guide. Refer also to the document Juniper ATP Appliance CEF, LEEF & Syslog Support for SIEM..
Virtual Collector and vCore [OVA] Deployments
The Juniper ATP Appliance Core-CM and Traffic Collector products can be deployed as a virtual machine Virtual Core (vCore) and/or Virtual Collector (vCollector) using VMWare vSphere (initially) via thick or thin provisioning. This feature extends the Juniper ATP Appliance product footprint to allow deployment in virtualized environments.
The virtual deployment is provided as an .OVA for simple deployment, or .ISO for custom deployments, or vCore for Amazon EC2 AWS (Amazon Web Services).
vCenter is no longer a requirement for the virtual collector deployment. Although Juniper still provides an .ova for customers who use vCenter, in addition, Juniper also generates an .ovf and a .vmdk file for every build. The .ovf and .vmdk are bundled into a .tar file that you download and expand.
For customers who do not want to use vCenter for the virtual collector deployment: download the .tar file and expand both the OVF and the VMDK into the same directory. Then, from the vSphere client, click on File -> Deploy OVF Template. Choose the .ovf file and then complete the deployment of the ovf wizard. The configuration wizard prompts for collector/core properties such as IP address, hostname, device key. Log in to the CLI and configure each setting.
OVA vCore deployments contain the full deployment package (including detonation engines).
Customers deploy Virtual Core and Virtual Collector(s) separately.
Virtual Core performance is comparable to equally equipped physical appliances (generally same CPUs, Memory, etc). But unlike physical appliances, Juniper ATP Appliance is unable to provide MS Windows licenses for Virtual Cores due to Microsoft Licensing restrictions. Customers must supply Windows licenses for the vCore.
For installation and configuration instructions, refer to:
Juniper ATP Appliance Core-CM Quick Start Guide
Juniper ATP Appliance Traffic Collector Quick Start Guide
Clustered Core Deployment
The Clustered Core feature allows multiple Core detection engines to run in tandem to support larger networks and provides a magnitude improvement in scale of the Juniper ATP Appliance Core. Clustering improves scalability by allowing multiple cores to perform malware analysis simultaneously. Juniper ATP Appliance supports Windows-based Secondary Cores (in addition to the Mac-Mini Secondary Cores already available in previous and current releases).
If multiple cores are deployed, only a single license is required. That license only needs to be deployed on the primary core.

Clustering allows multiple appliances to be configured as analysis cores to increase analysis workload; the process works for both physical and virtual appliances. In fact, virtual appliances can be cloned and restarted to instantly improve capacity.
The Central Manager Web UI Dashboard indicates when a cluster requires more cores.
The installation procedures for clustering are the same installation procedures set for non-clustered devices.
The first Core install (perhaps an existing device currently deployed) is automatically registered as the Primary and will drive the Central Manager whenever another Secondary Core installation takes place.
second (or additional) Secondary Core or Mac OSX Secondary Core, when installed, automatically becomes a(nother) Secondary Core.
Refer to the Juniper ATP Appliance Core-CM Quick Start Guide for installation and configuration instructions. See Core/Central Manager Quick Start Guide
Small Footprint Virtual Traffic Collector
Juniper ATP Appliance offers a small footprint Traffic Collector for virtual deployments. Standard Virtual Collector OVA deployments require 512GB hard disk drive space plus 4 minimum cores and 16 GB RAM. The low-resources Collector provides a VM Collector instance requiring only 16 GB HDD, 1 Core and 4 GBof RAM, supporting 25Mpbs of traffic.
Configuration is required by customers. Refer to Juniper ATP Appliance Traffic Collector Quick Start Guide for more information. See also Configuring a Cisco ASA Firewall
This small, extremely affordable portable form factor Traffic Collector is ideal for Juniper ATP Appliance partners and small business remote offices and branch offices. The small form factor Collector is also suitable for small businesses such as retailers and consulting businesses and/or financial services organizations for which there are relatively small bandwidth requirements (~ 150 Mbps traffic data collection).
Configuration of the Collector on the Mac Mini is required by customers; configure the Small Form Factor Collector to point to the Juniper ATP Appliance Core either hosted in the public domain (AWS) or on a private Managed Security Service Provider [MSSP] data center cloud. The Cores may be either an AWS Core (launched from a Juniper ATP Appliance AMI), or a Virtual Core (operating, for example, on a VMWare vSphere platform).
The small form factor Mac Mini Collector ISO installation requires a DVI monitor cable.
Refer to Juniper ATP Appliance Traffic Collector Quick Start Guide for more information. Management
Management Traffic Proxy Support
Many customers still rely on proxies and gateways to provide rudimentary security for their endpoints. In such environments, the CM/Core must be able to function and communicate with external services similarly to an unproxied environment. This communication includes uploads and downloads for GSS, as well as software, security content and signature updates, and all other necessary communications. Juniper ATP Appliance Cores deployed in HTTP and/or HTTPS proxy environments can be configured to function and communicate with Juniper ATP Appliance GSS and other Internet services.
For more information, refer to Configuring Proxy Settings for the Management Network for Web UI configurations, and the Juniper ATP Appliance CLI Command Reference for CLI-based configurations from server mode.
Span-Traffic Proxy Data Path Support
Juniper ATP Appliance now facilitates deployment of Traffic Collectors in locations where the monitoring interface is (1) placed between the proxy and the egress network for customer environments in which the proxy supports XFF (X-Forwarded-For), or (2) [the more typical deployment scenario], the Collector is placed between the proxy and the internal network using FQDN (if available) to identify the threat source for all types of incidents.
Now, the Juniper ATP Appliance Traffic Collector can monitor all traffic and correctly identify source and destination hosts for each link in the kill chain wherever the data allows for it. Note that if the “X-Forwarded-For” header is provided in the HTTP request, detection will identify threat targets when deployed outside of the proxy (customers can choose to disable the XFF feature in the proxy setting, if desired).
Set Proxy Inside
When the web proxy is between the Internet and the Juniper ATP Appliance Traffic Collector monitoring interface, use the CLI command collector>set proxy inside for adding/removing the proxy IP address. The following diagram illustrates this deployment scenario:

The following example sets an inside data path proxy:
Juniper ATP Appliance (collector)# set proxy inside add 10.1.1.1 8080
Set Proxy Outside
Alternatively, when the proxy is between the internal networks and the Juniper ATP Appliance Traffic Collector monitoring interface, use the CLI command collector>set proxy outside for adding/removing the proxy IP address. The following diagram illustrates this deployment scenario:

The following example sets an outside data path proxy:
Juniper ATP Appliance (collector)# set proxy outside add 10.2.1.1
Single Sign On SAML Authentication
SAML (Security Assertion Markup Language) standardizes the functions involved in receiving, transmitting, and sharing security assertion information. Juniper ATP Appliance supports SAML authentication for web browser single sign-on (SSO) operations. More information about SAML can be found at https://en.wikipedia.org/wiki/ SAML_2.0.
YARA Rules Support
Juniper ATP Appliance supports the use of YARA rules for malware analysis. Using YARA, an open source static analysis tool, security analysts can define byte-level rules used to quickly analyze numerous object and traffic files for relevant matches. If a byte-pattern match is identified, then analysts can specify that byte-pattern as a YARA rule and upload to the Juniper ATP Appliance Central Manager to be used to detect related malicious files during Juniper ATP Appliance malware detonation and analysis cycles.
You can choose to define YARA rules as malware families based on textual or binary patterns obtained from samples of identified families. Rule descriptions consist of a set of strings and a Boolean expression that establishes the rule’s logic. In addition, YARA integration results show whether an object can be classified as malicious. YARA rules are also used to classify malware samples.
YARA rule files are uploaded and enabled from the Juniper ATP Appliance Central Manager Web UI Config>Environmental Settings>YARA Rule Upload page, where a wide variety of available YARA file formats are accepted and integrated. For configuration information, refer to Configuring YARA Rules.
YARA Rules for Detecting Lateral Spread within a Customer Network
Remote Administration Tools (RATs) can allow remote control of an enterprise system as if physical access is established. Although there are certainly legal application of RATs, this software is often associated with criminal or malicious activity via software installed without the target’s awareness. Remote Administration Tools can be detected using YARA rules. Juniper ATP Appliance provides the ability to push YARA rules to Juniper ATP Appliance devices to detect the lateral spread of RATs inside the customer network. These Lateral spread rules are packaged in the Juniper ATP Appliance product. Details of matched YARA rules are displayed in the Juniper ATP Appliance Central Manager Web UI “Incidents” tab; matched YARA rules can be downloaded from the Web UI as well.
An Advanced license is required to enable SMB lateral monitoring, but YARA rules can be installed and applied regardless of SMB use.
For more information about YARA Rules for lateral detections, refer to YARA Rules and Lateral Detection.
Custom SNORT Rules Support
Support is provided for customers to upload Snort Rules that will be matched against network traffic monitored by Juniper ATP Appliance Collectors, with match results displayed in the Juniper ATP Appliance Central Manager Web UI. Additionally, Juniper ATP Appliance correlates triggered rules with incidents that were active at the time of the trigger. All triggered SNORT rules are displayed in their own main Web UI Custom Rules tab
Refer to Configuring Custom SNORT Rules for more information.
Email Correlation and Mitigation
Malicious Email Correlation features are implemented to analyze not only email attachments (as has been available in previous releases), but to also detect phishing by analyzing malicious URLs within enterprise emails. Correlation between HTTP/SMB incidents and email events is performed when an URL is first identified in an incoming email and then later also visited by an endpoint. Email alerts are generated for phishing event mitigation.
Email Correlation requires an Active Directory configuration.
Refer to Email Phishing Correlation for more information.
Reverse SSH Tunneling for Optimizing Customer Technical Support
Juniper ATP Appliance offers a Reverse SSH Tunneling feature to allow for direct debugging by a remote Juniper ATP Appliance technical support team of a Core/CM installation running in a customer network. From the Core/ CM, technical support could then SSH into component Secondary Cores and Web Collectors in the same subnet.
Configuration is required; customers enable/disable this functionality and specify the duration for the reverse ssh tunnel operation. For more information, refer to Configuring GSS Settings.
Manager of Central Managers (MCM) Virtual or Hardware Device
The Juniper ATP Appliance Manager of Central Managers (MCM) is a device that provides a centralized Web UI for Juniper ATP Appliance customers that deploy multiple Core/Central Managers (CMs) in various geographic locations including multi-tenant MSSP sites. The MCM allows customers with distributed enterprises to consolidate viewing of detected malware incidents occurring on multiple CMs registered to the central MCM.
The MCM Platform device type is represented as “mcm” in the Juniper ATP Appliance CLI. The MCM receives incident data from multiple secondary Central Manager (CM) appliances and displays that data in the primary MCM Web UI.
The MCM Web UI is a subset of the larger Juniper ATP Appliance Central Manager Web UI and includes only the Incidents tab and the Config tab for System Profile configurations, in addition to a device Refresh and Logout tab options.
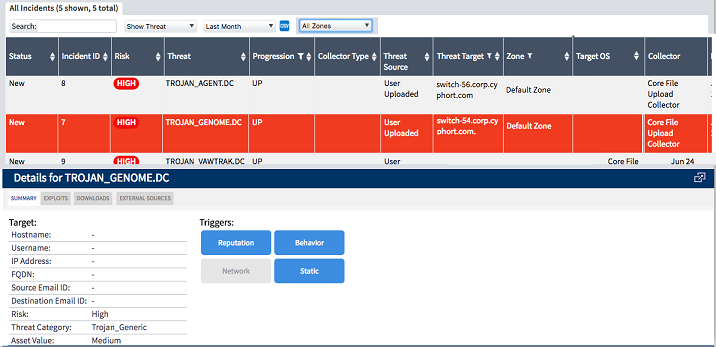
Note that the CM Name column details the name of each incident’s originating Central Manager.
Refer to the Juniper ATP Appliance Manager of Central Managers (MCM) User’s Guide and the Juniper ATP Appliance CLI Command Reference.
Advanced Threat Analytics (ATA): External Event Collectors and New Events Timeline Dashboard
ATA expedites analysis efforts by security teams that must sort through multitudinous alerts to determine which events are important, which threats are related, and which incidents deserve immediate attention from the incident response (IR) team. Juniper ATP Appliance Advanced Threat Analytics solves this problem by automatically filtering and linking all related events from other security infrastructure sources in the network, identifying the infected user, and presenting a consolidated timeline view of the entire security apparatus. This empowers security teams to accelerate incident response and process more meaningful security incidents each day.
You can configure each external event collectors for Direct Ingestion of syslogs to a Juniper ATP Appliance Core, or for Splunk Ingestion.
Raw logs are filtered and displayed on the Juniper ATP Appliance Incidents Web UI page, and a detailed host view is available from the Juniper ATP Appliance Events Timeline Dashboard.
For example, the following Incidents page example shows Juniper ATP Appliance event correlation with an external source event:
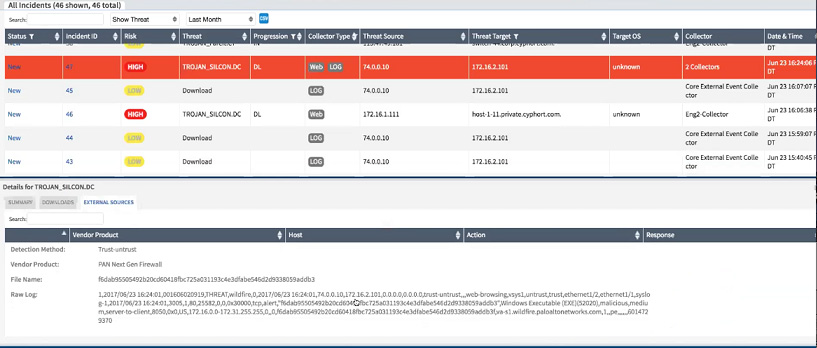
For example, the following Incidents page shows that Juniper ATP Appliance detected a Download and external source log collection also has a malicious event pertaining to the endpoint:
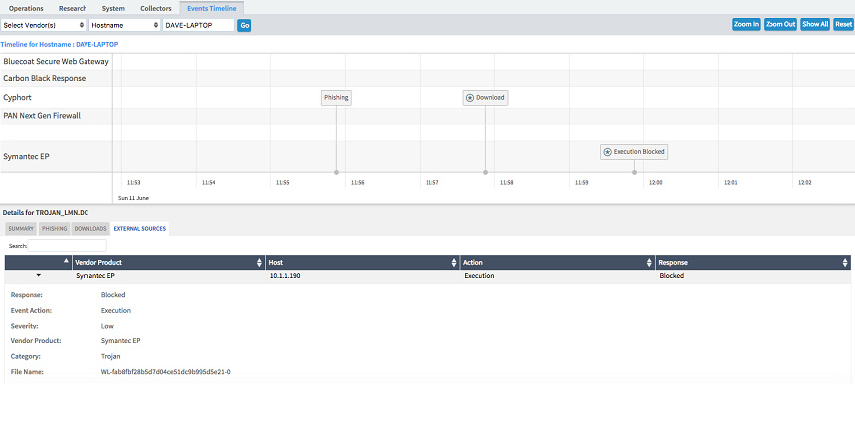
In another case note that on the Events Timeline Dashboard Juniper ATP Appliance detected a Infection going to a Command and Control Server and PAN performed a DENY action:
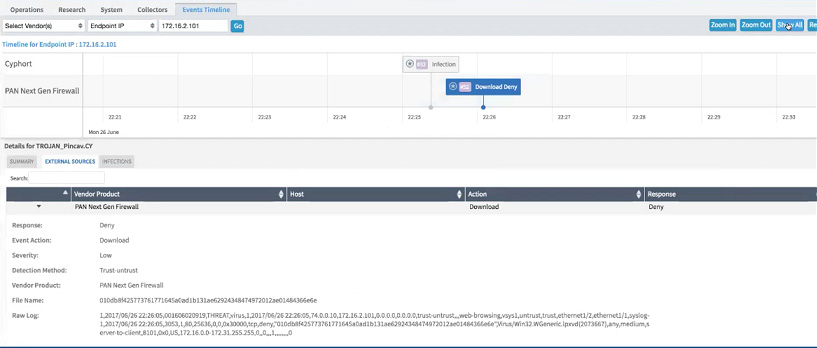
The Timeline view can be expanded to reveal all event details to show when and how the end user enacted the malicious download:
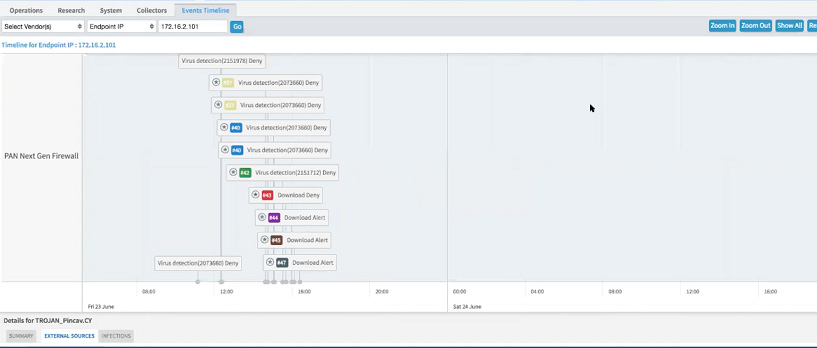
For configuration information specific to all third-party vendors, refer to Integrating External Event Collectors.
Splunk Integration for ATP Appliance Event Logs and Event Data Management.
Juniper ATP Appliance-Side Configuration
Splunk-Side Configuration
For configuration information, refer to Configuring ATP Appliance Splunk Ingestion.
Identity Configuration Options for Carbon Black Response and Active Directory via Splunk Ingestion
Identity configuration options allow for the import of all Carbon Black Response logs sent to Juniper ATP Appliance via Splunk, and all AD users’ access details via Splunk for even more detailed endpoint event reporting. This feature supplements Juniper ATP Appliance’s existing support of direct log ingestion from Carbon Black Response to a Juniper ATP Appliance Core, adding the Splunk forwarding options for enterprises that use Splunk deployments for log and event handling.
Several configurations are required:
You will need to perform several configurations:
Configure Splunk from the Juniper ATP Appliance Web UI Juniper ATP Appliance Config>Environmental Settings>Splunk Integration.
Configure Carbon Black Response from the Juniper ATP Appliance Config>Environmental Settings>External Event Collectors.
Configure Identity for AD and Splunk from the Juniper ATP Appliance Config>Environmental Settings>Identity Configurations.
Improved Representation of Malware Behavior
To improve assessments and determination about the intent of threats and malware, the behavioral analysis improvements categorize malware indicators into groups based on the malicious traits that they exhibit.
