Contrail Insights Flows in Contrail Command
These topics describe how to configure Contrail Insights Flows from Contrail Command.
Configuring Contrail Insights Flows from Contrail Command
Starting with Contrail Networking Release 1910, Contrail Insights Flows is integrated in the Contrail Command UI. Contrail Insights Flows enables you to view telemetry information for the devices in a Contrail-managed data center fabric. With the addition of this feature, Contrail Command acts as a single pane of glass where you can access the features of both Contrail Networking and telemetry feature of Contrail Insights, providing you a unified telemetry experience.
For Contrail Networking Release 1910, the flow collector provisioning
is disabled by default in the provisioning wizard. To enable flow
collector provisioning, log in to the contrail_command container
and edit the /usr/share/contrail/public/feature-list.json file. Set the value for cluster_user.xflow to true.
In Contrail Networking Release 1911 and later, the flow collector provisioning is enabled by default.
Contrail Networking Release 1911 supports provisioning of both in-band and out-of-band collectors. You can configure Contrail Insights Flows during initial setup, during fabric onboarding, or by creating and assigning telemetry and sFlow profiles to devices. For more information about configuring Contrail Insights Flows during Contrail Command installation, see Installing Contrail Insights and Contrail Insights Flows using Contrail Command in the Contrail Installation and Upgrade Guide.
Configuring Contrail Insights Flows During Fabric Onboarding
You use this procedure to provision an In-Band collector during the fabric onboarding workflow. Here, the information that you entered during initial setup is displayed and you can specify the Device Port that you want to associate with the flow collector.
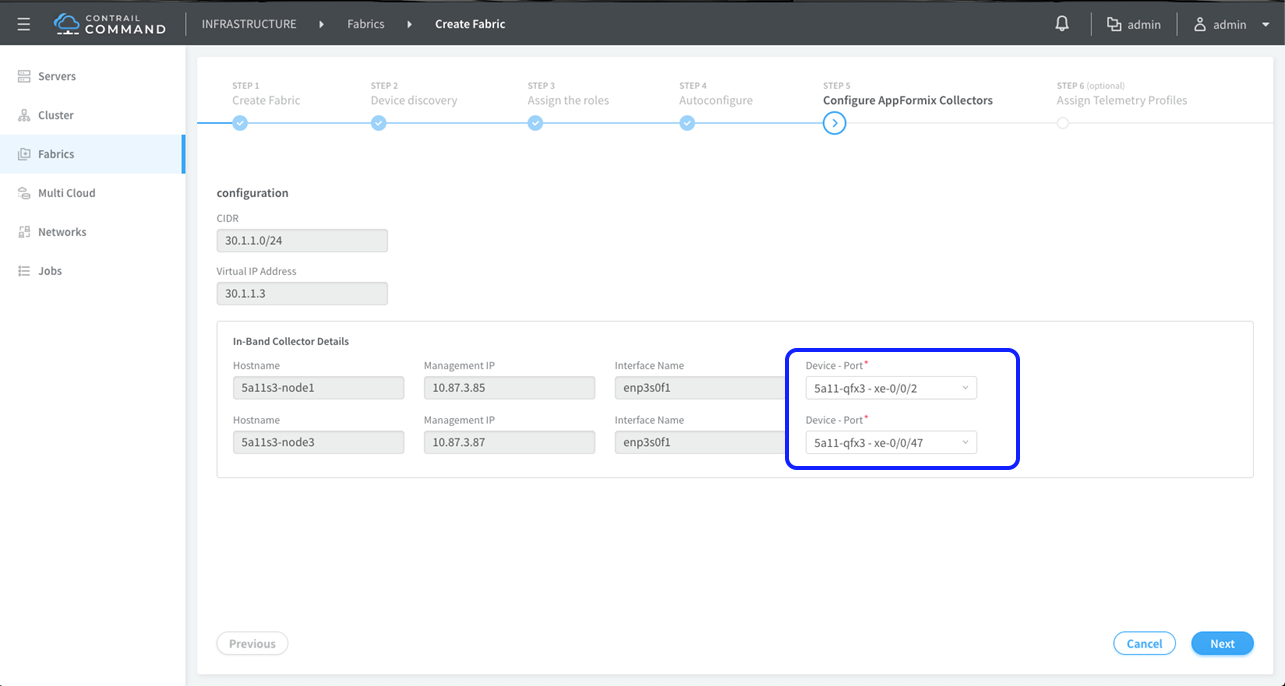
When you click Next, configuration similar to the following is pushed to the device:
set groups __contrail_underlay_infra_bms_access interfaces xe-0/0/2 unit 0 family ethernet-switching vlan members elemetry_infra_network_ipam-vlan
set groups __contrail_underlay_infra_bms_access interfaces xe-0/0/47 unit 0 family ethernet-switching vlan members elemetry_infra_network_ipam-vlan
set groups __contrail_underlay_infra_bms_access interfaces irb unit 11 family inet address 30.1.1.1/24
set groups __contrail_underlay_infra_bms_access vlans elemetry_infra_network_ipam-vlan vlan-id 11
set groups __contrail_underlay_infra_bms_access vlans elemetry_infra_network_ipam-vlan l3-interface irb.11
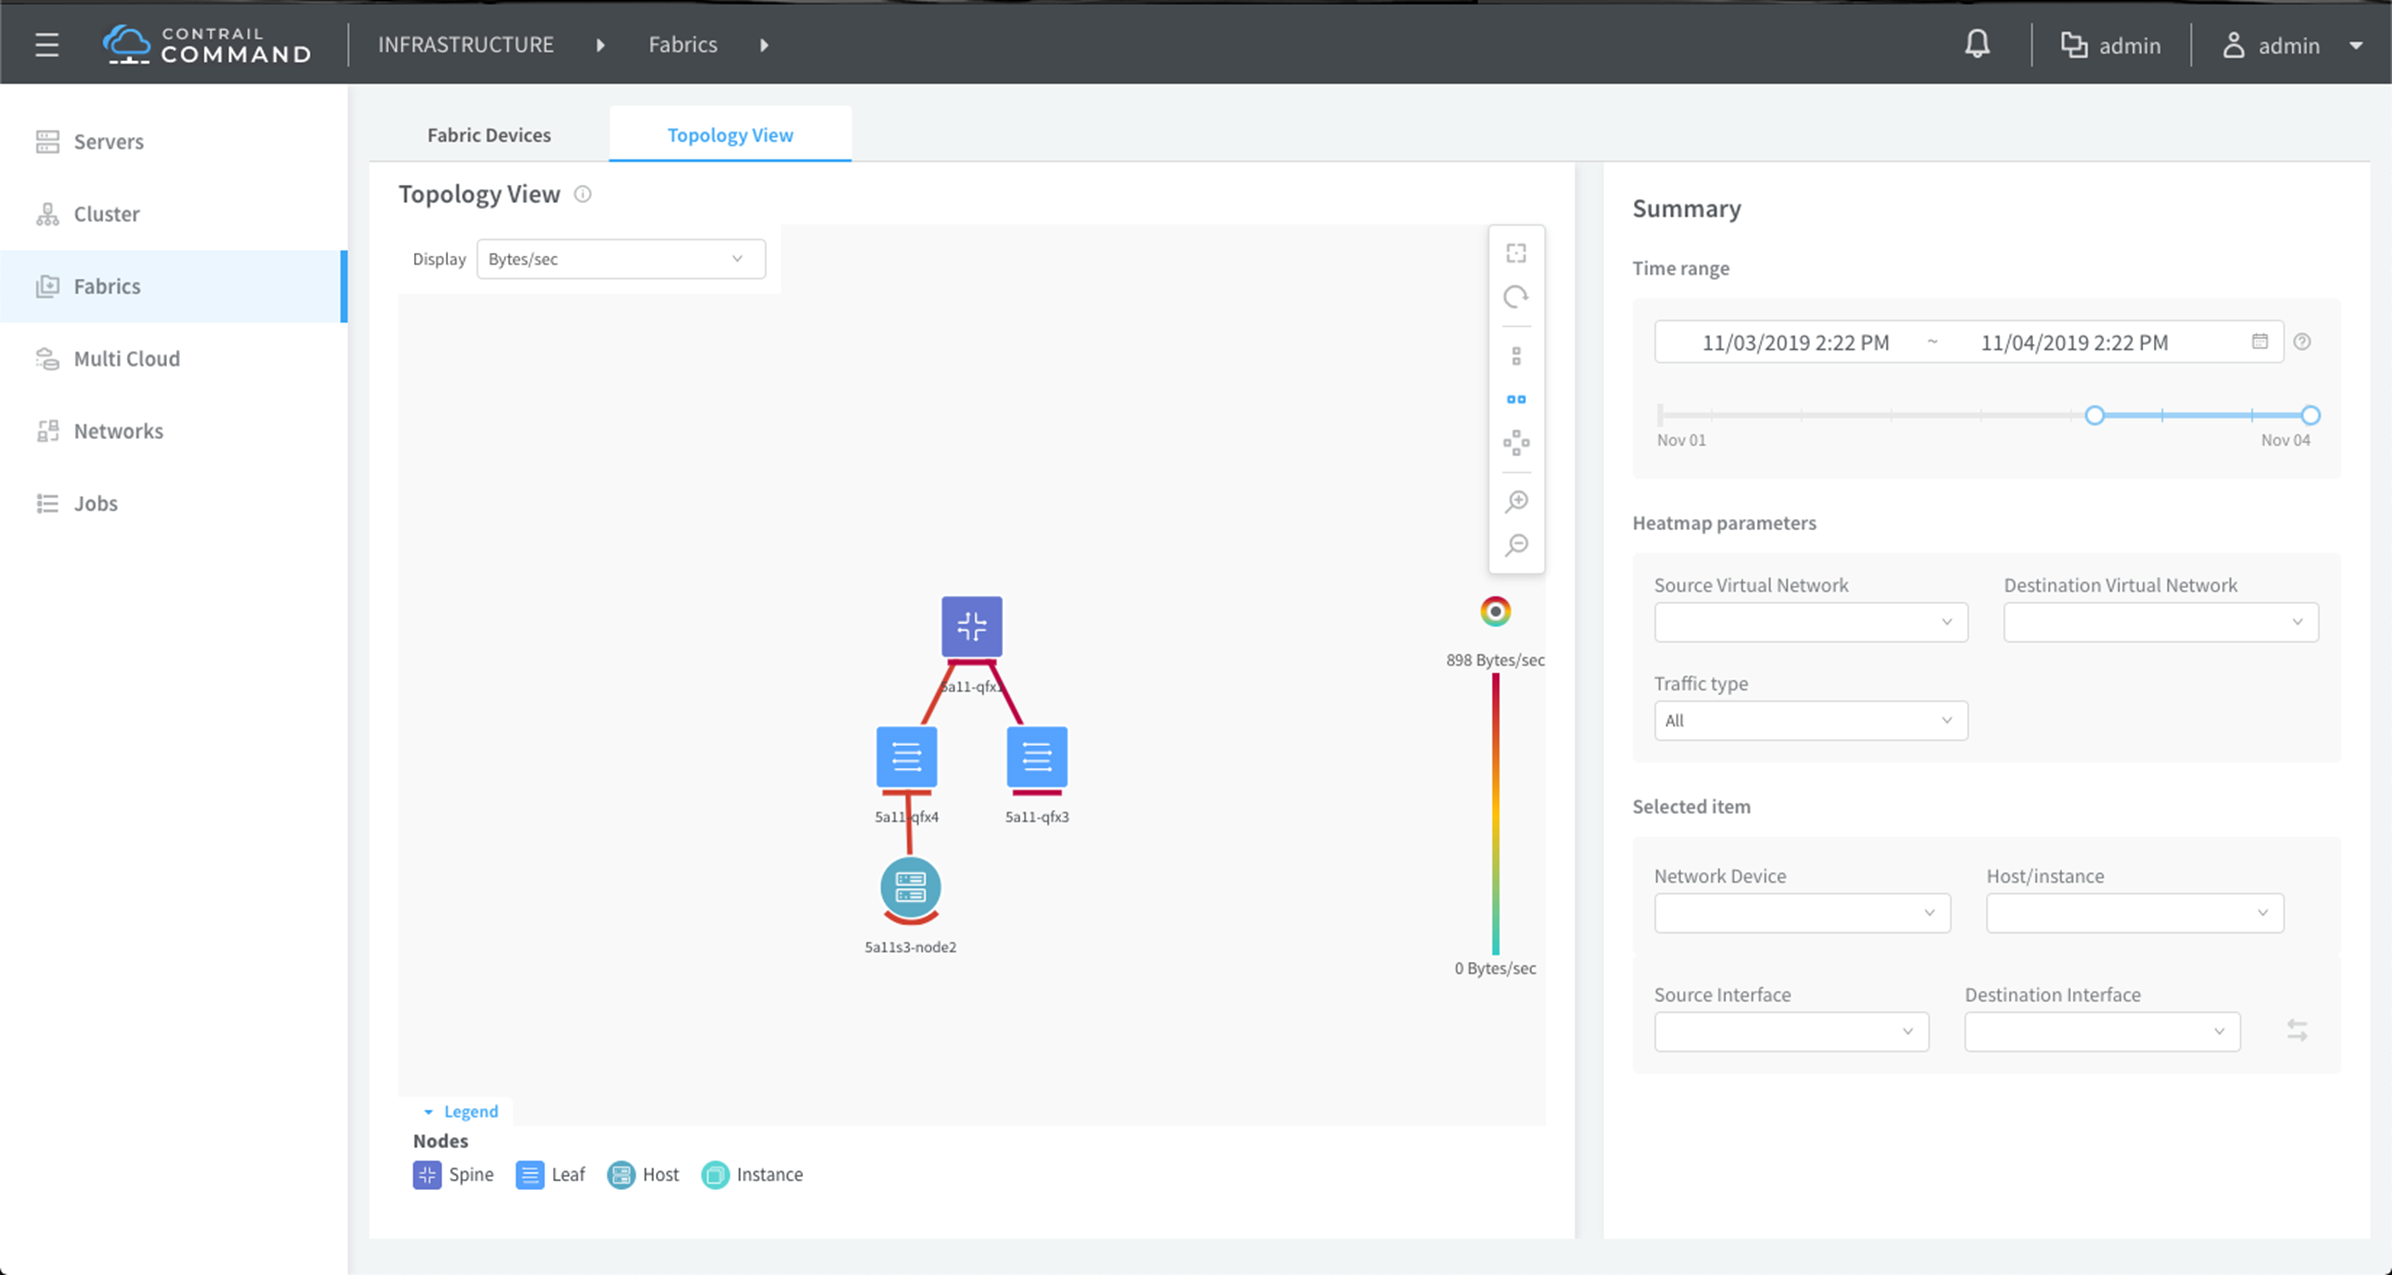
After fabric provisioning is complete, you can view the flow data from the Infrastructure > Fabrics > Fabric Name > Topology View page.
Configuring Contrail Insights Flows by Assigning Telemetry and sFlow Profiles to Devices
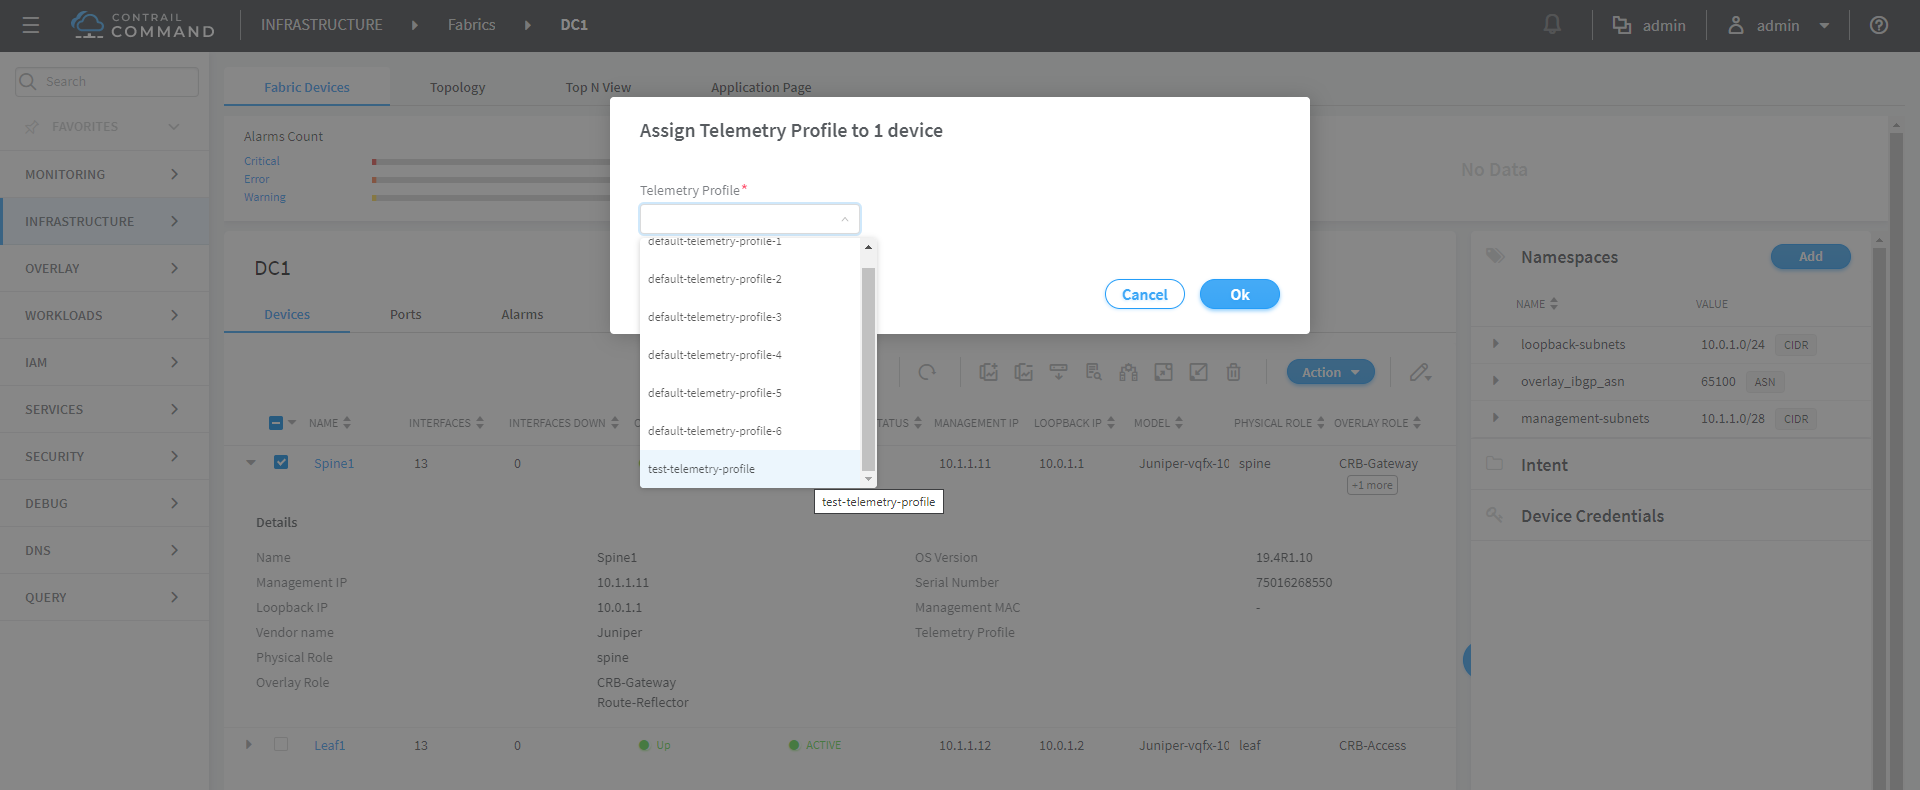
This topic describes how to provision Contrail Insights Flows and assign telemetry profiles after setting up Contrail Command and discovering devices.
The benefit of assigning telemetry profiles is that you can monitor the health of different devices and their interfaces from Contrail Command after the telemetry profile gets configured on these devices.
If telemetry profiles are not configured, there will be “No data” for the “top talkers” in the Contrail Command Top-N-View. See Top N View in Contrail Command.
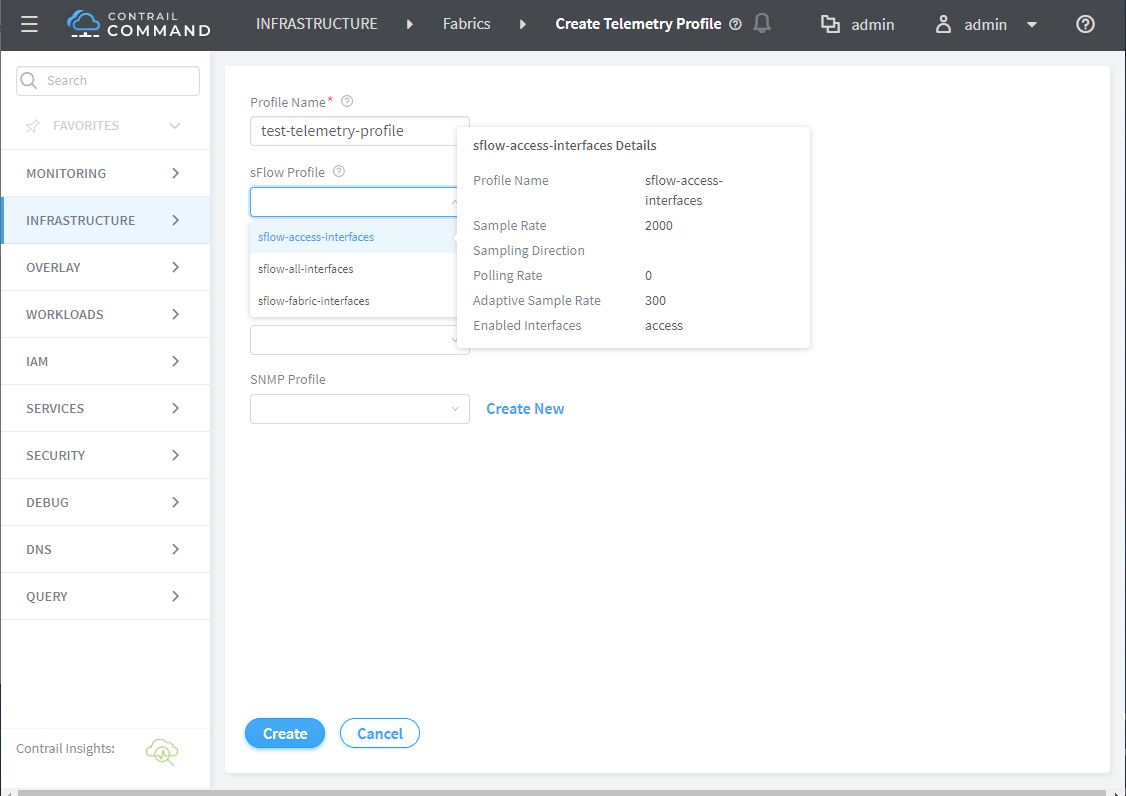
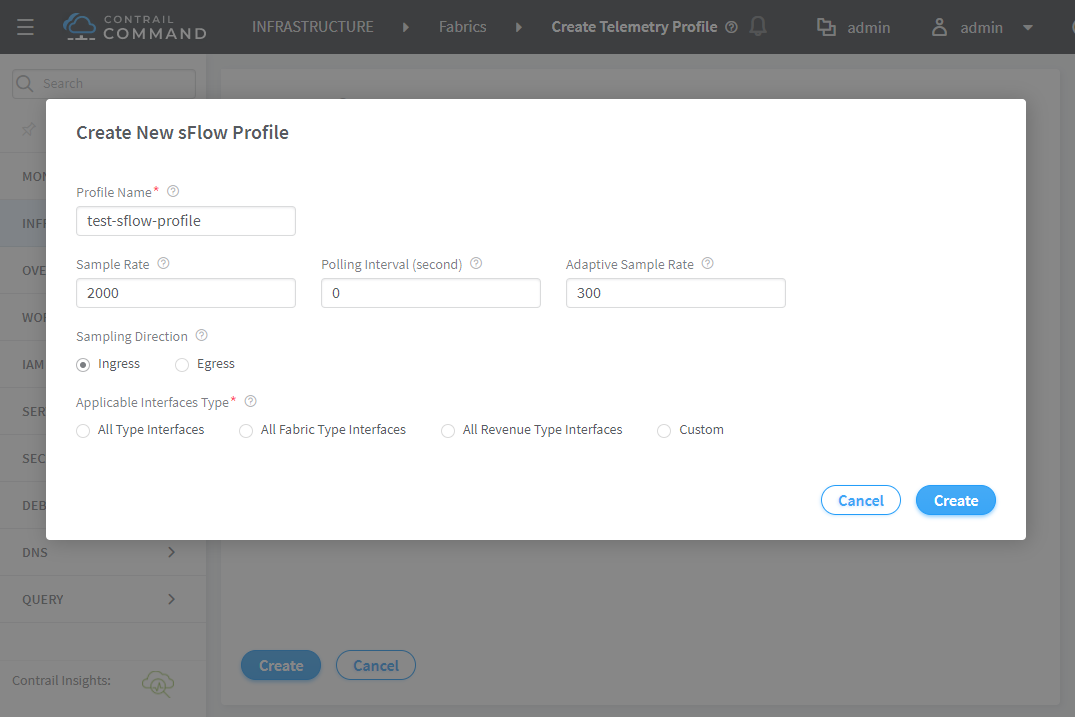
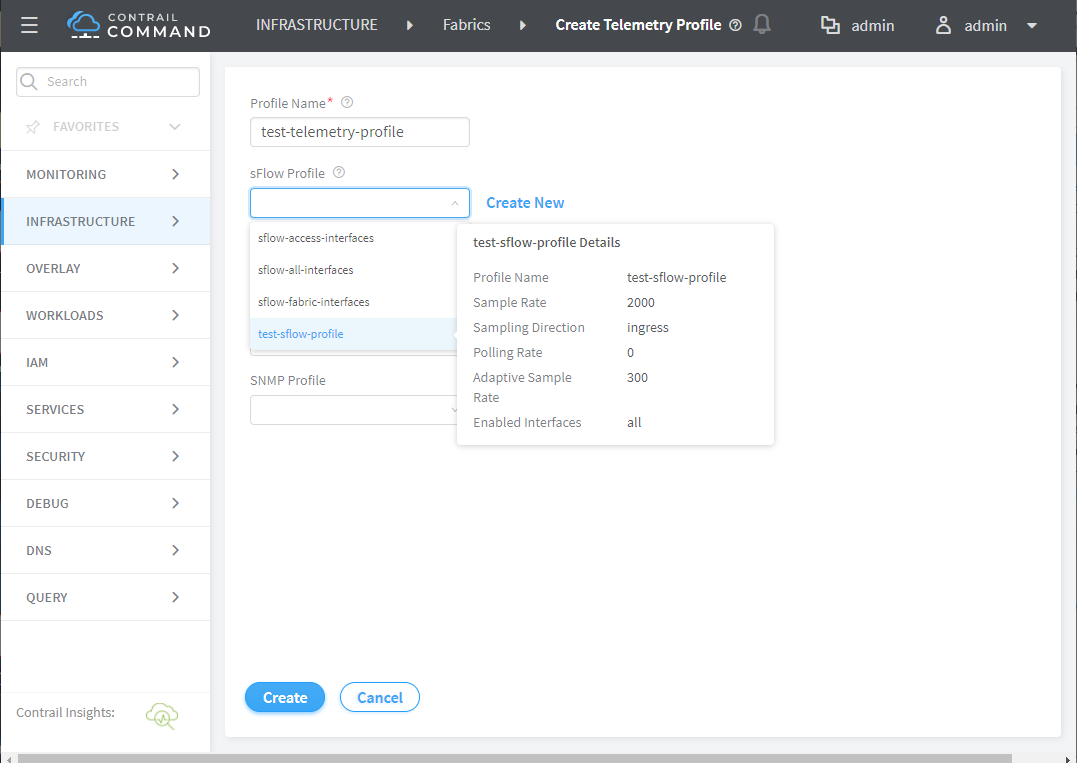
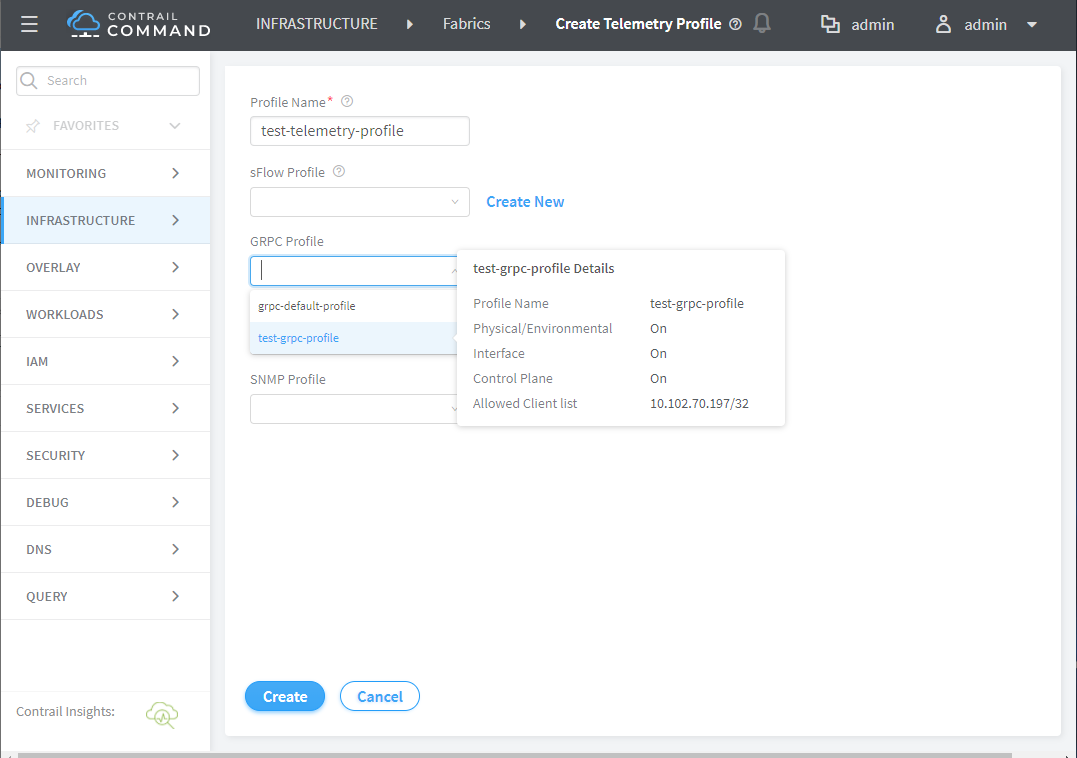
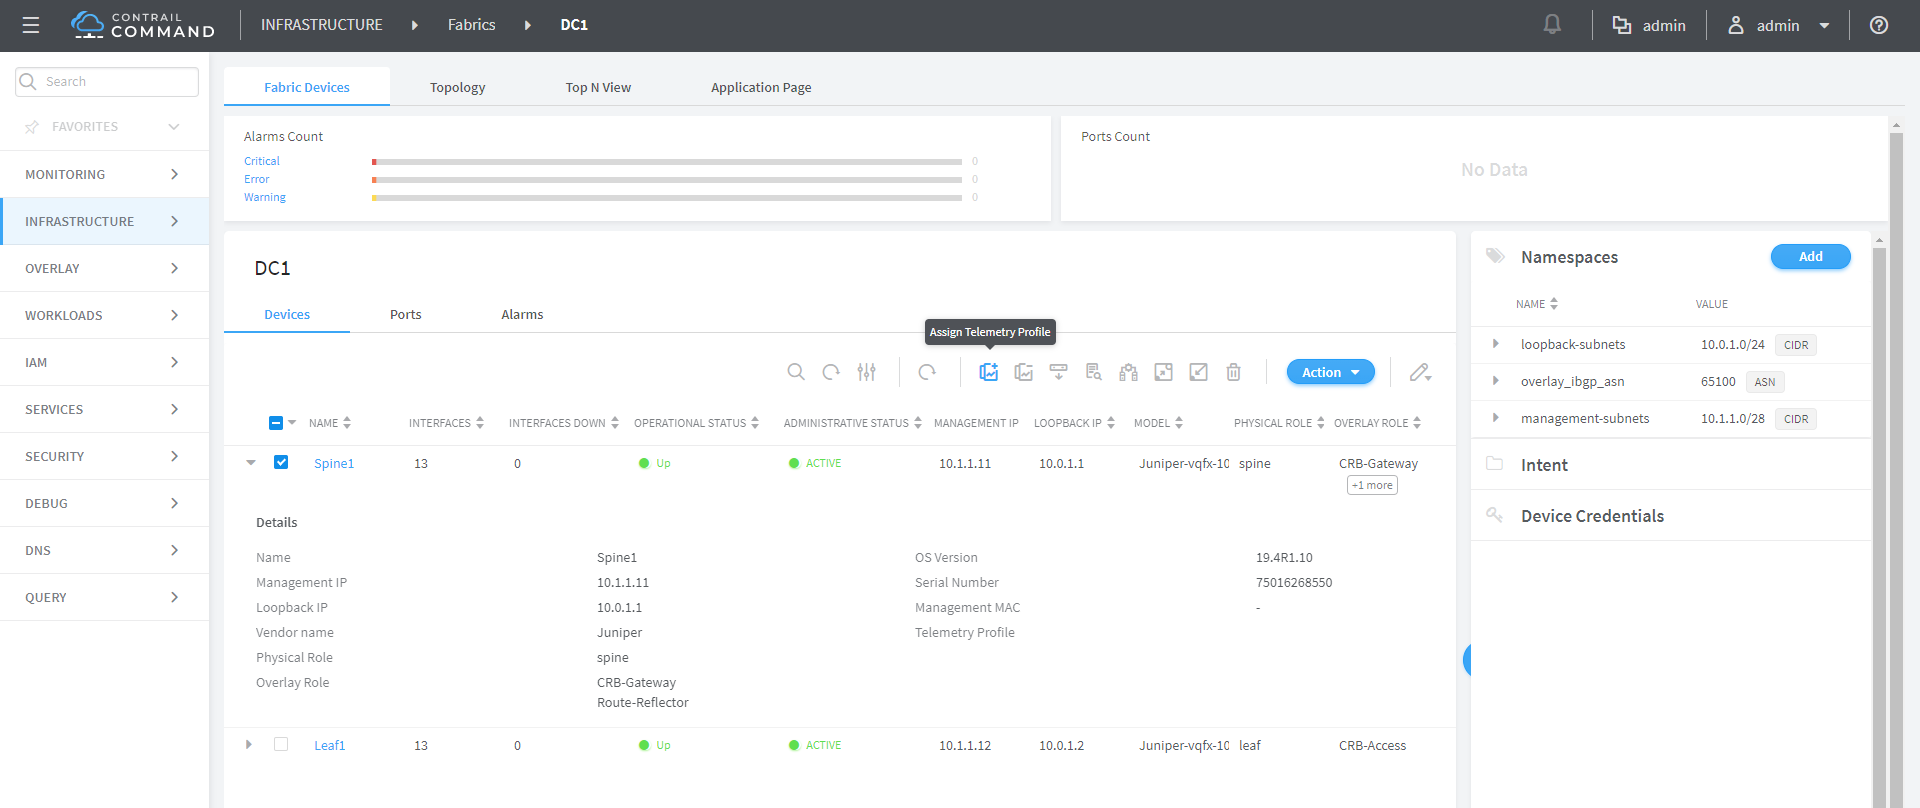
After Contrail Command is set up and devices are discovered, you can attach telemetry profiles to devices. You can attach only one telemetry profile per device. Each telemetry profile is linked to sub-profile(s). The telemetry profile can contain all types of sub-profiles but only one instance each of the sFlow, gRPC, Netconf, or SNMP sub-profiles. You can either link a telemetry profile to an existing sub-profile or create a new sub-profile while creating the telemetry profile.
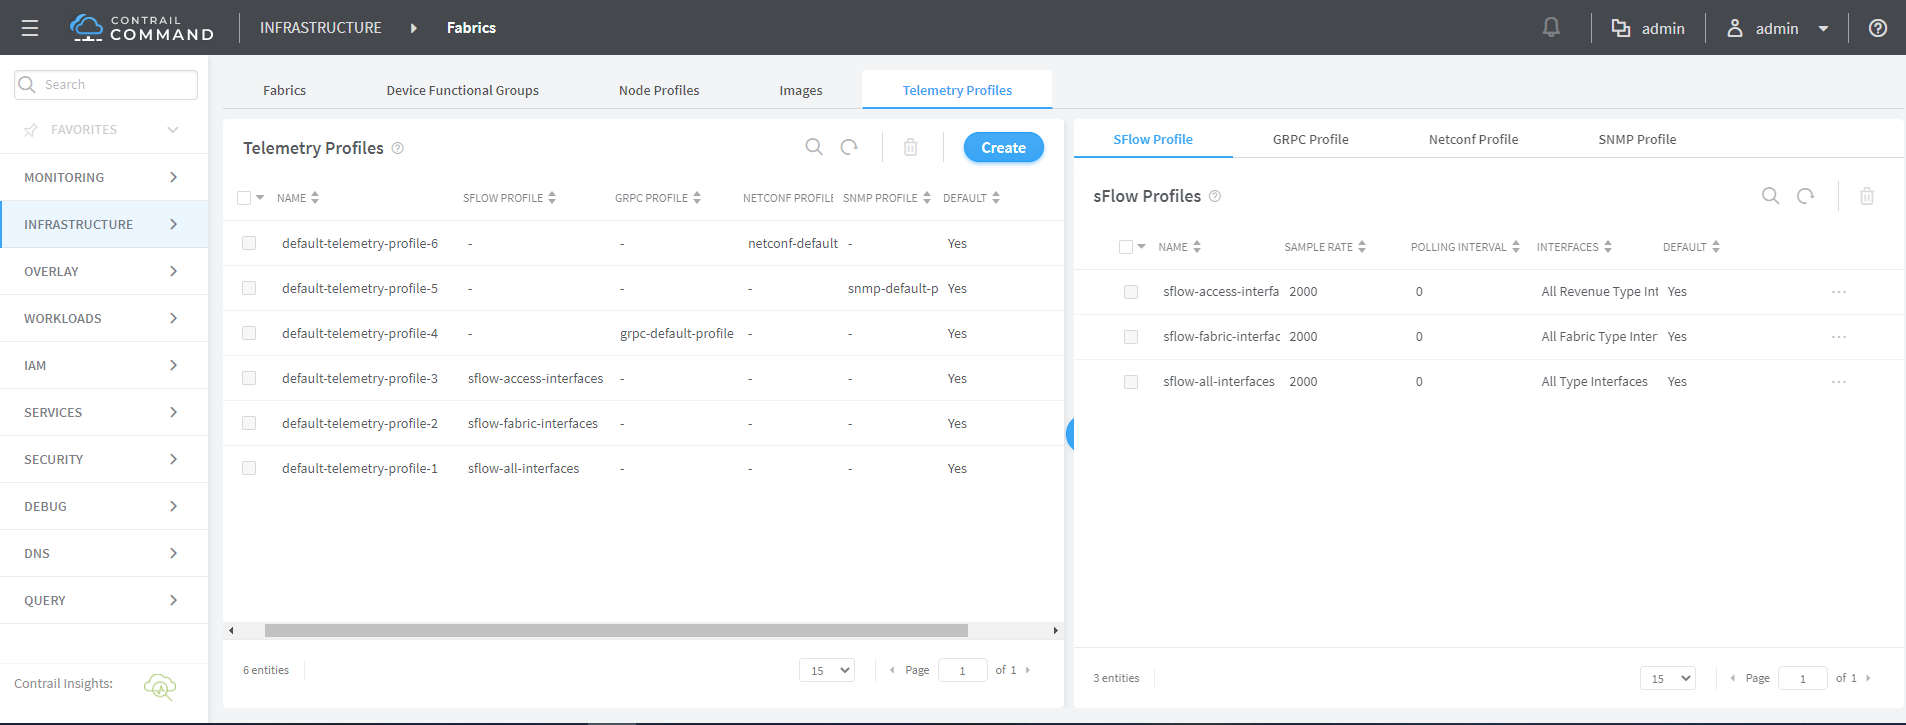
Default sFlow profiles and telemetry profiles are predefined in the system when you bring up the cluster. You cannot edit or delete these default profiles. However, you can create custom profiles and associate them to the telemetry profile.
The sFlow monitoring technology collects samples of network packets and sends them to a monitoring station called a collector. The sFlow technology implements two sampling mechanisms:
Packet-based sampling—Samples one packet out of a specified number of packets from an interface enabled for sFlow technology.
Time-based sampling—Samples interface statistics (counters) at a specified interval from an interface enabled for sFlow technology.
Contrail Networking Release 2011 supports gRPC, Netconf, and SNMP protocol-based telemetry profiles. Contrail Insights collects key performance indicators (KPIs) from network devices using preconfigured values to monitor the fabric health.
To view the health of your fabric devices, ports, and any alerts associated with exceeding KPI thresholds, navigate to Infrastructure > Fabrics > <Fabric Name>.
The default sFlow telemetry profiles are:
sflow-access-interfaces—Indicates that sFlow is enabled on all the access interfaces on the device.
sflow-fabric-interfaces—Indicates that sFlow is enabled on all the fabric interfaces.
sflow-all-interfaces—Indicates that sFlow is enabled on all the interfaces on the device that has an sFlow profile attached to it.
The default protocol-based telemetry profiles are:
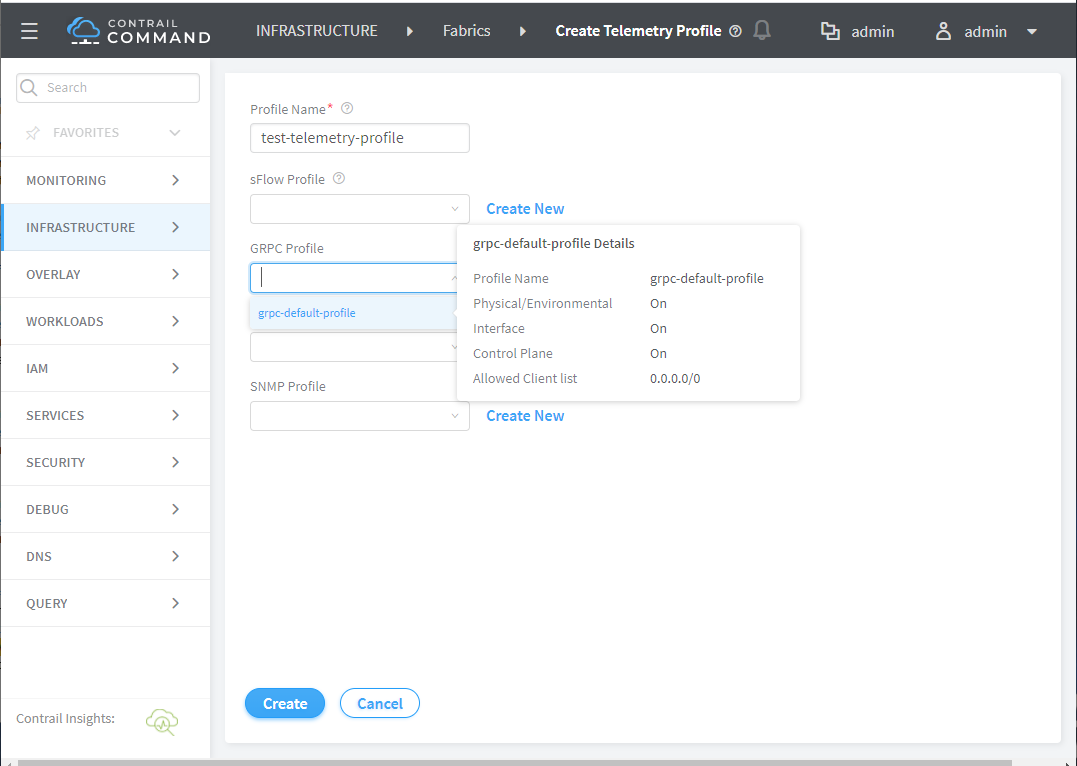
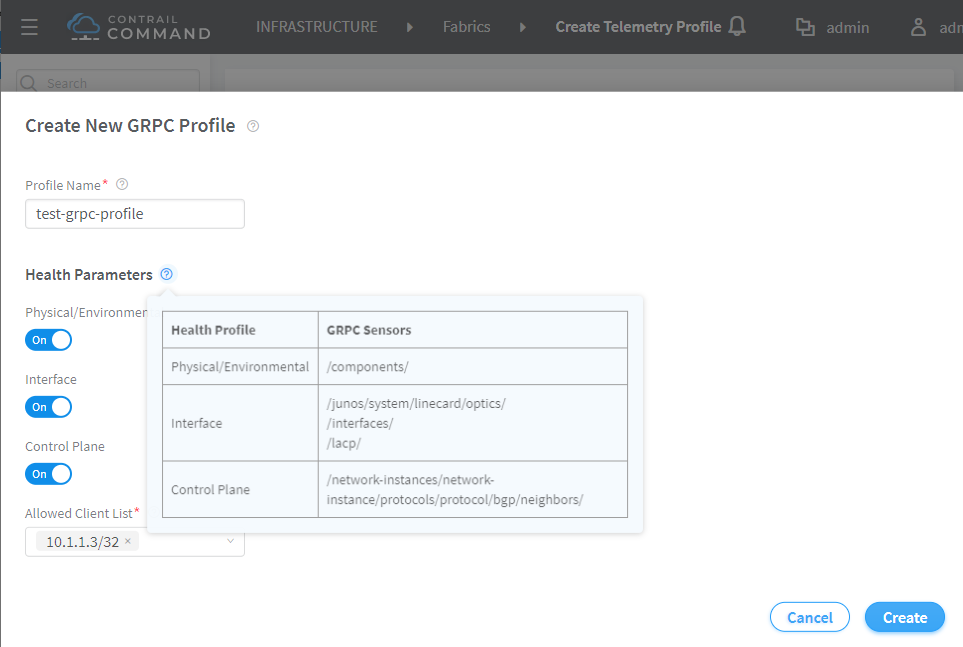
grpc-default-profile—Indicates that the health parameters for health/environment, interface, and control plane sensors are enabled for monitoring. This profile includes an Allowed Clients List with a default value of
0.0.0.0/0. See Figure 7 and Table 2.netconf-default-profile—Indicates that the health parameters for health/environment, interface, and control plane sensors are enabled for monitoring.
snmp-default-profile—Indicates that the health parameters for health/environment, interface, and control plane sensors are enabled for monitoring.
You can apply default profiles to network devices and generate alerts based on predefined KPIs and preconfigured alert generation rules.
To create a telemetry profile:
Removing a Telemetry Profile
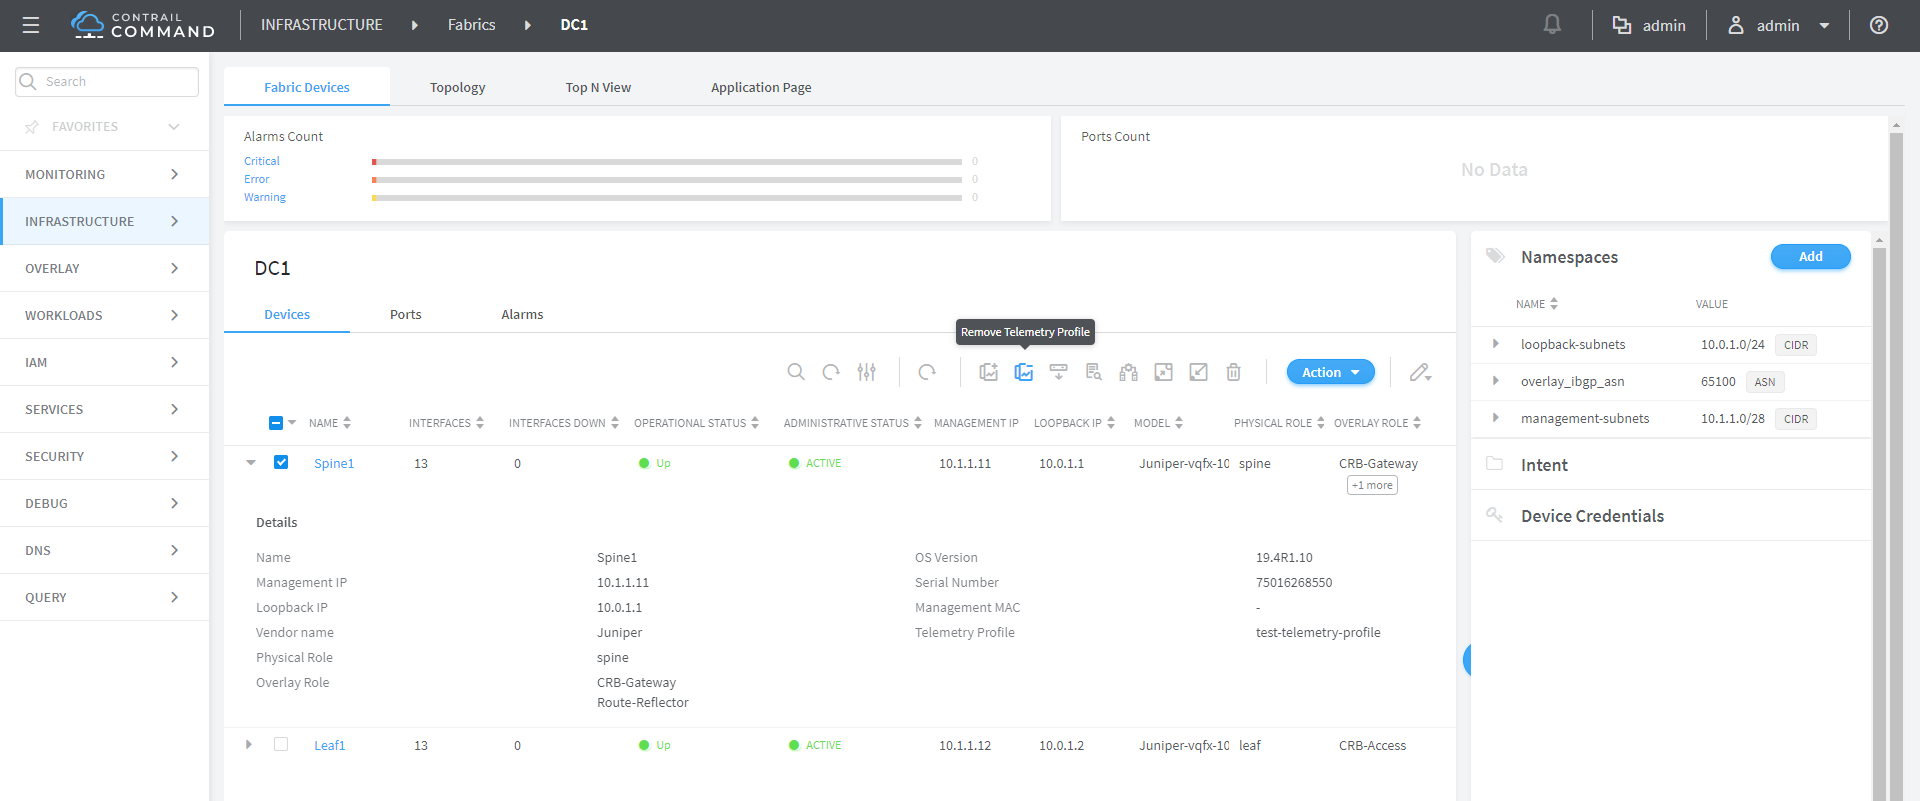
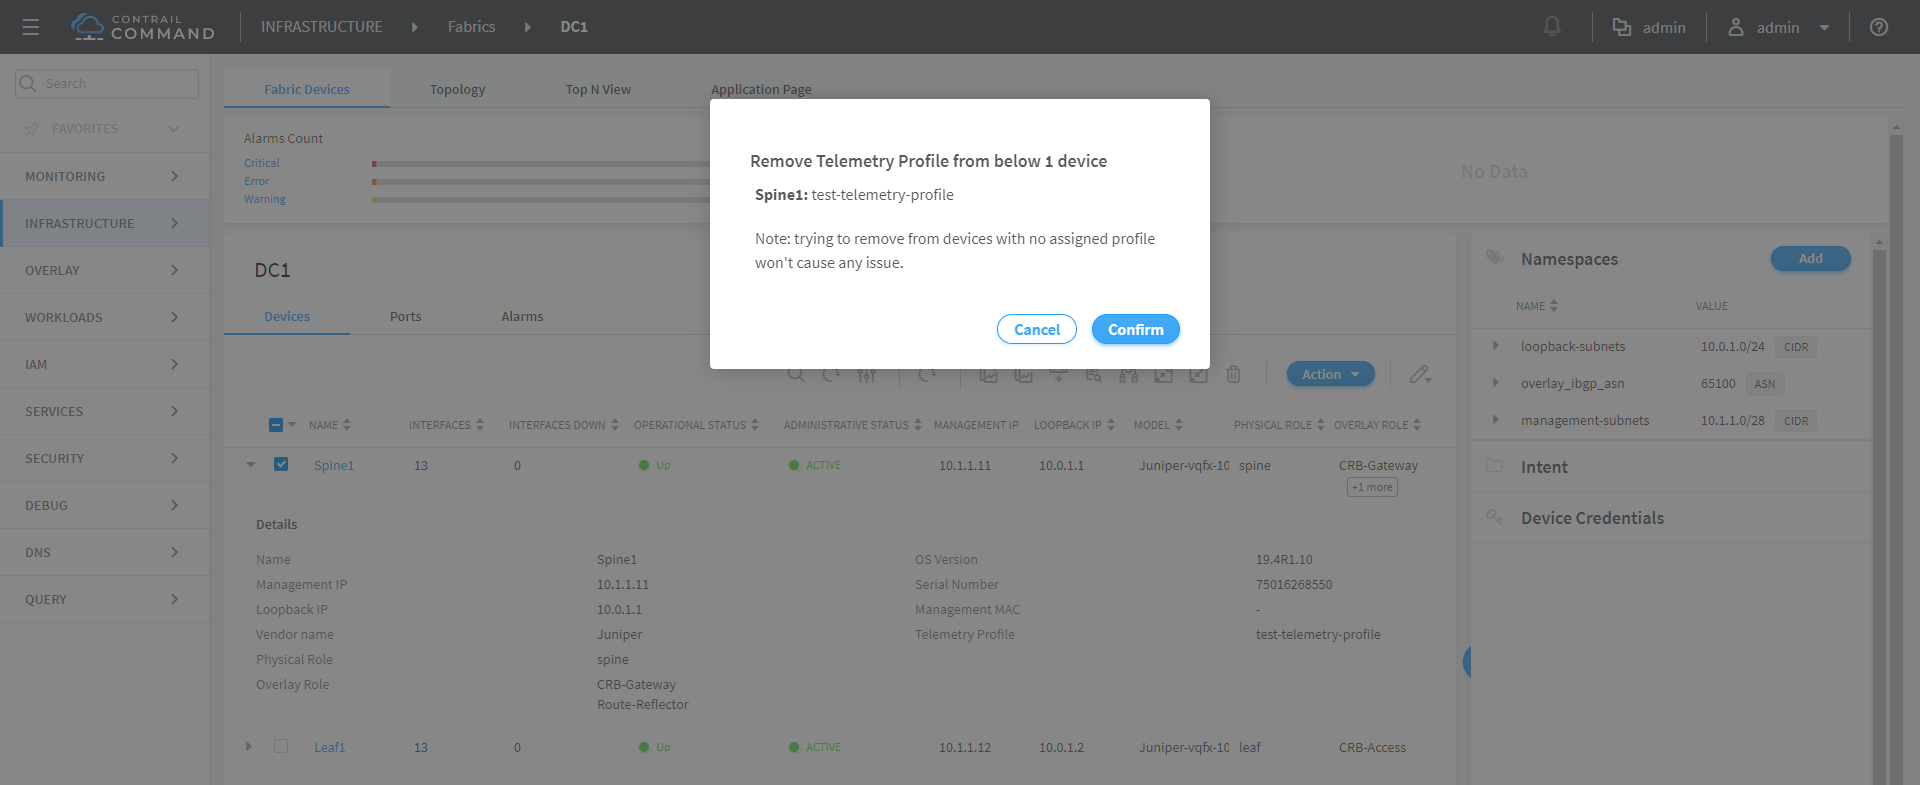
To remove a telemetry profile assigned to a device:

