- play_arrow Contrail Commands and APIs
- play_arrow Contrail Commands
- play_arrow Contrail Application Programming Interfaces (APIs)
-
Viewing Telemetry KPI Alarms for Fabric Devices and Ports
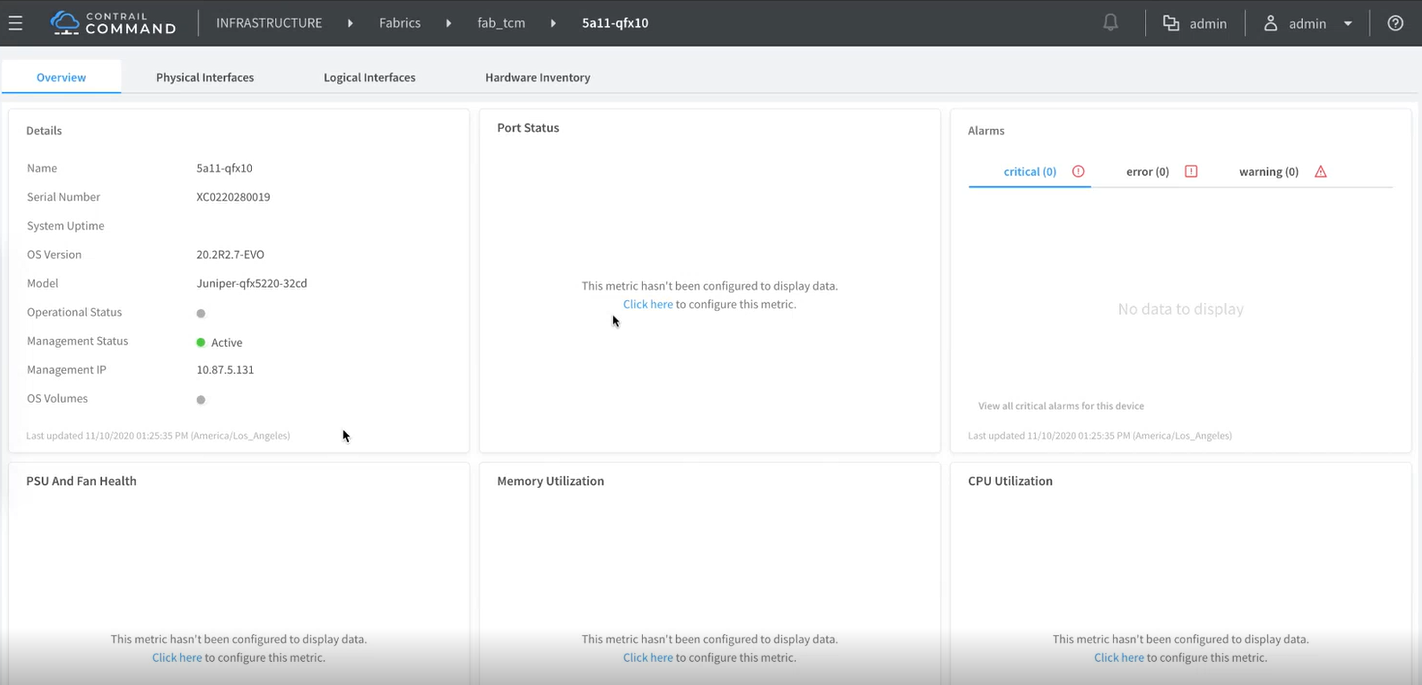
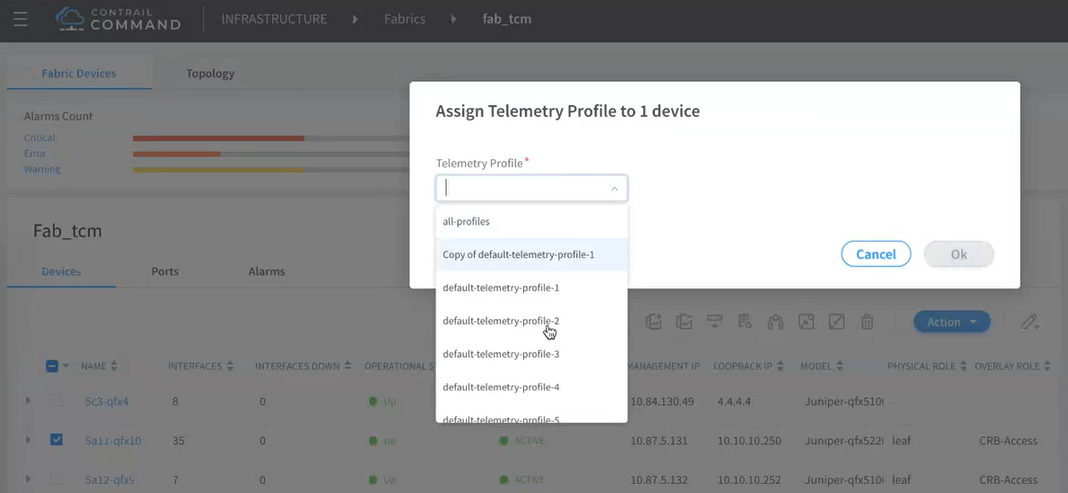
In Contrail Networking Release 2011, the Fabrics page displays additional detail about the health of your devices and interfaces, gathering data from telemetry metrics and profiles configured on these devices. These pages will show if any key performance indicators (KPIs) have crossed a threshold value. You can also configure metrics and assign telemetry profiles from the Fabrics Overview page. See Figure 10.
Fabric Devices
To view fabric devices:
Navigate to Infrastructure > Fabrics.
The Fabrics page displays. An error icon displays next to the fabrics name if there are critical or major alarms present.
Figure 1: Infrastructure > Fabrics
Table 1: Fabrics Page Information Column
Description
Name
Name of the fabric.
Note:A red alert icon displays next to the fabric name if there are any active critical or major alarms.
Physical Devices
Number of connected physical devices.
Ports
Number of physical ports.
Ports Down
Number of physical ports nonfunctional.
Critical/Major Alarm
Number of critical alarms reported by the telemetry profiles.
Spine
Number of spine devices connected in the fabric.
Leaf
Number of leaf devices connected in the fabric.
Overlay ASN
Autonomous system number for the EVPN overlay.
Select the <Fabric Name> to view more details about devices, ports, and alarms.
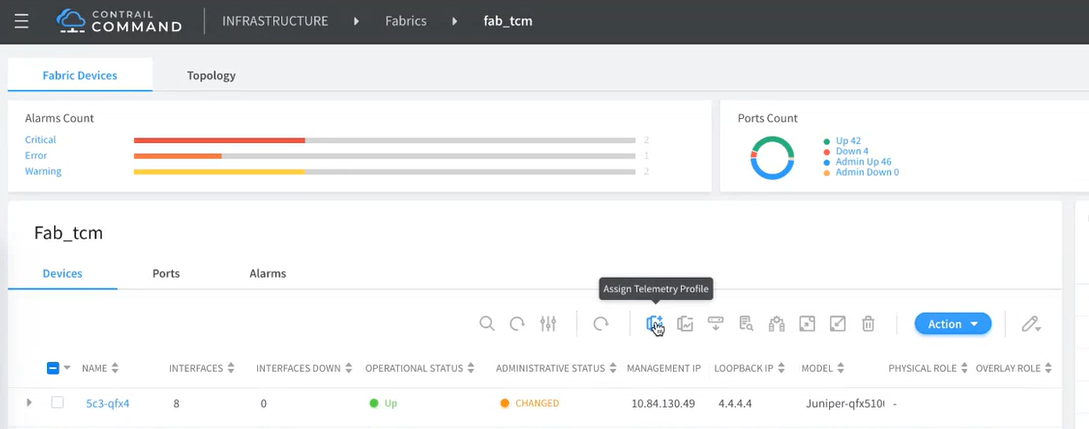
The Fabric Devices page displays an overview of the fabric devices and their real-time status.
Figure 2: Fabric Devices Page
Table 2: Fabric Devices Page Information Column
Description
Alarms Count
A progress bar chart of critical, error, or warning alarms. Click Critical, Error, or Warning to display only alarms with that severity level.
Ports Count
A pie chart of connected ports showing up or down operational status and administrative status for physical ports.
Name
Name of the fabric device. Click a <device name> to navigate to the device’s detailed overview page.
Interfaces
Number of connected physical interfaces for that device.
Interfaces Down
Number of physical interfaces nonfunctional for that device.
Operational Status
Device status as Up, Down or At Risk/Changed. This status is based on the telemetry profiles.
Administrative Status
Device status as Active, Inactive, or Changed. This status applies to the Contrail Networking configuration component versus telemetry profiles.
Management IP
IP address used as the management IP address. Contrail Command uses this IP address to connect to the Contrail Insights Flows node.
Loopback IP
Loopback subnets are used to auto-assign loopback IP addresses to the fabric devices.
Model
Brand and device type.
Physical Role
Device roles define the routing and bridging responsibilities for each device in a fabric. A fabric device can have one physical role and one or more routing bridging roles. Use this page to assign roles to each device in the fabric. See the “Device Roles” section of the Contrail Enterprise Multicloud for Fabric Management guide for information on device roles.
Overlay Role
Routing-bridging role, such as CRBGateway, ERBGateway, and so on.
Namespaces
Refers to the objects, such as BGP ASN pool, Management Subnet, or peer-to-peer (P2P) interface subnet that is assigned to a fabric.
Intent
High level abstract operations that user refers to in terms of the application-to-application connectivity he is looking for. For example VN, logical router, physical network function (PNF), and so on.
Device Credentials
Credentials for accessing fabric devices.
Ports
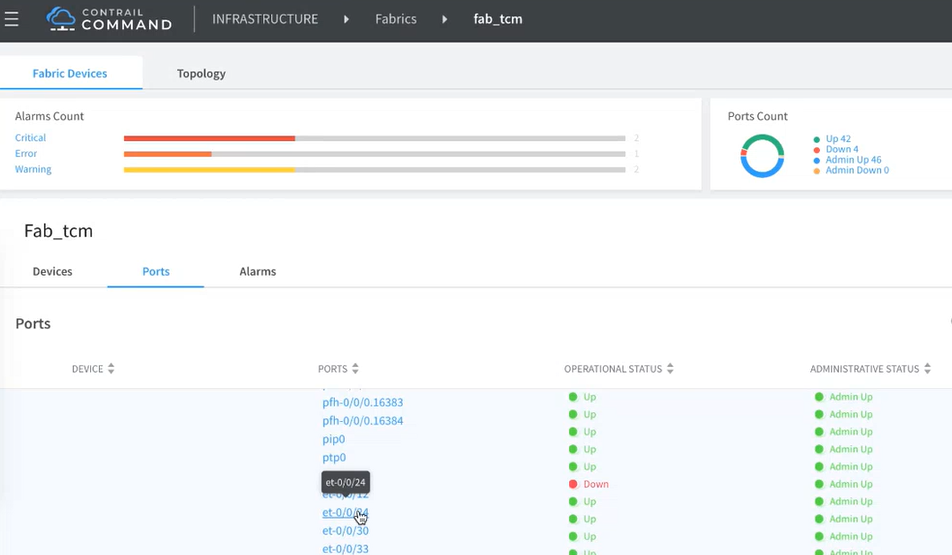
Click the Ports tab to view details about ports.
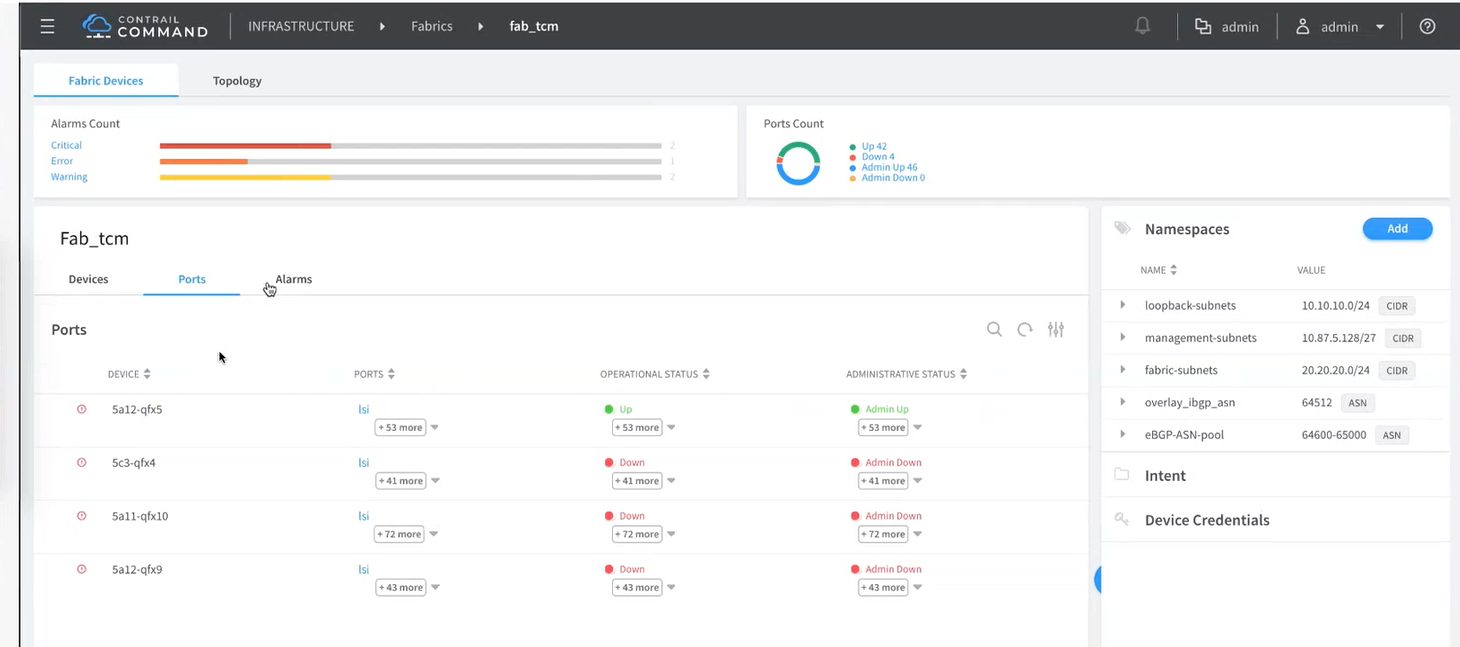
The Ports tab displays the following information:
Column | Description |
|---|---|
Device | Device name |
Ports | Number of ports reported by telemetry profiles. |
Operational Status | Device status as Up, Down or At risk/Changed. This is based on information received from the telemetry profiles. |
Administrative Status | Device status as Active, Inactive, or Changed. This status applies to the Contrail Networking configuration component versus telemetry profiles. |
Alarms
Click the Alarms tab to view all alarms on the fabric.
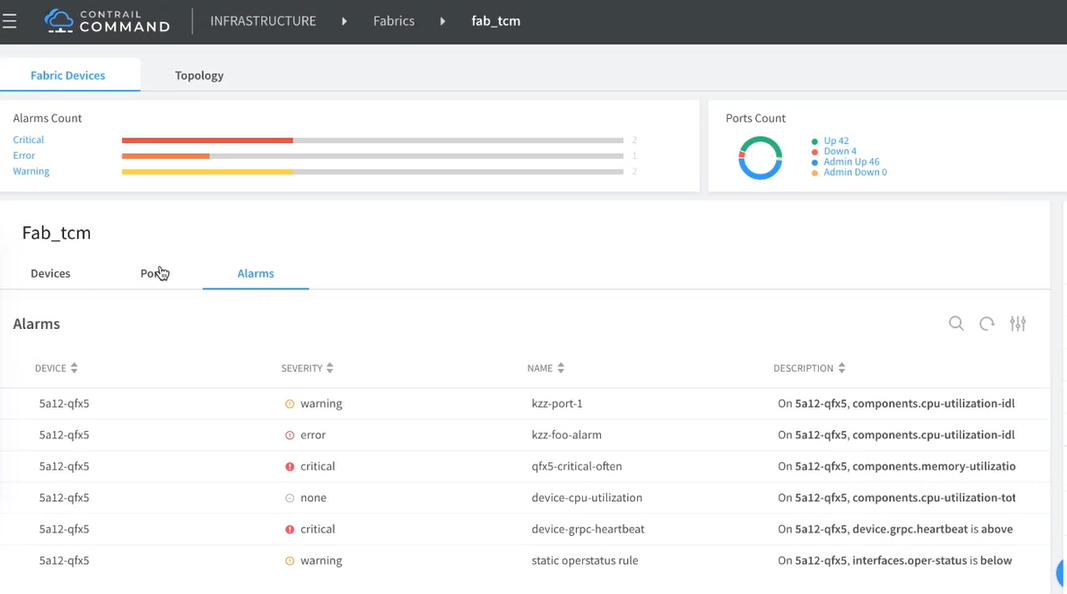
The Alarms tab displays the following information:
Column | Description |
|---|---|
Device | Device Name |
Severity | Alarm severity. Ranging from none to critical. Corresponds with Alarms Count at top of page. |
Name | Alarm name. |
Description | Brief description of alarm, that is pulled from telemetry profiles. |
Alarms Count, Ports Count, and Device Overview
In Alarms Count, click Critical, Error, or Warning to display only alarms with that severity level.

To return to displaying all alarms, click the Open filters icon and select the filter values or click Reset.
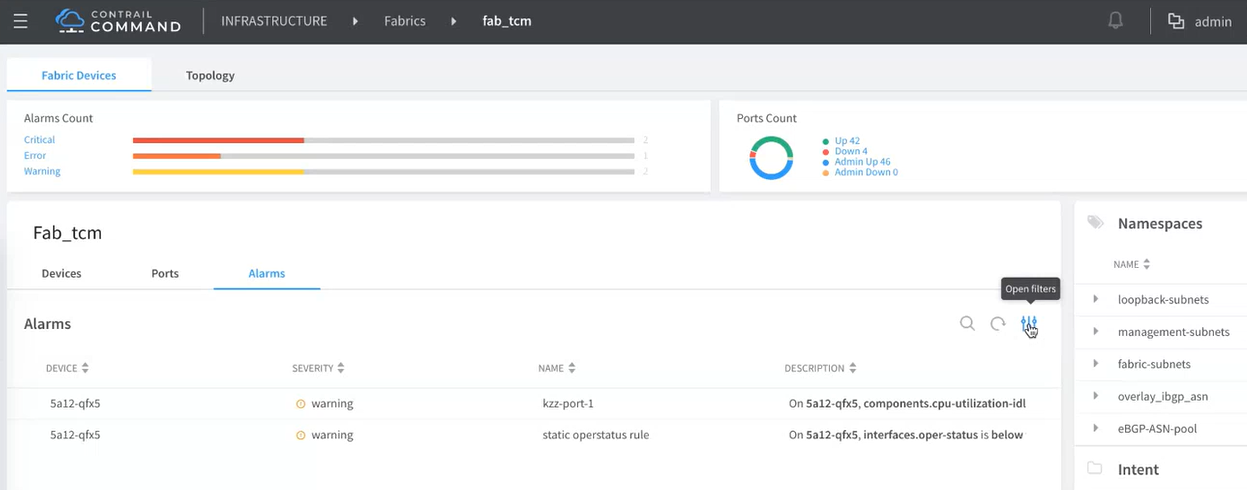
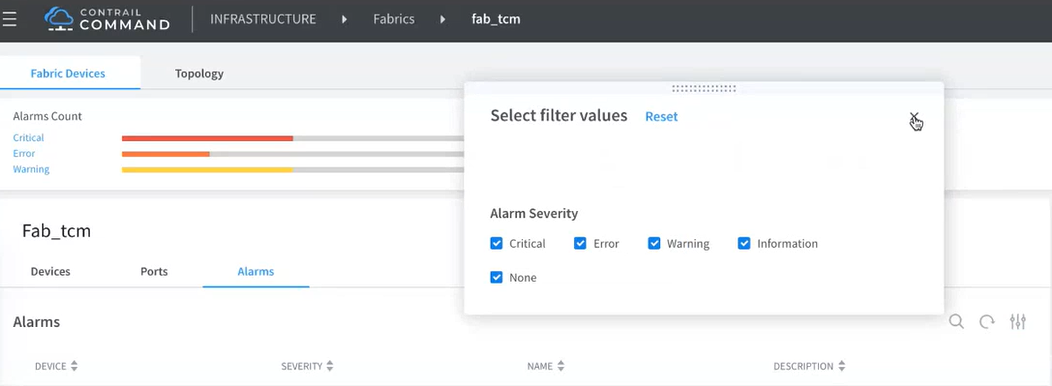
The same behavior applies to the legend items next to the Ports Count pie chart.
The Device Overview page shows more detail provided by the telemetry profiles. The Alarms panel displays up to eight alarms. Click View all critical alarms for this device to see any additional alarms.
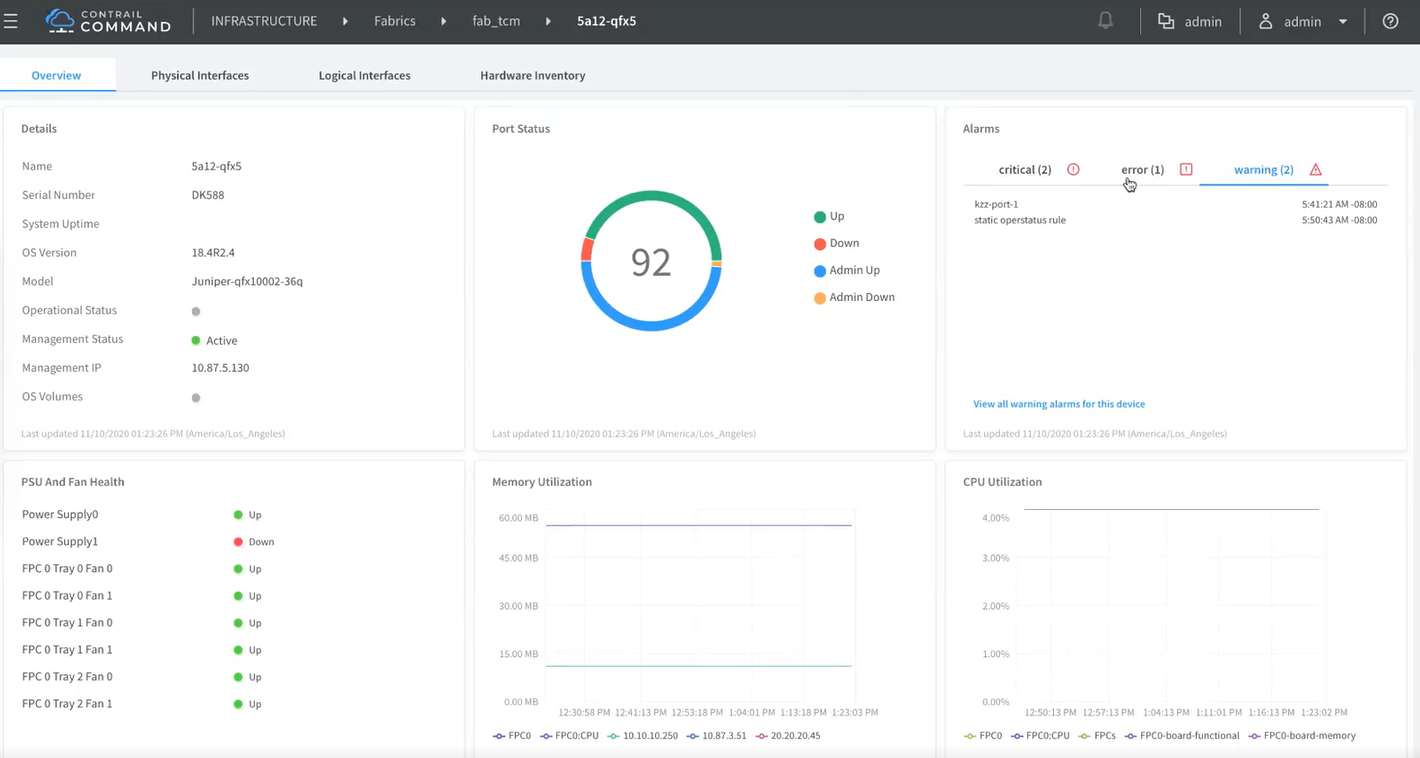
This returns you to the Fabric page and displays device and severity dependent on your choices. Click Open filters and select Reset to return the page to displaying all devices and alarms. See
In Ports Count, you can click a port name to see more detail. This launches the Port Overview page. Overview charts are drawn specifically for the port that you are viewing. To return to full view of all ports, click the Open filters icon and select Reset.
Configure and Assign Telemetry Profiles from Fabric Overview
When there are no telemetry metrics configured and assigned to applicable fabric devices, you can accomplish this from the Fabric Overview page. For more information about telemetry profiles, see Contrail Insights Flows in Contrail Command.
