Accessing the Juniper ATP Appliance Central Manager Web UI
To access the Juniper ATP Appliance Central Manager (CM) Web UI, use HTTP/HTTPS and enter the configured Juniper ATP Appliance CM IP address or hostname in a web browser address field, then accept the SSL certificate when prompted. Login is required
To Log in to the Central Manager Web UI
Web UI Navigation Tabs
Dashboards: Review malware summaries, lateral progressions and trends
Incidents: View detected incidents and their behaviors
File Uploads: Submit files for malware analysis
Mitigation: Perform immediate threat verification & mitigation actions
Reports: Configure & view malware activity and audits
Custom Rules: Create and Manage custom security rules
Configuration: Config and modify Juniper ATP Appliance Settings
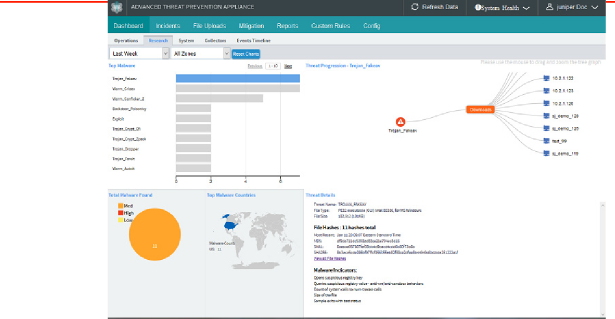
The Juniper ATP Appliance CM Dashboard views (Operations | Research | System | Collectors [Web | Email]) provide in-context and aggregated malware detection information as well as system status and health statistics.
The Juniper ATP Appliance CM Dashboard provides in-context and aggregated malware detection information for web and email traffic as well as system status and health information. Additional configurations are made from the Configuration tab. Refer to the Juniper ATP Appliance Operator’s Guide or online help for more information. Use the Config tab to verify that the new Collector is calling the Central Manager (CM) Web UI, and is online and actively inspecting and collecting traffic.