Appendix: Day-2 Operate
Switch Information Page
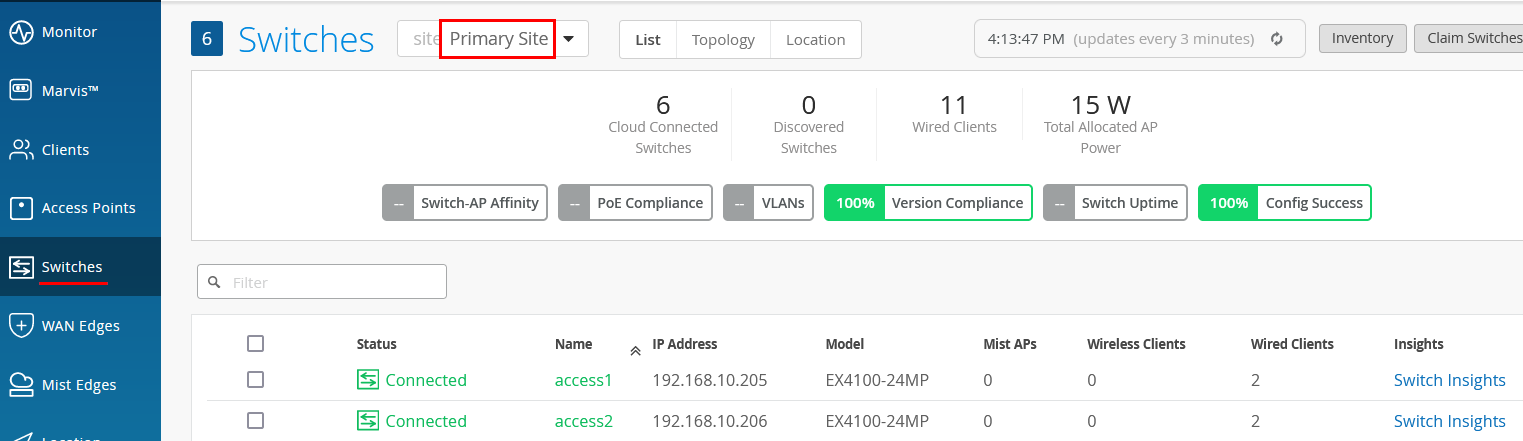
To get to the basic switch monitoring page, click Switches, select a site, and then click on the device itself similar to what is shown below:
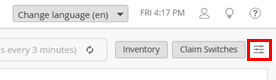
Not obvious but very useful is this hamburger-button at the right side which allows you to modify what is displayed on this page:
A typical example of adding displayed items is shown below:
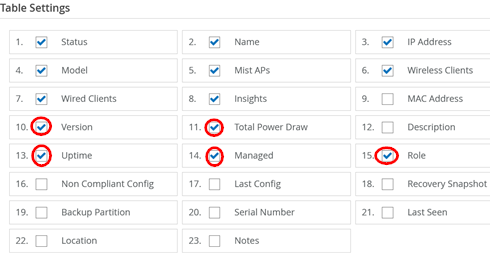
Resulting in this new view:

Going further, click on the switch name you want to inspect
(here, we select “access1”). At the top of
the device information page, you see a graphical front view of the
device, its ports and some baseline status information.
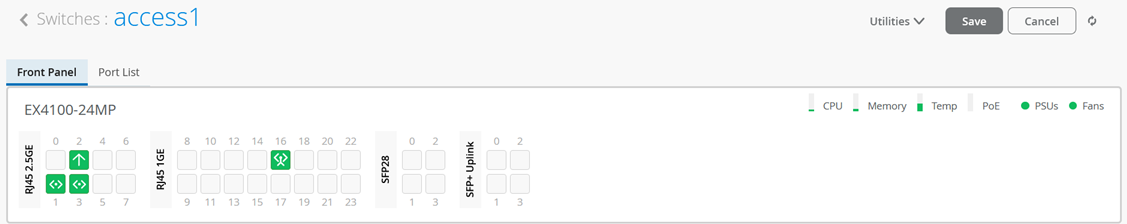
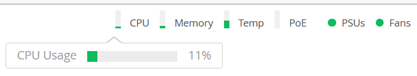
Hover your mouse over each status icon for CPU, Memory, Temperature, PoE, PSUs and Fans to see the current status for each category.
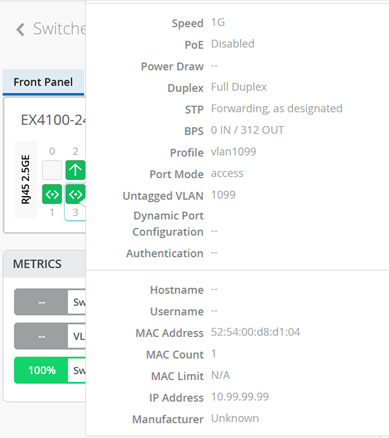
Next, hover your mouse over some of the ports of the device to review what is configured and detected there. In our example, you also see at the bottom that our lab switch has a wired client (a test VM) that is attached to the port.
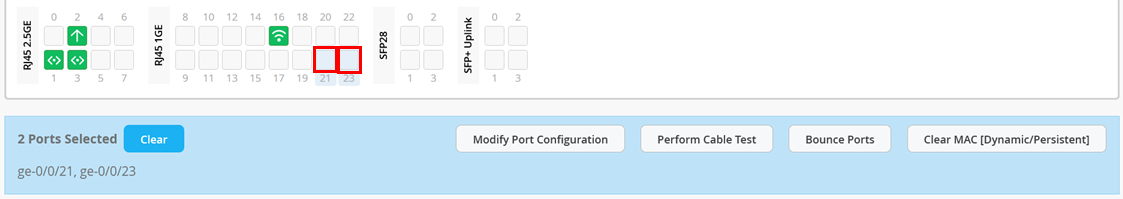
Clicking on one or more ports gives you access to the commands shown below:
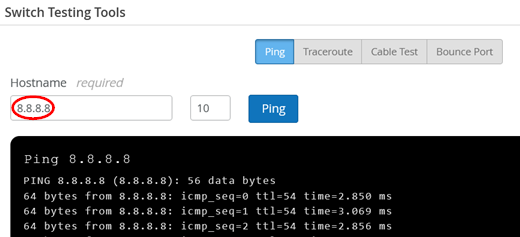
Then, select the Utilities tab available for the device and click on Testing Tools to see what tests are available to run.
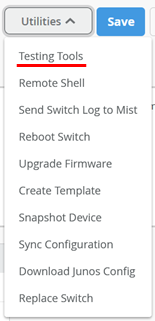
The testing tools allow you to issue ICMP pings, traceroutes and to bounce a port, for example:
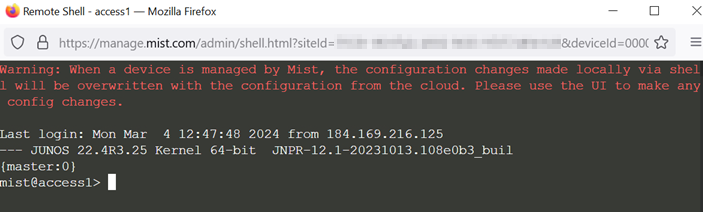
Besides the testing tools, one of the most useful utilities is the ability to open a direct SSH shell to the device just by clicking a button.
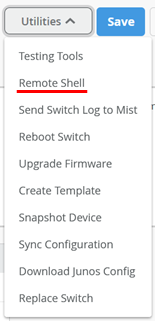
This will open a new window with the ability to run CLI commands on the device remotely.
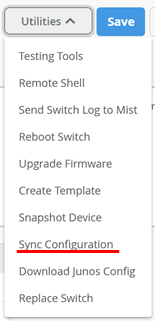
A new option is Sync Configuration which will immediately push a synced configuration to the device based on what is configured on the Juniper Mist portal (and reviewable using the Download Junos Config option). Consider this option when:
- You made use of the additional CLI commands option and want to revoke previously made configurations without “delete” commands.
- Somebody made a local change on the device without proper configuration through the Juniper Mist portal and you want to remove these changes.
- There was a prior configuration push that failed, and you want to try again.
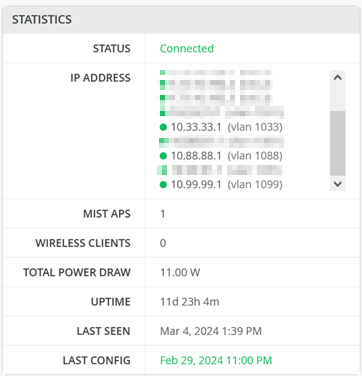
Back on the device information page, review the Statistics pane for information.
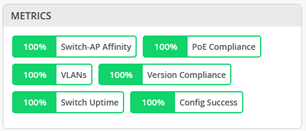
Also review the Metrics pane to confirm all is well.
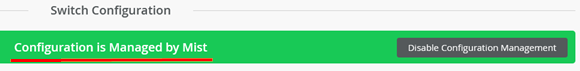
Then, review the configuration for the device. Usually, it should be inherited by the templates or profiles you used. However, if you need to, you can make individual changes to the configuration to be pushed to the device. Ensure that your switch is managed by Mist now:
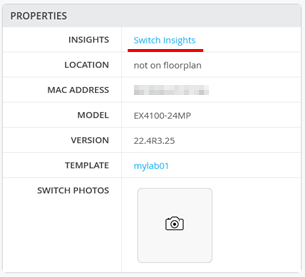
Finally, review the Properties pane for information and then click on Switch Insights for the next level of information about this device:
Switch Insights Page
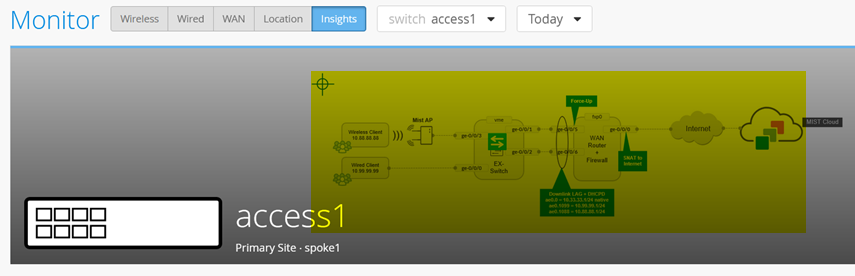
At the top of the Switch Insights page, you should see your switch.
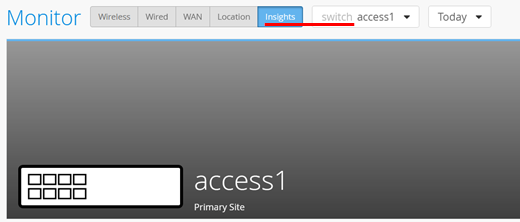
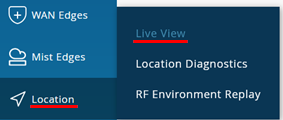
In our example, you do not see the location of the access switch, hence the dark background. Optionally, you can add this information using a location configuration as shown below. Go to Location > Live View:
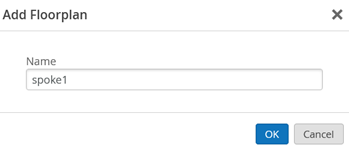
Add a new floorplan:
Upload the picture of your topology:
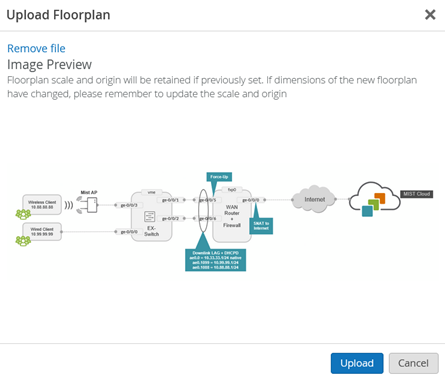
Click on Setup Floorplan:
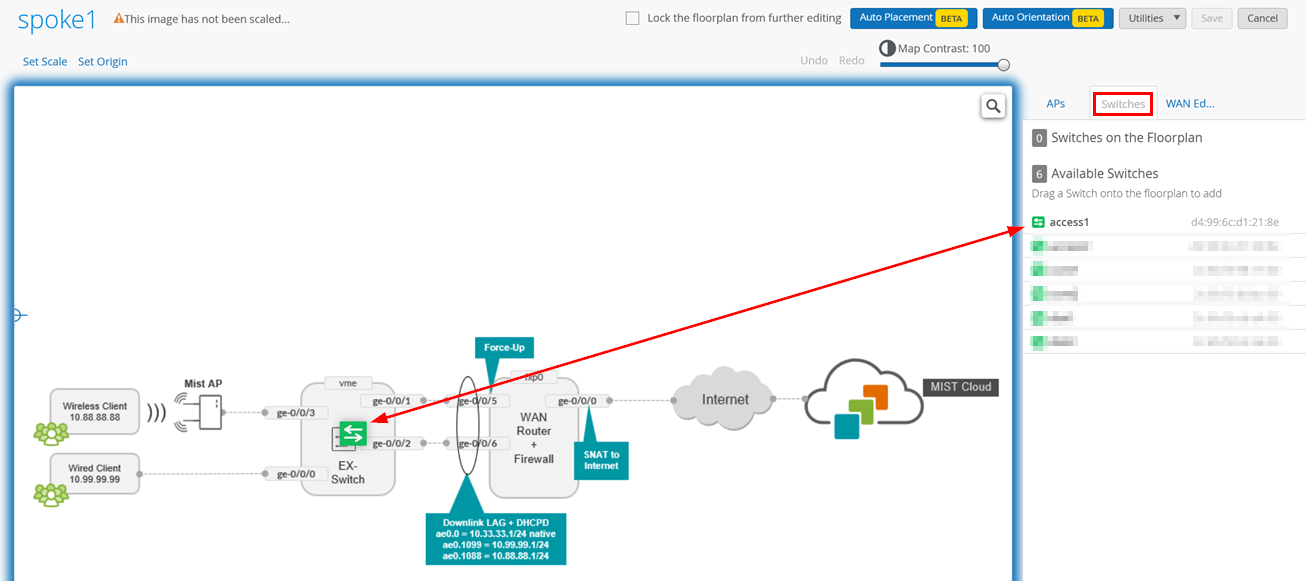
Select Switches and drag the switch itself to the position on the topology/floorplan:
Click Save and return to the Switch Insights page to see the topology:
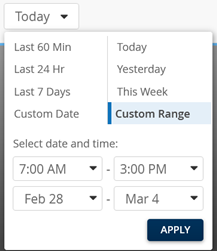
On the Switch Insights page, at the top of the page, you can see the time range for the information you want to see (the default is “Today”). Below, you can see how you can modify that range:
Below the device, you can see events over time (and the traffic through the device at that time). With your mouse cursor, you can select an event to review which will then automatically be selected in the events reports below:
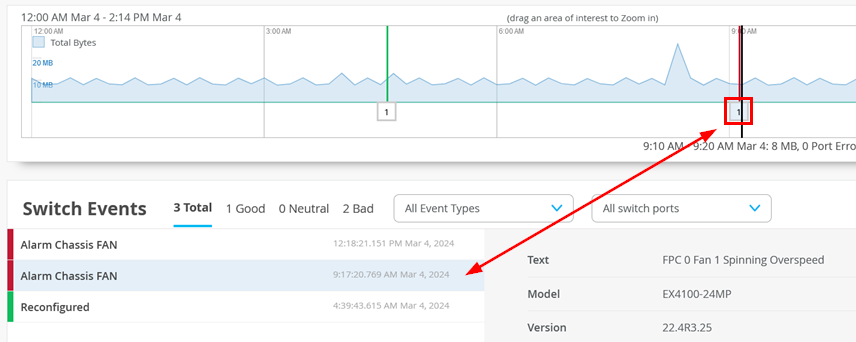
You can also zoom in by left-clicking with the mouse and dragging to select an area in the timeline (make sure it’s not too short).
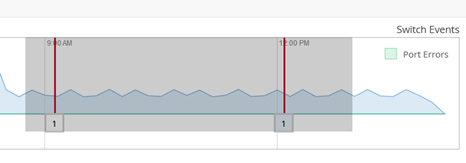
To then get to a more detailed view of the time range, selected before:
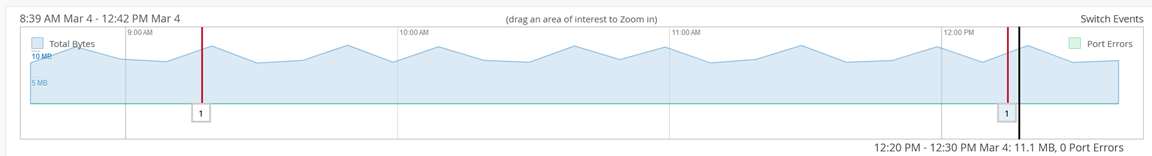
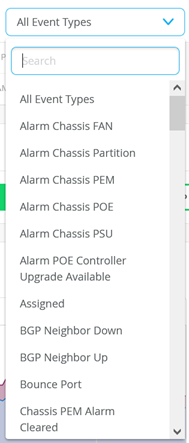
Then, review the Switch Events pane:
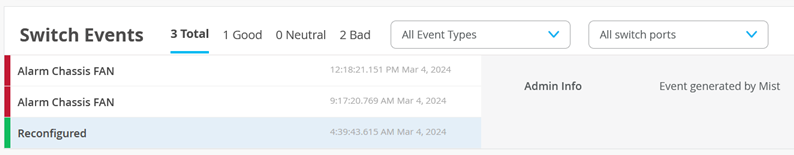
You can limit the events displayed by selecting specific events as shown below:
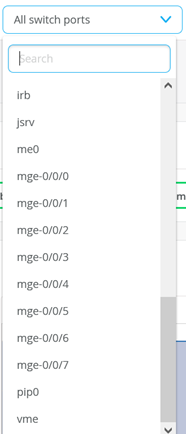
You can limit the events displayed by selecting specific ports as shown below:
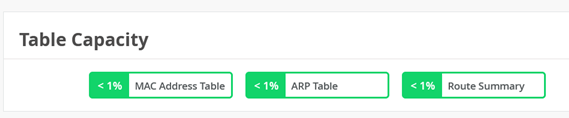
Another item you can review is Table Capacity like the example shown below:
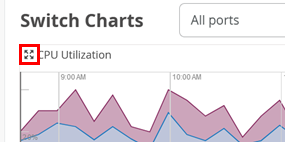
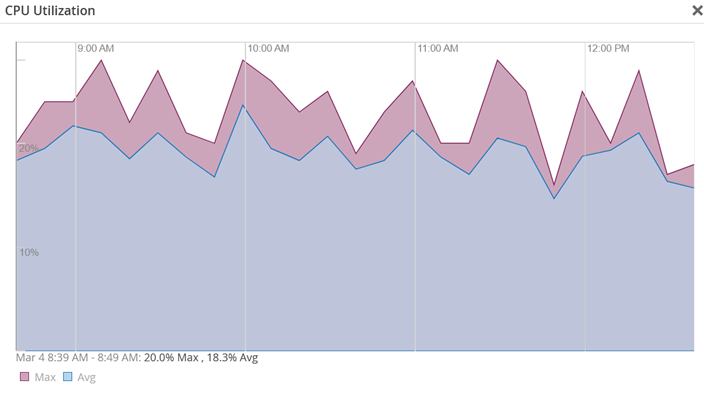
Next, is the Switch Charts pane with the following five charts:
- CPU Utilization
- Memory Utilization
- RX+TX Bytes
- Port Errors
- Power Draw
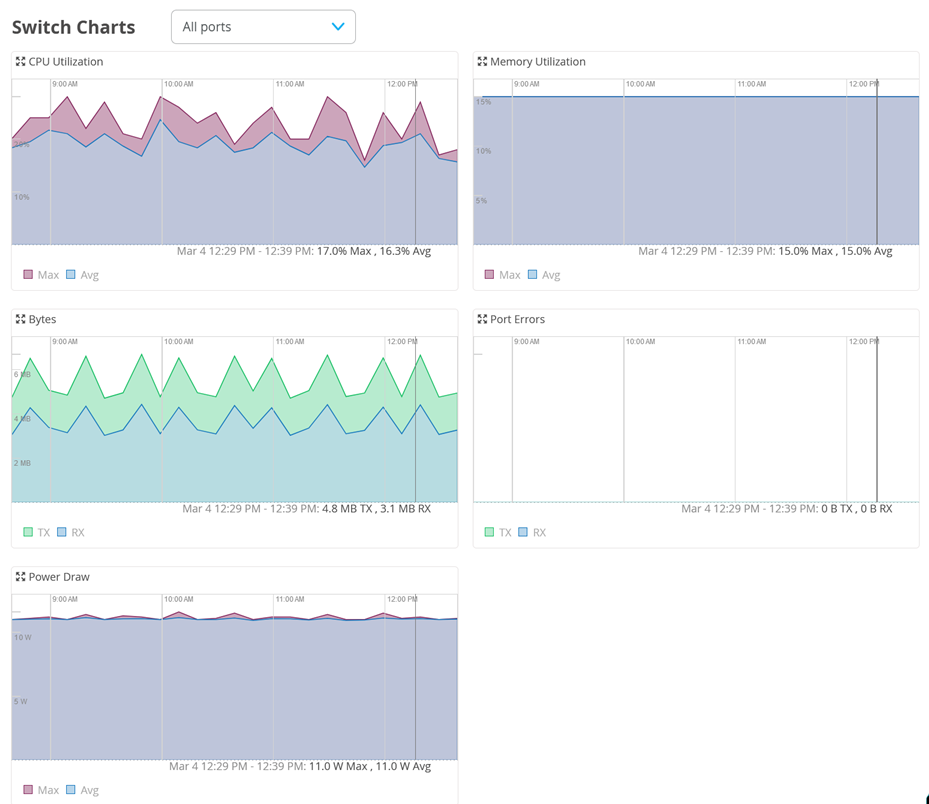
You can expand the chart by clicking on the symbol marked below:
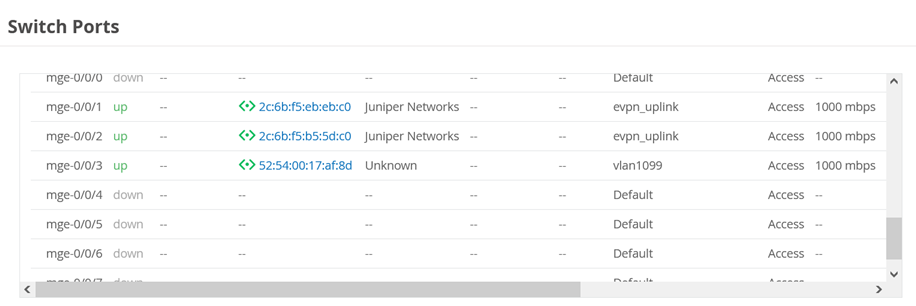
You can then review the switch ports again to figure out what is attached to each:
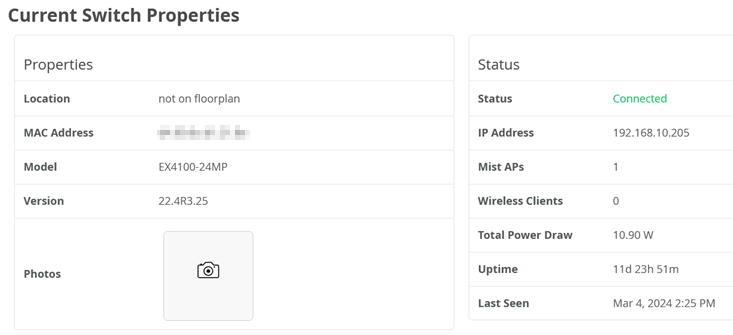
Then, the last pane on this page is Current Switch Properties:
Wired SLE Monitor Page
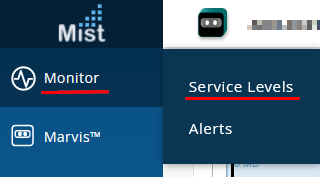
The next level of information involves Switch SLE monitoring. To review those, click Monitor > Service Levels.
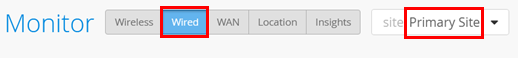
Then, select a site for inspection and select Wired.
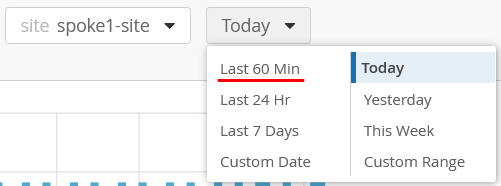
Be aware that all Wired SLE metrics are about monitoring a device for a longer period of time. They may not display much after you’ve just onboarded a device as not much data has been collected yet. In a production environment, expect to need to collect a full week of data from the device. You can try to change the period to “Last 60 min”, but it may not present much information.
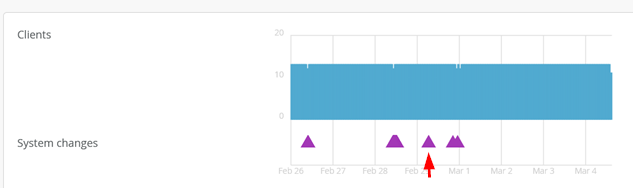
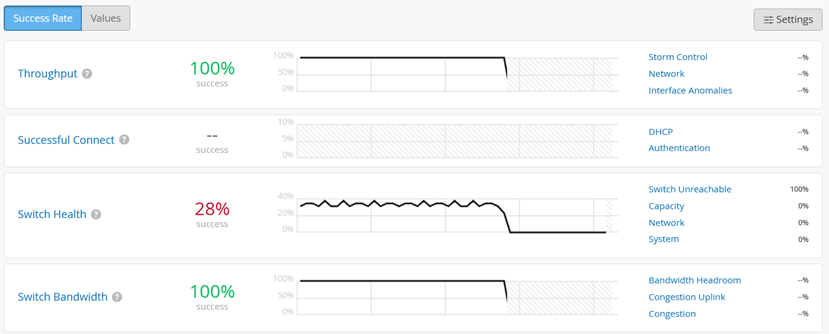
The first pane gives you a relationship between the number of connected clients within that time range and the system events that occurred. A purple triangle denotes when something changed. Also, familiarize yourself with the ability to see what is reported in the lower-right corner of the pane.
Currently, there are three Wired SLE measurements displayed with different classifiers together for each SLE:
- Throughput SLE
- Successful Connect SLE
- Switch Health SLE
- Switch Bandwidth
It is critical to understand that the metrics and reports for each SLE are based on Mist AI utilizing a tensor flow network. This means:
As with all AIs, Mist AI requires large amounts of data about your network to provide useful analysis. We recommend waiting a week after the switch has been installed and traffic has been running though it before inspecting this information.
Unlike traditional monitoring tools that simply display charts and leave interpretation to the user, Juniper Mist uses AI to assess the overall health of the network and highlights only items that may be at risk. Therefore, if no reports are shown, it indicates that everything is functioning normally and no further review is needed.
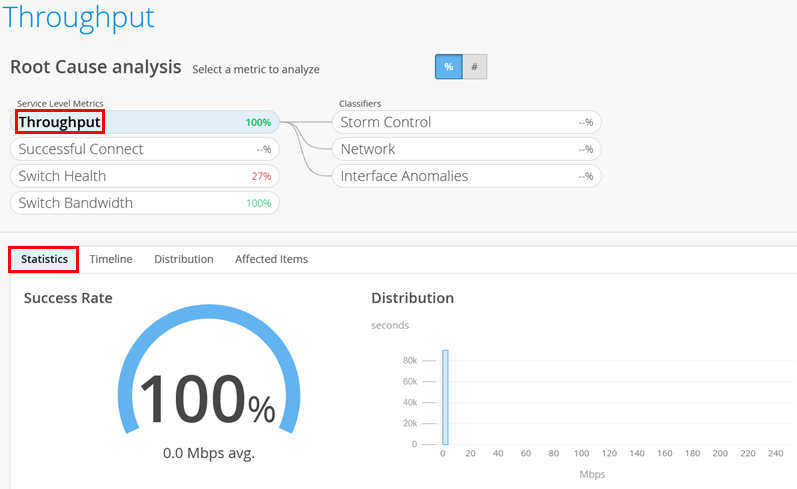
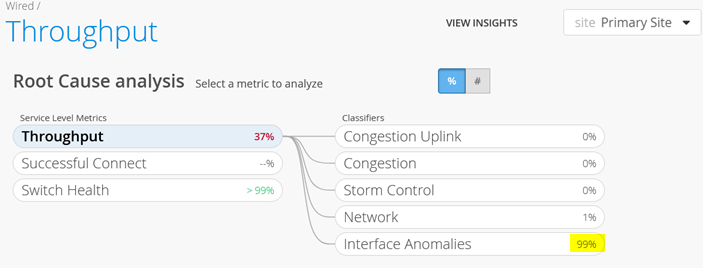
Let’s focus on the reports you can get through each SLE now. The SLE for throughput with accompanying classifiers:
- Storm Control
- Network with sub-classifiers:
- Latency
- Jitter
- Interface Anomalies with sub-classifiers:
- Cable Issues
- MTU Mismatch
- Negotiation Failed
It is best practice to start inspecting the SLE through the Statistics tab first:
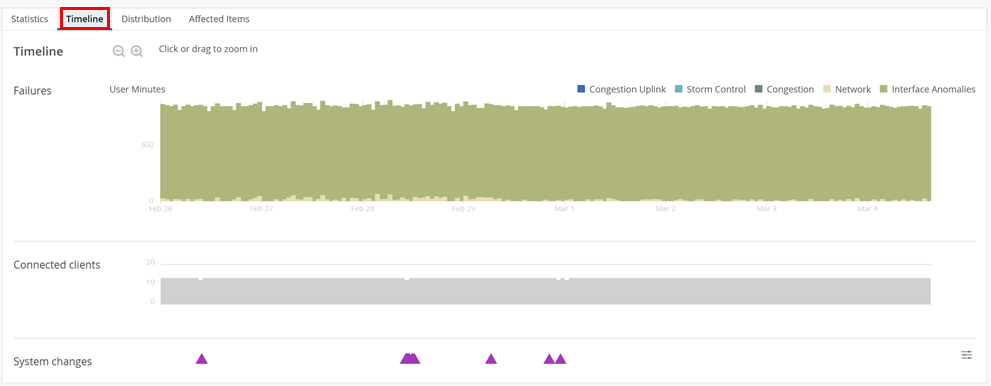
You may select the next tab named Timeline, if needed.
Then, you should review the next classifier, drilling deeper into the issue. In the example below, we select the classifier having the most impact:
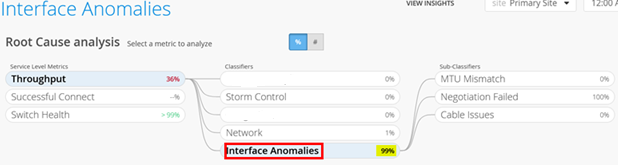
As this SLE classifier has sub-classifiers, we then select the sub-classifier with the most impact:
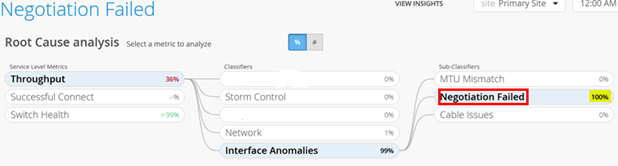
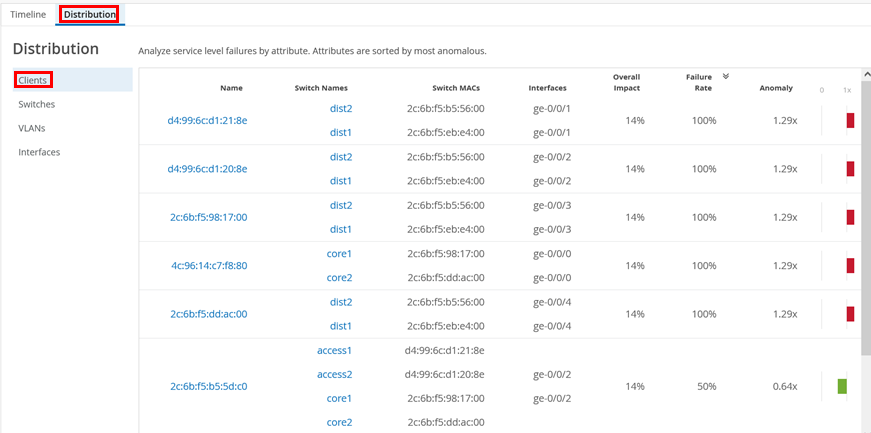
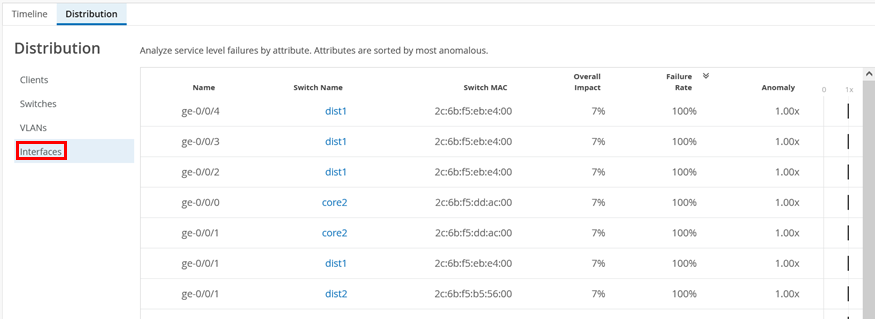
In this example, it’s best to inspect the Distribution tab next. Here, we start with Clients:
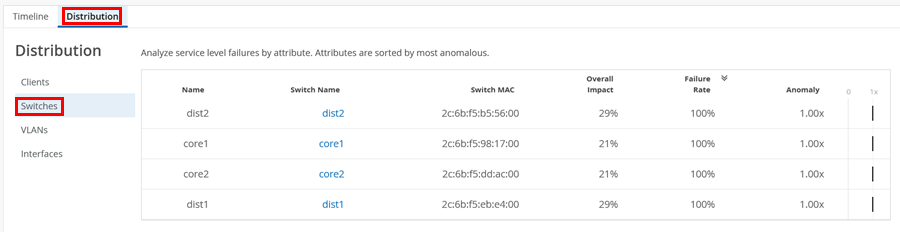
Below, we review the affected switches, for example:
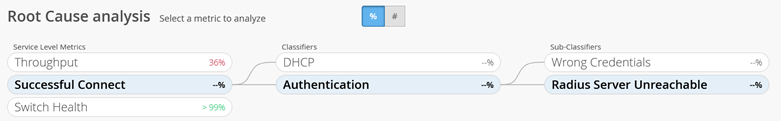
Next comes the Successful Connect SLE with its classifiers:
- DHCP
- Authentication with sub-classifiers:
- Wrong Credentials
- Radius Server Unreachable
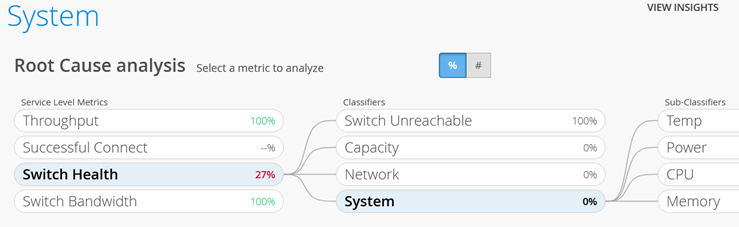
Next comes the Switch Health SLE with its classifiers:
- Switch Unreachable
- Capacity with sub-classifiers:
- Mac Address Table
- ARP Table
- Route Table
- Network with sub-classifiers:
- WAN Jitter
- WAN Latency
- System with sub-classifiers:
- Temp
- Power
- CPU
- Memory
Finally, the Switch Bandwidth SLE with its classifiers:
- Bandwidth Headroom
- Congestion Uplink
- Congestion
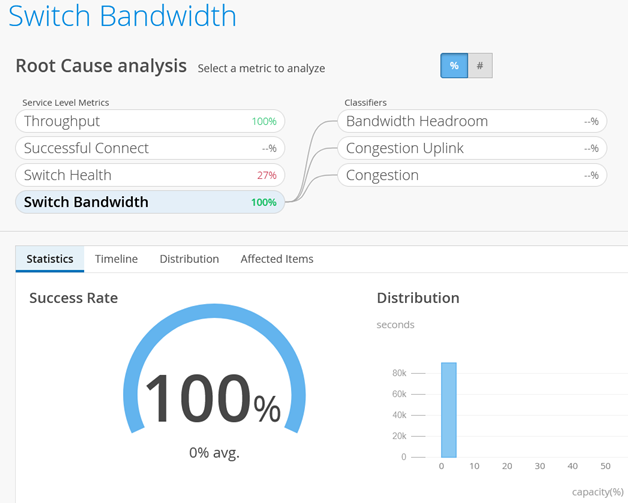
Reports on SLEs are only made visible if there is a concern and you need to review something. If you want charts on raw data without the benefit of an AI-based analysis, please visit the Switch Insights Page.
Alarms Page
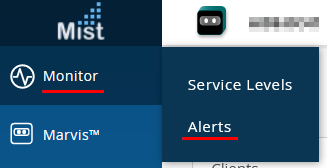
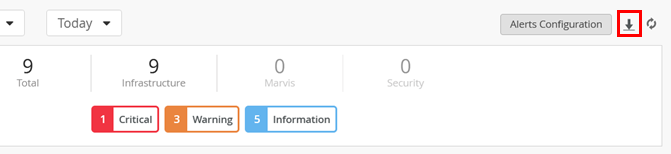
With this test case, we demonstrate the ability to see alarms for switches and optionally, to get those alarms sent as emails to the administrator. Go to Monitor > Alarms:
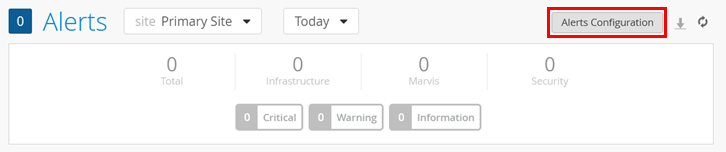
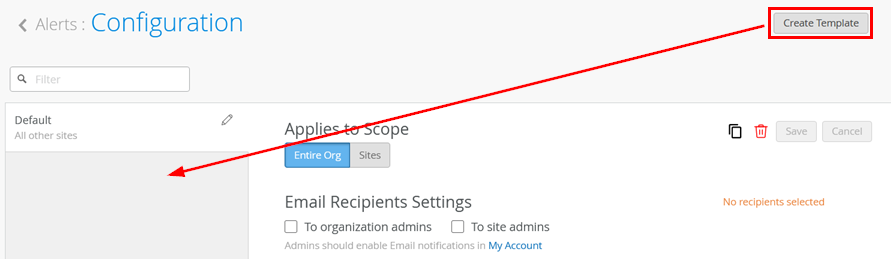
Review the current page and open the Alerts Configuration:
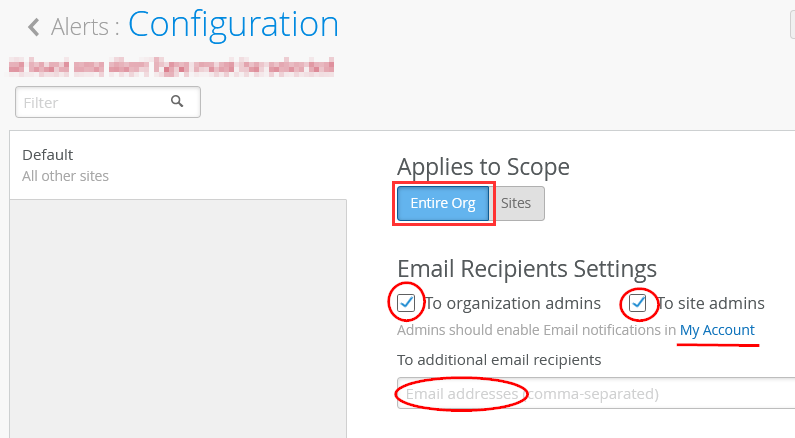
Under the configuration, keep the scope as the default
Entire Org, and email recipients as organization
and site admins. Then, you can optionally add your email address to
the “To additional email recipients” field
and click on the “My Account” link to
verify your own settings.
If you are an admin, the default setting is to not send you any emails so you must enable this now.
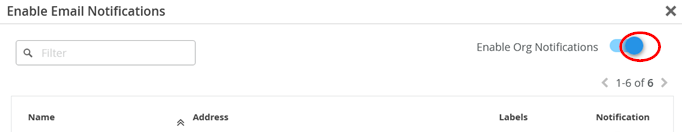
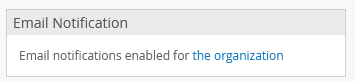
If you have followed the “My Account”
link above, you can now select enable under the
Email Notification section.

You can enable notifications on a site-by-site basis, but for now enable them for the entire organization as indicated below:
Your account email notification setting should now look like this:
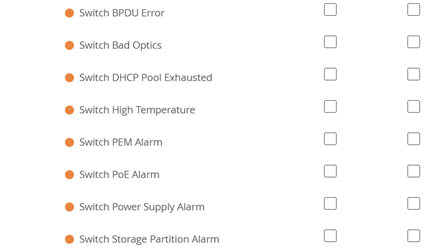
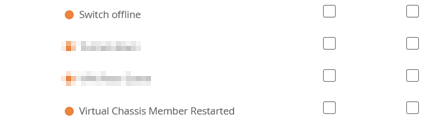
Now, enable the switch alerts and email notifications for infrastructure as the options below indicate:
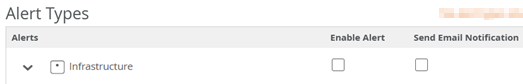
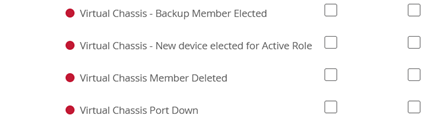

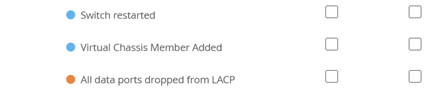


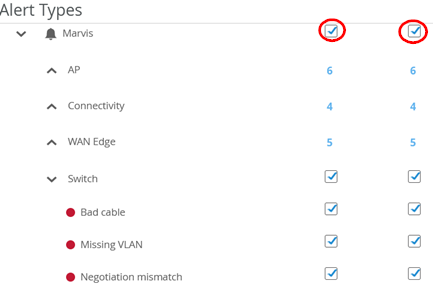
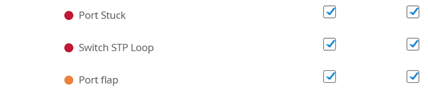
We recommend enabling the Marvis switch alerts and email notifications as well.
As an example, if you were to reboot a switch, you would receive the following email and others after a couple of minutes:
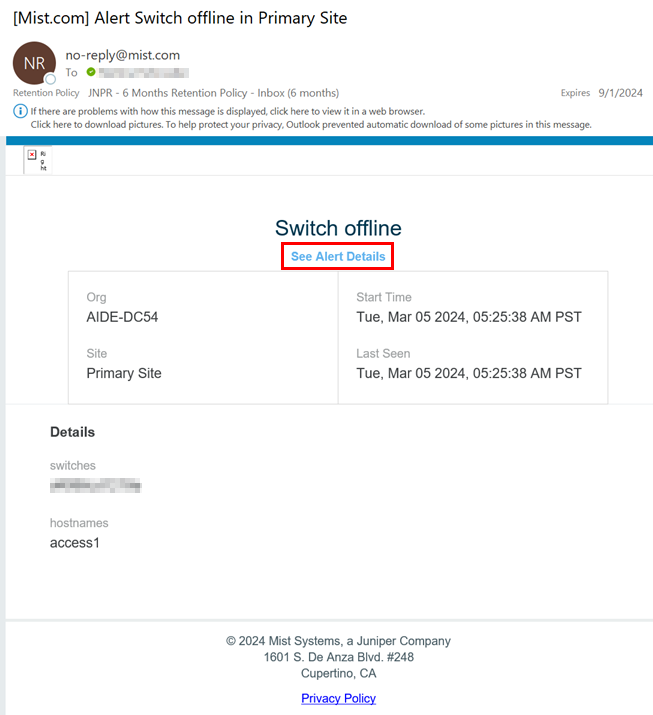
The link in the above image redirects you to the alarms page, which shows the event information similar to what is shown below:
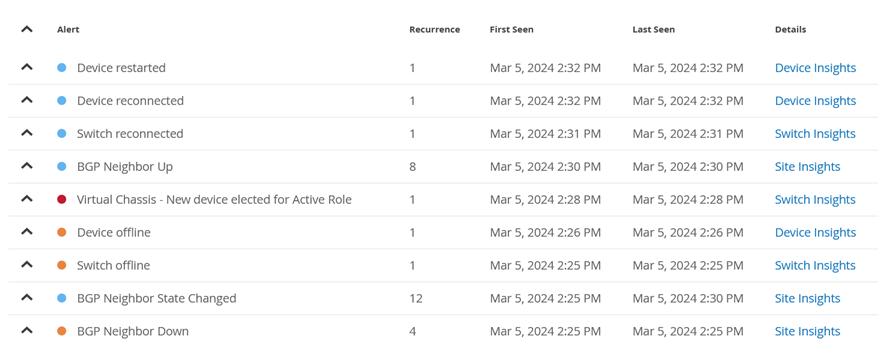
There is also a button to download the events as a CSV-based table:
Large organizations tend to use templates for alarms. Alarm templates allow for more granular assignments of alerts to the persons needing them based on the sites they manage or based on other needs.
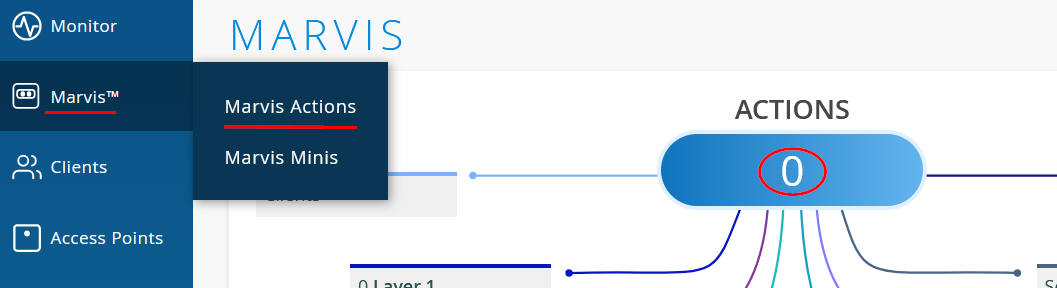
Marvis Actions
Marvis Actions is a feature of the Juniper Mist AI-driven operations platform that provides proactive and reactive troubleshooting capabilities. It leverages Mist AI to identify network issues, recommend actions, and provides insights into the root causes of these issues. The Marvis Actions dashboard displays high-impact network issues across wired, WAN, and wireless networks at different levels (MSP, organization, site). It allows users to track firmware compliance, detect WAN link outages, identify bad cables, and more. With real-time AI-driven insight, Marvis Actions enables proactive issue detection and resolution, reducing troubleshooting effort and time. More details to be found here https://www.mist.com/documentation/switch-actions/
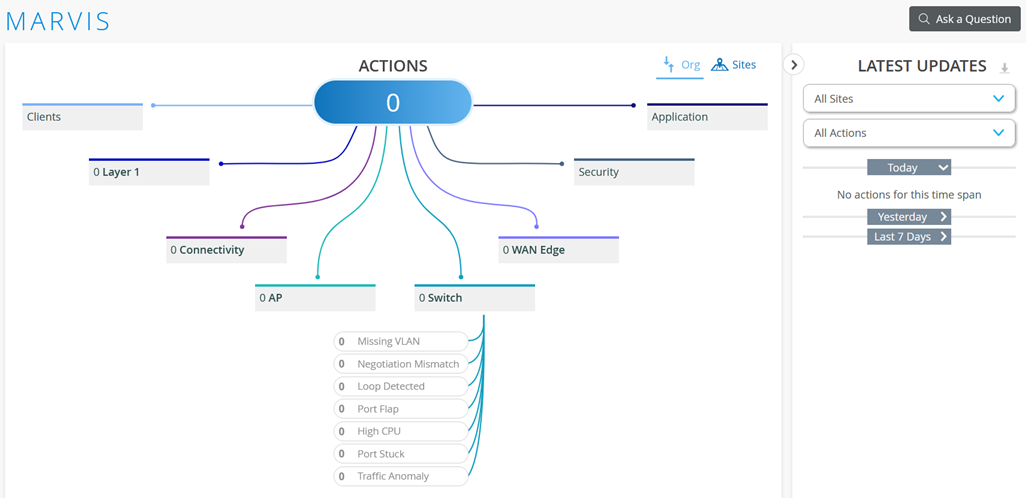
Marvis Actions are reachable by navigating to Marvis > Marvis Actions. Should there be any outstanding actions needed on the network, they will be identified here.
The Marvis Actions you may see with concerns to switch infrastructure are currently:
- Marvis Switch Actions
- Missing VLAN
- Negotiation Mismatch
- Loop Detected
- Port Flap
- High CPU
- Port Stuck
- Traffic Anomaly
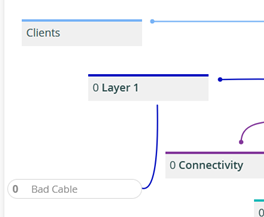
- Marvis Layer 1 Action
- Bad Cable
The Marvis “Missing VLAN” action is not triggered by the switch itself as with all others shown. It needs a Juniper AP to inspect the LLDP-Media information reported by the switch. This should contain all configured VLANs on the switch where the AP is attached. When a wireless client attaches to the AP, and the SSID the client connects to is configured for a particular VLAN, the AP checks if the switch has the same VLAN configured. If that is not the case, a Marvis action is triggered.
Marvis Conversational Assistant
Remember that the recommendation is to have traffic running for at least a week for the AI to be able to collect enough data for processing.
The Marvis Conversational Assistant is in the lower-right corner of your browser window.
After selecting the Marvis Conversational Assistant icon, the
window that appears allows you to enter questions and lists
predefined topics. Enter (or click as below) here
“Troubleshoot Site” to limit the search to
issues related only the current site.
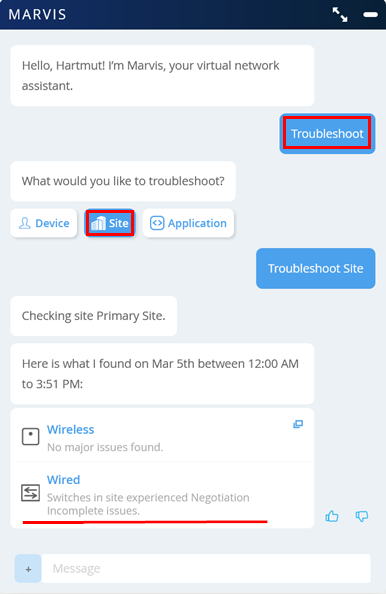
When clicking on Wired in our example, you can see the following report:
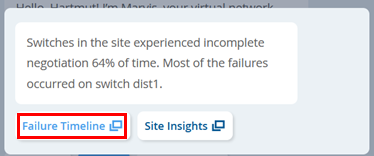
In this case, the link points to the Wired SLE Monitor page as shown in one of the chapters above.
Switch Firmware Upgrade
With Juniper Mist, you can now upgrade switches directly from the cloud.
Please refer to EX4400 – BIOS and Junos Upgrade Recommendations.
Preconditions
- Ensure stable SSH connectivity from switch to the cloud
- Ensure enough space on the switch (more details below)
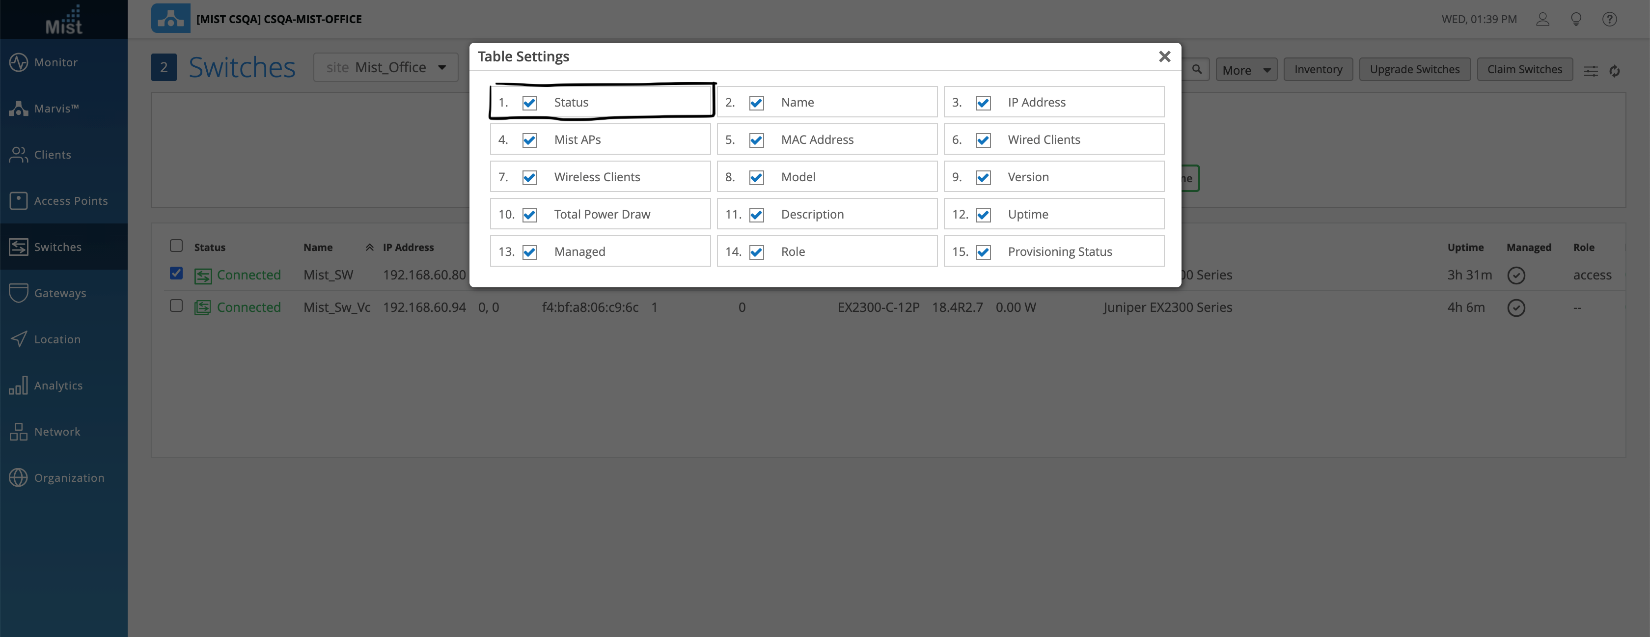
Enabling Status Column from the Menu
Make sure the status column is enabled to see the switch upgrade option.
The hamburger menu option is visible on top of the right side in the switch list view:
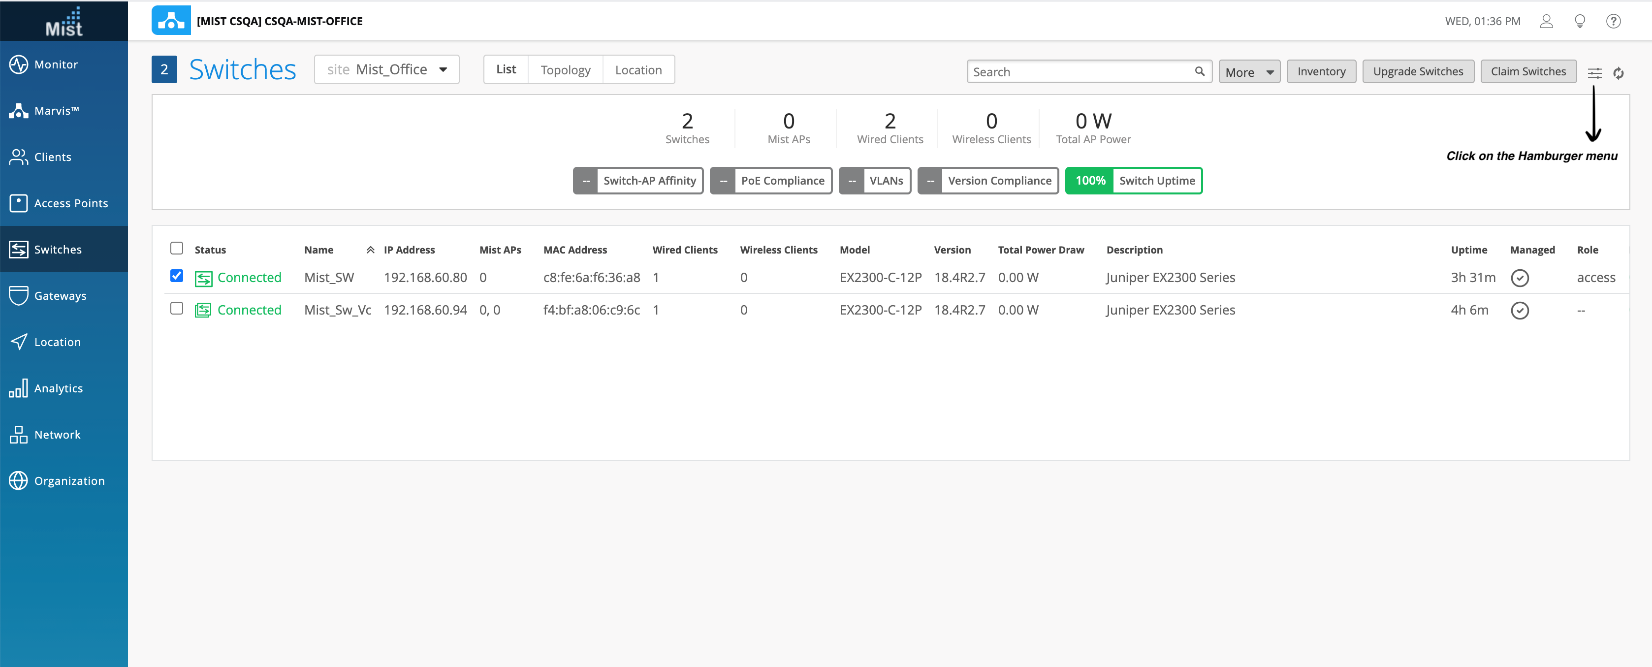
Ensure the status option is checked:
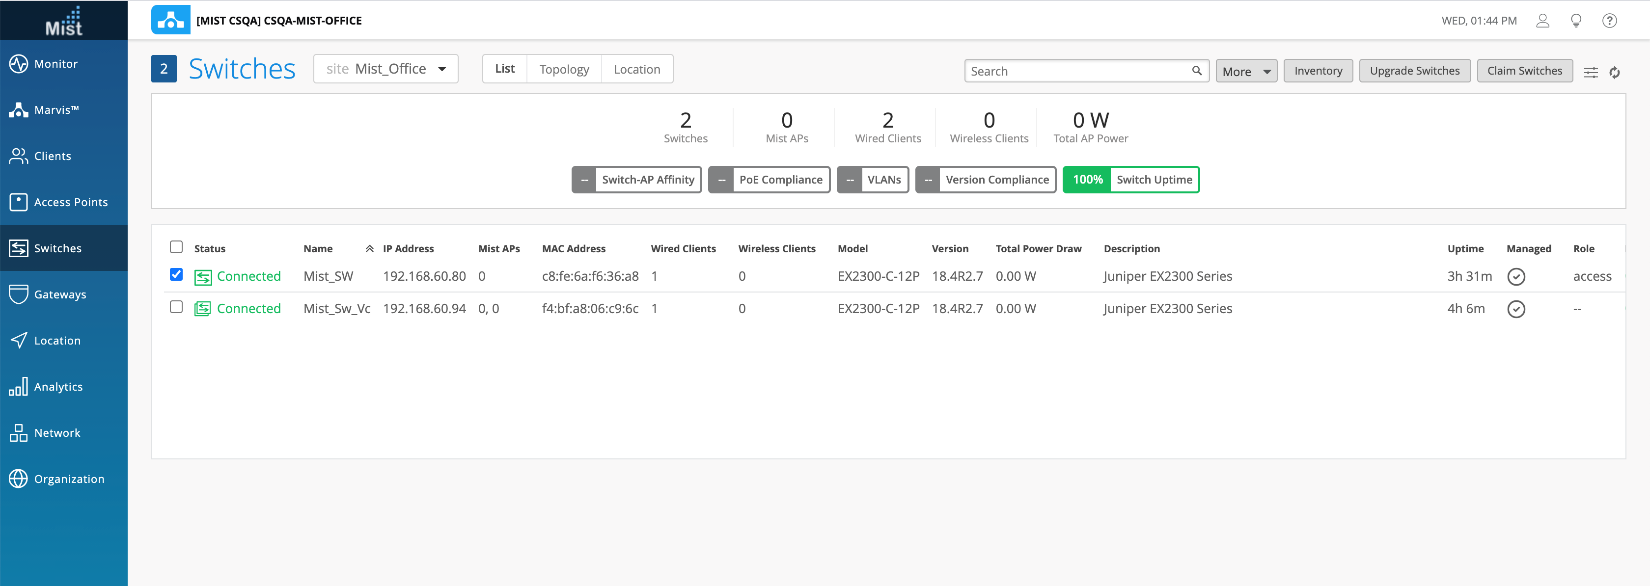
Steps to perform the switch upgrade:
- Select the switch to upgrade, and the Upgrade
Switches option will become visible in the upper-right
corner.
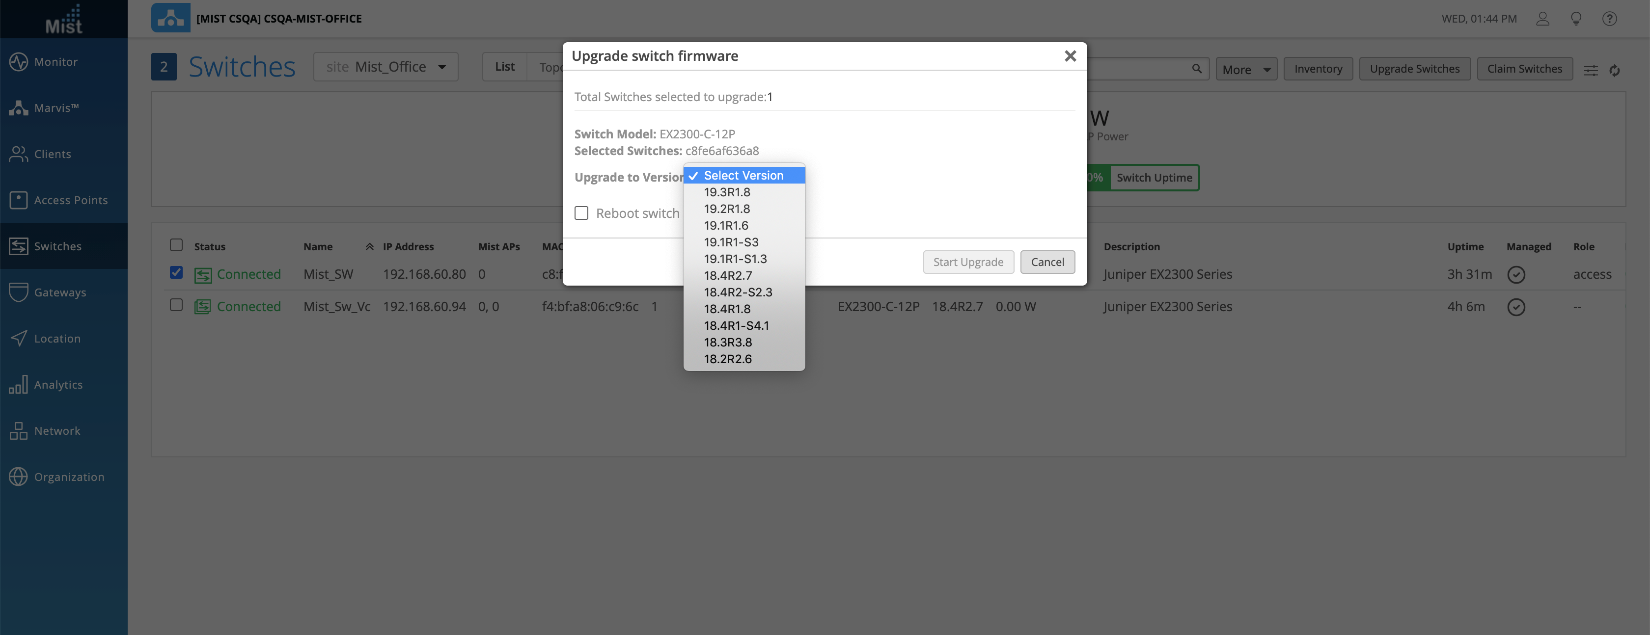
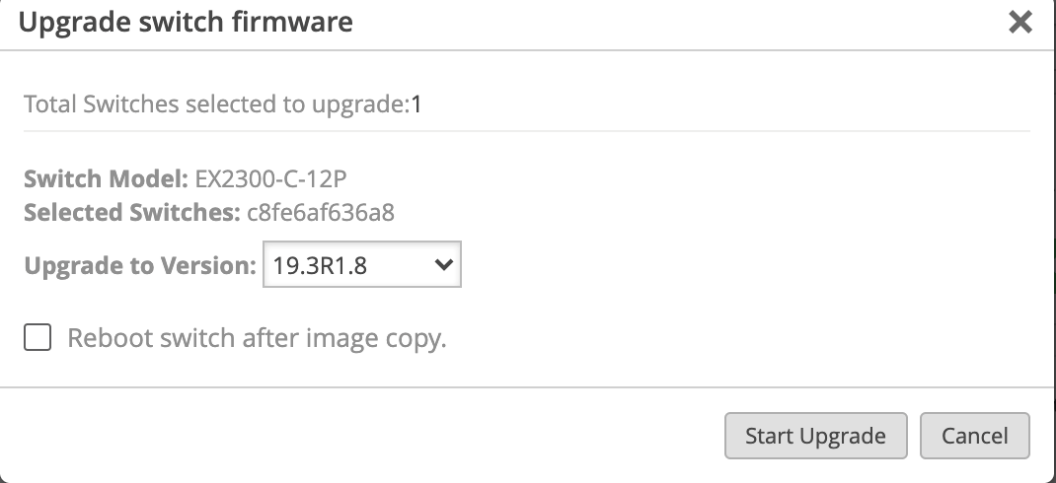
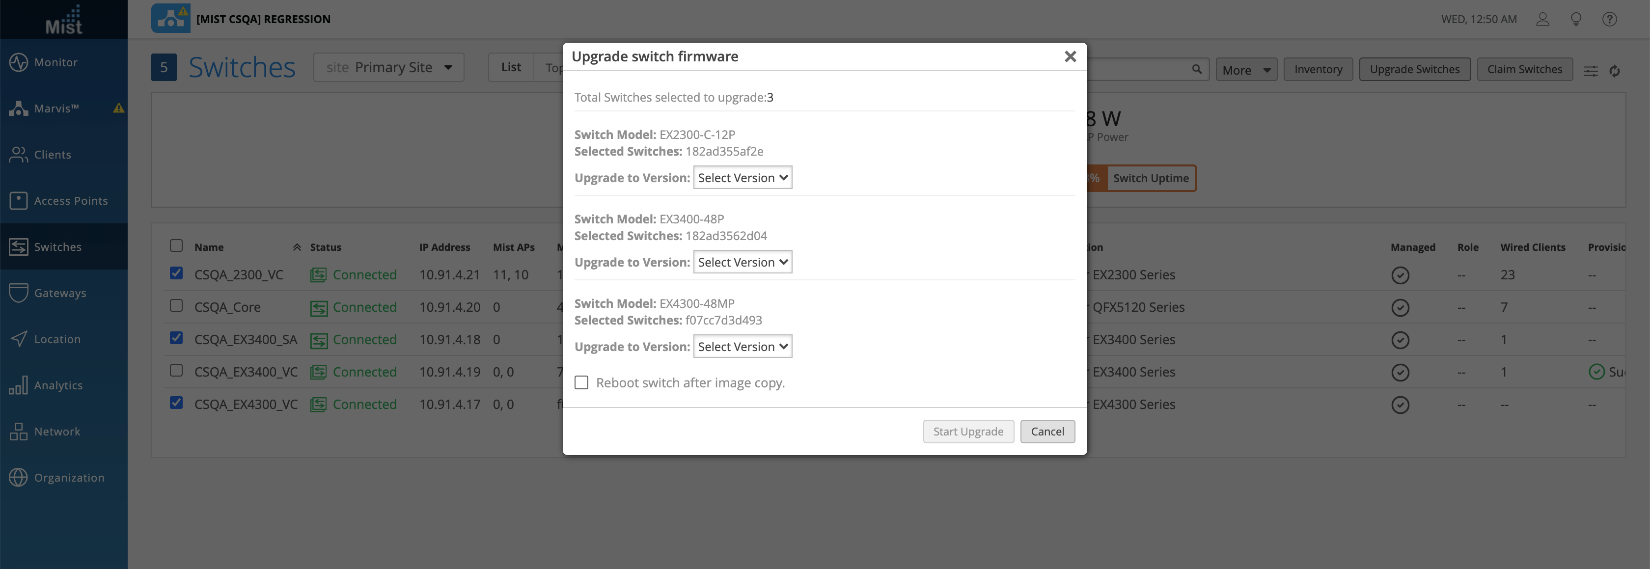
- Click Upgrade Switches > Upgrade switch
firmware and then select the firmware of choice.
- You are presented with two options:
- Reboot switch after image copy—By checking this box, the switch will automatically
reboot after the image copy procedure is completed so that the switch will boot up
with the new image.
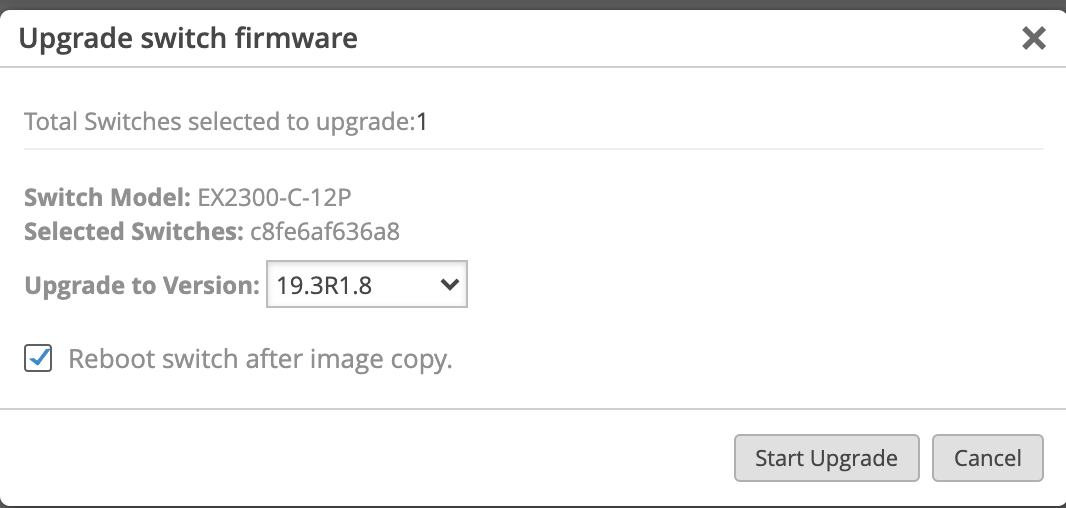
- If left unchecked—The image will be copied to the switch and will be in a state of
pending reboot. To complete the upgrade of the switch, select Utilities > Reboot
Switch when you are ready.
- The Upgrade Process:
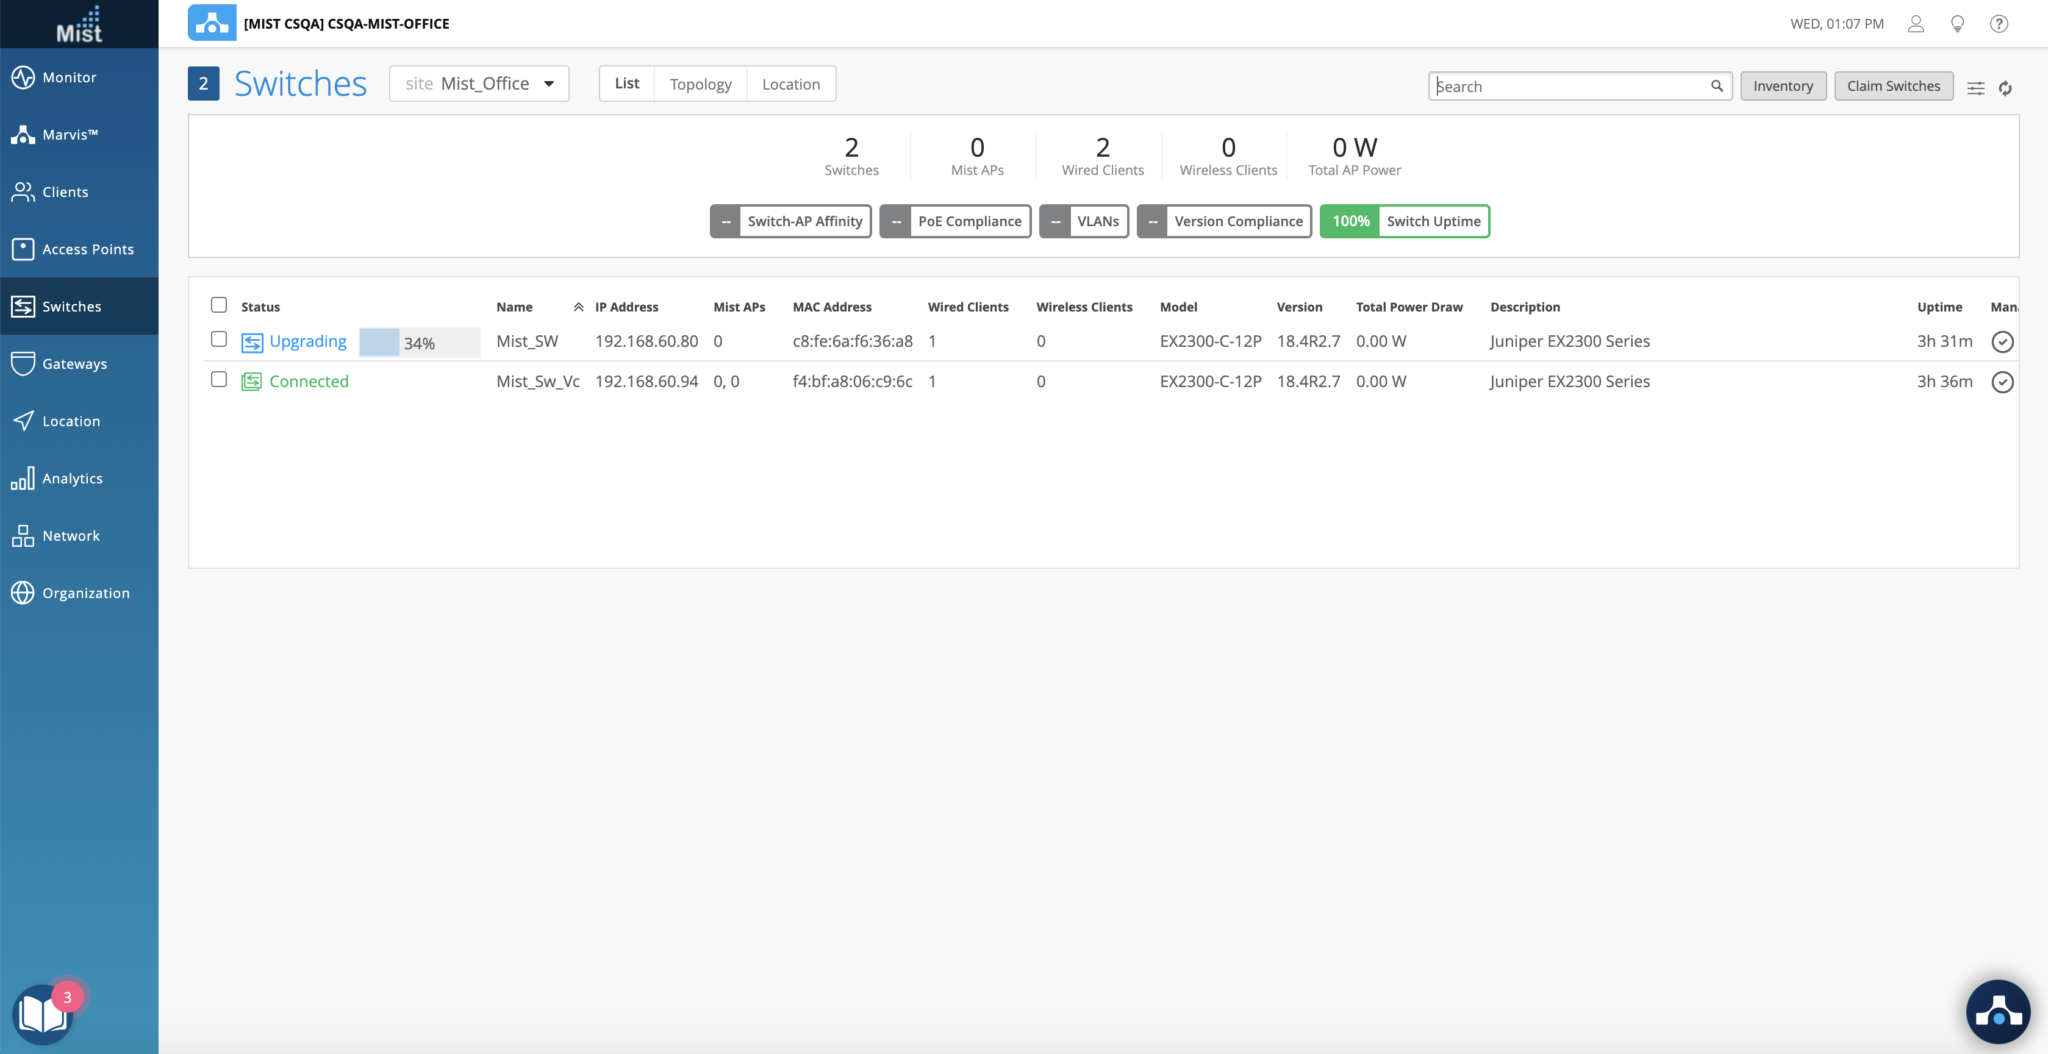
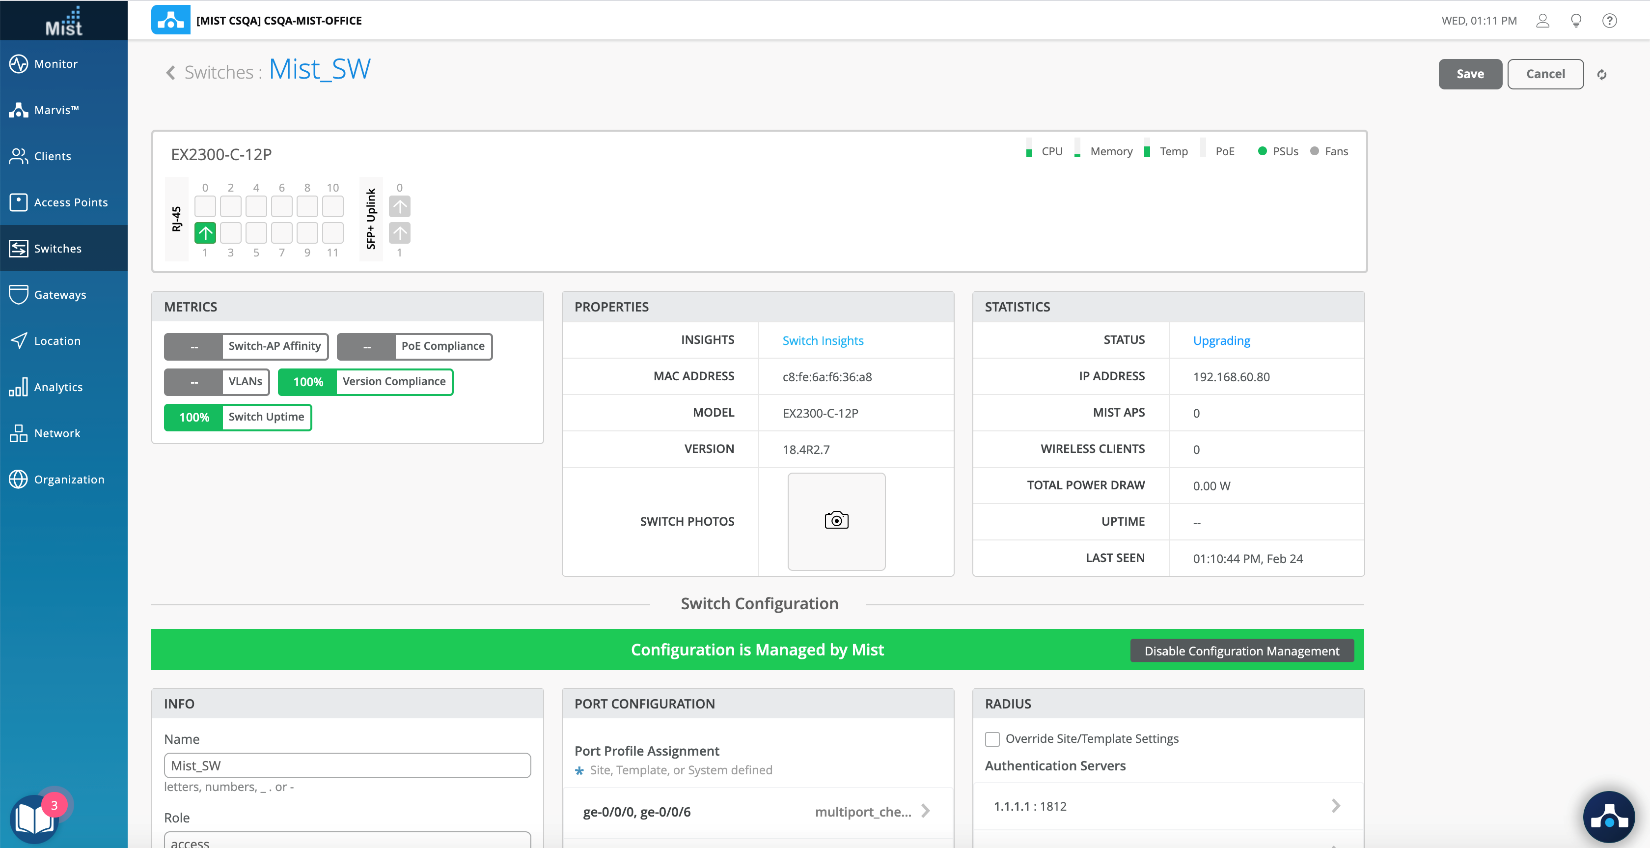
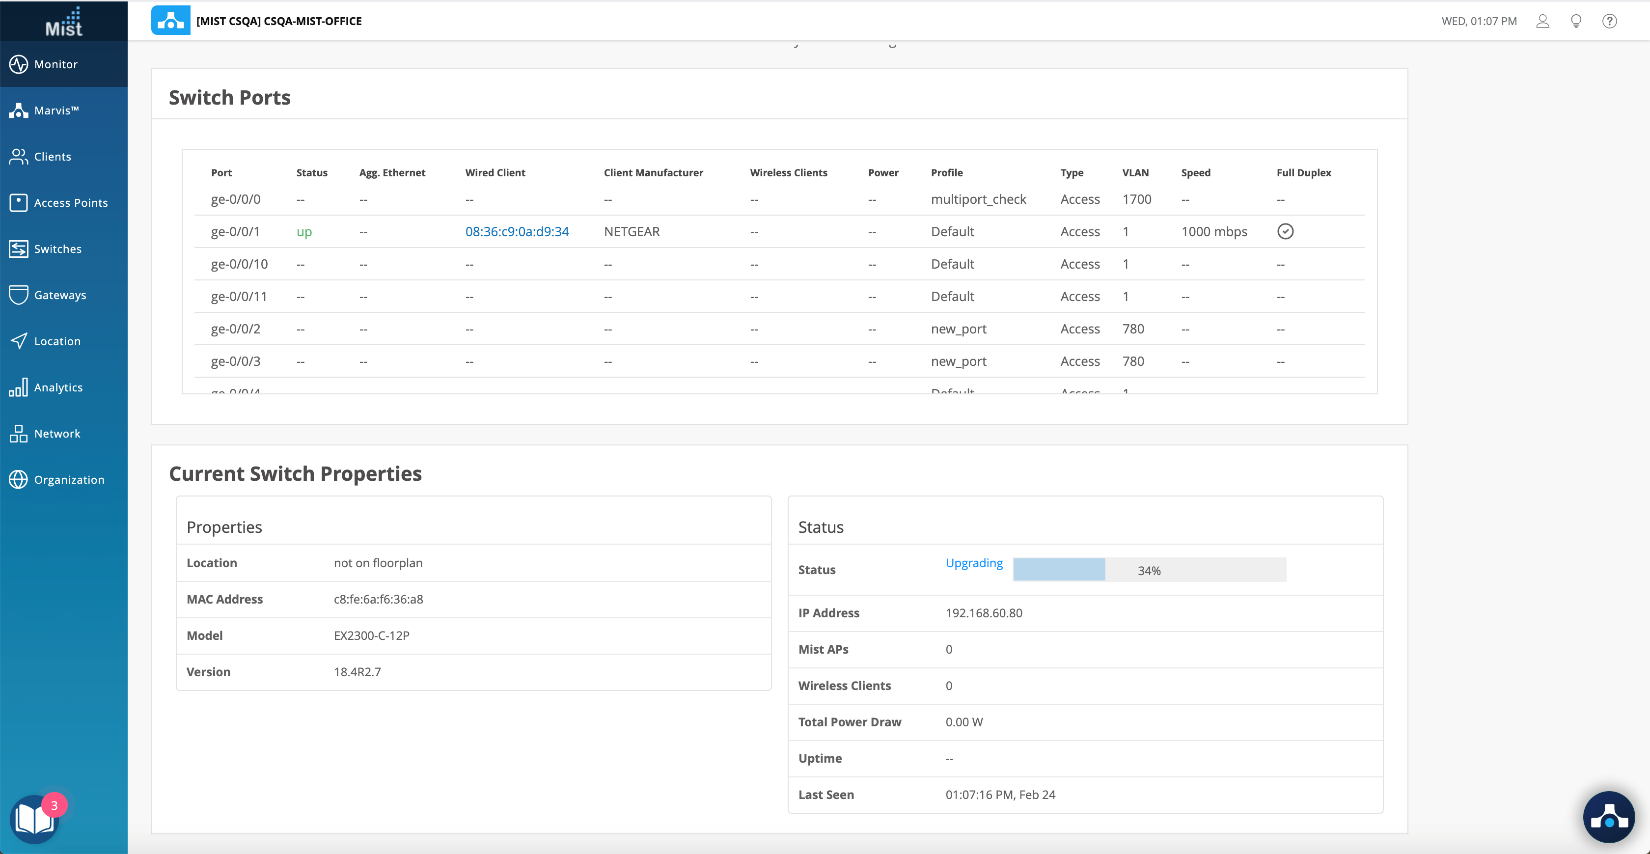
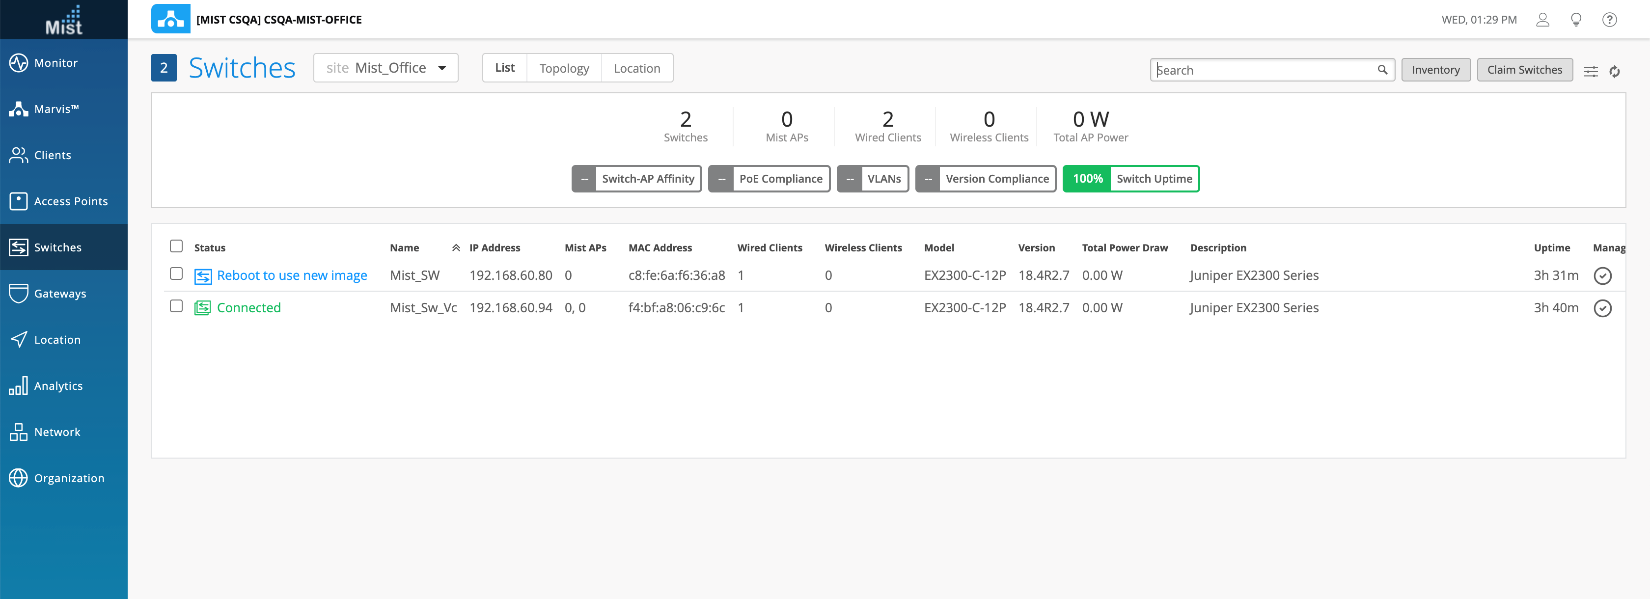
- Once the upgrade starts, the progress of the upgrade will be indicated in the switch list view, switch details view (will show as “Upgrading”) and from the Switch Insights view:
- Switch List View:
- Switch details view:
-
Switch Insights view:
- Reboot switch after image copy—By checking this box, the switch will automatically
reboot after the image copy procedure is completed so that the switch will boot up
with the new image.
- Once the copy process is complete, if the “Reboot after image copy” option was chosen, the switch will reboot automatically, and the switch upgrade will be complete.
- If the option “Reboot after image copy” was unchecked, the portal will indicate that the
switch needs to “Reboot to use new image”.
Upgrade Event
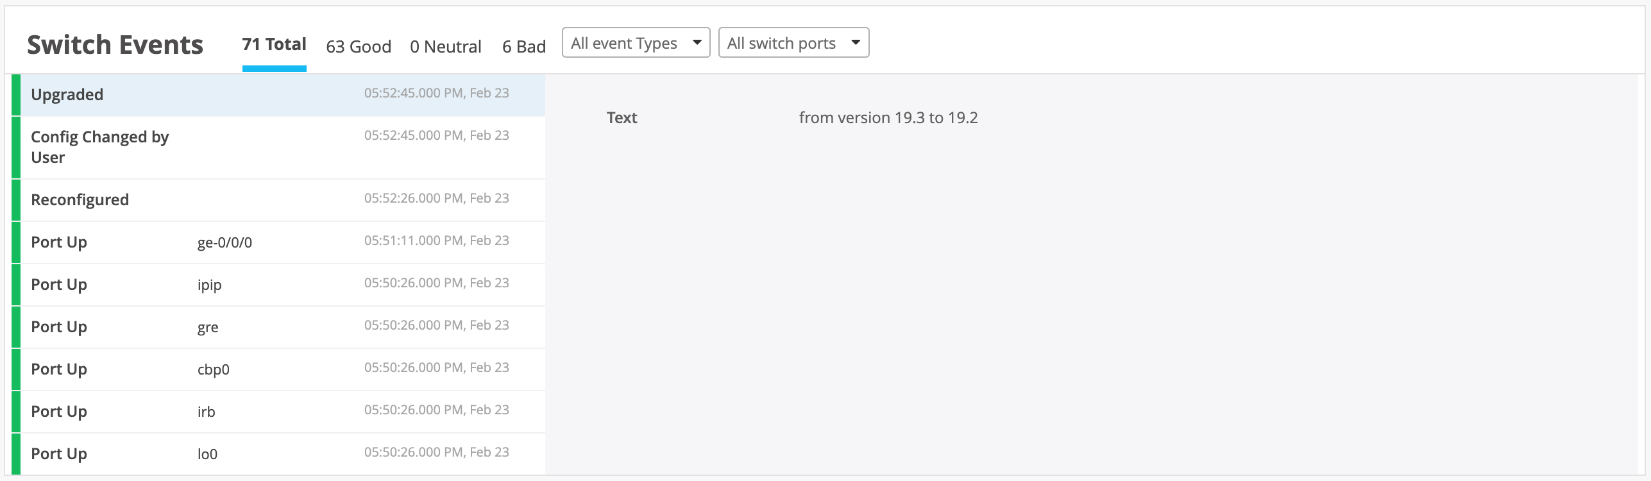
Upgrade events are visible on the portal. Clicking on Switch Insights will redirect to the switch upgrade events. The following events will appear when choosing Reboot after image copy:
- “
Upgraded by User” (Meaning the user has initiated the upgrade from the portal)
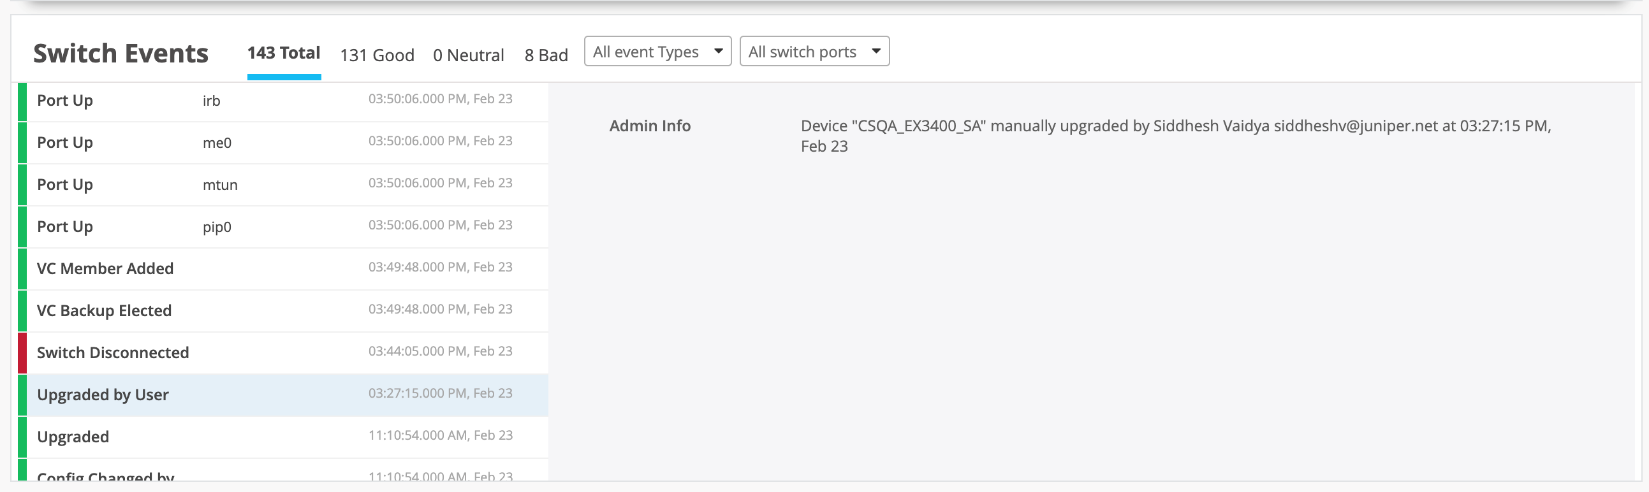
- “
Upgraded” (After the switch has rebooted and was upgraded to the image from the portal)
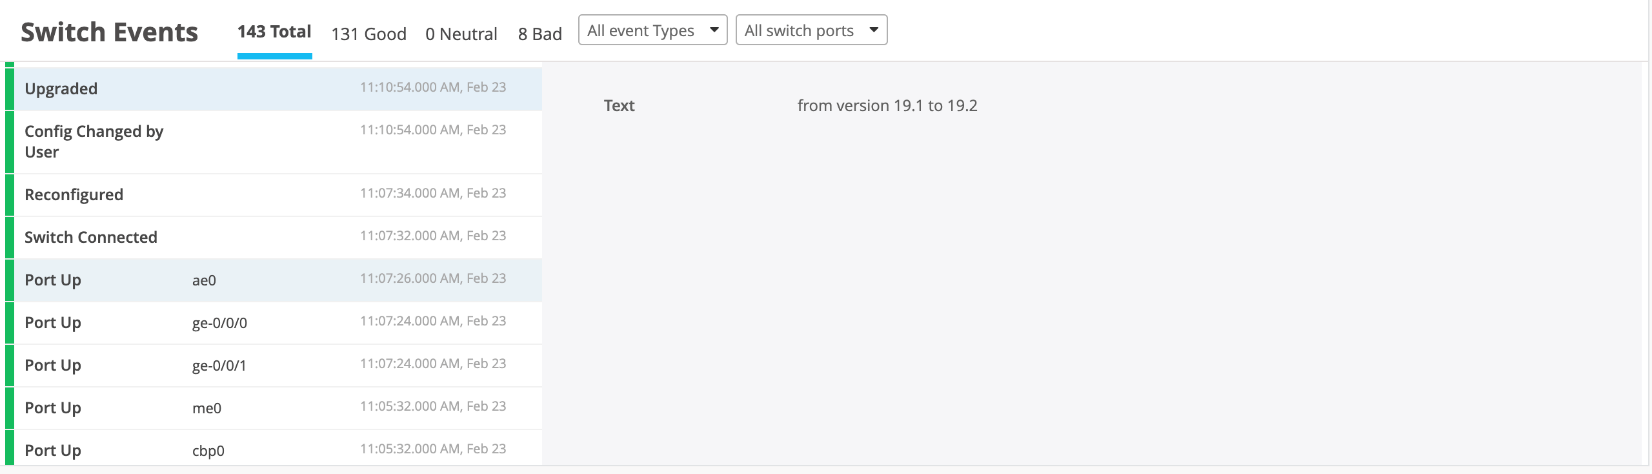
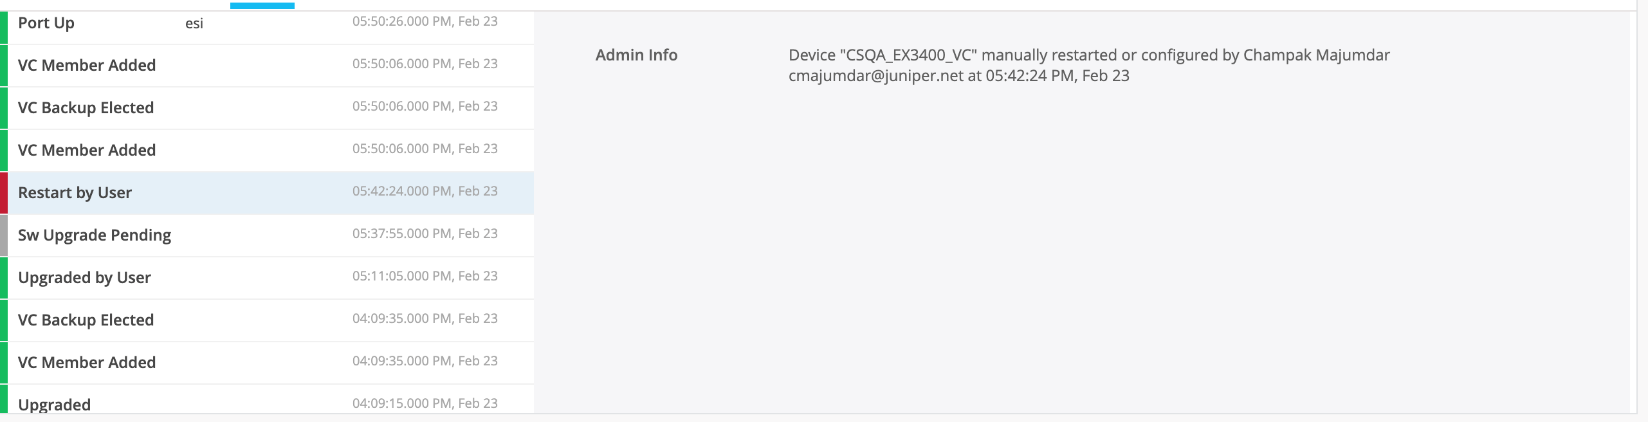
- If the option Reboot after image copy is
unchecked, the “
Sw Upgrade Pending” event is visible as a manual reboot is required to complete the switch upgrade to the desired version:
- The “
Restart by User” event is visible here as a manual reboot was needed for the software upgrade to take effect:
Once the switch is upgraded, the
“Upgraded” event is visible on the
portal:
Multi-Switch Upgrade Support
Juniper Mist provides options to upgrade multiple platforms simultaneously from the switch list view (With different switch model combinations):
Virtual-chassis upgrade support
Mist supports the upgrade of Virtual Chassis. This support does not include NSSU.
The switch upgrade is implemented in a way that it uses the “request system storage
cleanup” Junos OS CLI command before any upgrade to make sure the space is
available so that the image can be copied into the /var/tmp folder onto the switch.
Replace a Single Switch
Overview
- You can replace a switch without disrupting network service by retaining the existing configuration of the switch.
- Also note that this topic does not apply to replacing a switch in a Virtual Chassis.
Replace a Switch through the Juniper Mist Portal
Prerequisites
- The switch being replaced must already be claimed or adopted in the organization and assigned to a site.
- The switch can be in either a “connected” or “disconnected” state.
- The new switch that will replace the old switch should be in an “unassigned” state (that is, not assigned to any site in the organization) and seen on the Inventory page.
Steps
- Go to the Switch tab on the dashboard and click on the switch details view.
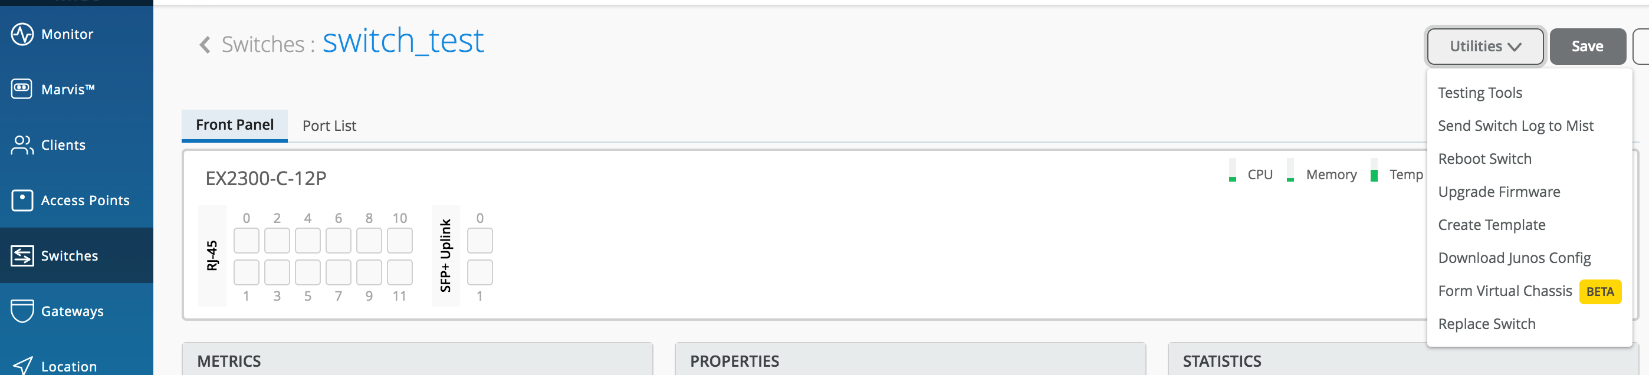
- Click on the Utilities button in the upper-right corner of the page.
- In the Utilities dropdown menu, the
Replace Switch option is seen as shown in the
image below.
- Click on the Replace Switch option.
- A Replace Switch window opens up as shown
below:
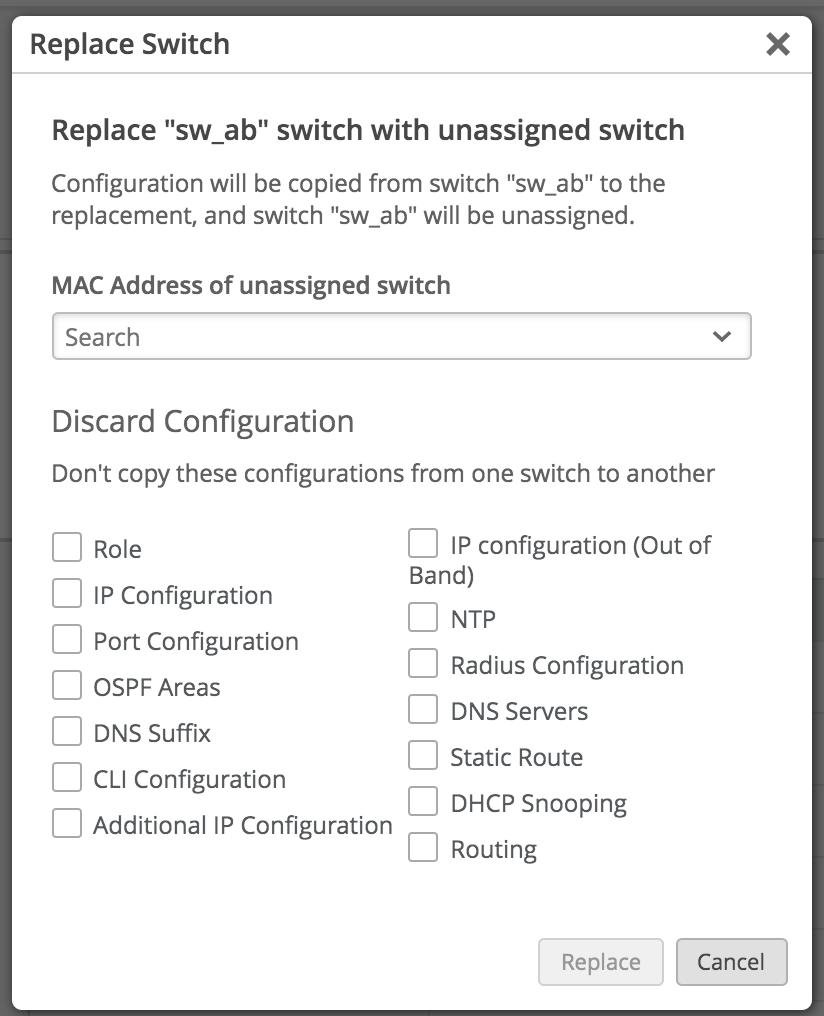
- Make sure that there is at least one switch (non-Virtual Chassis) in an “unassigned” state on the Inventory page of that organization.
- Also note that existing EX Series Switches can only be replaced with another EX Series Switch and not by QFX Series nor SRX Series devices.
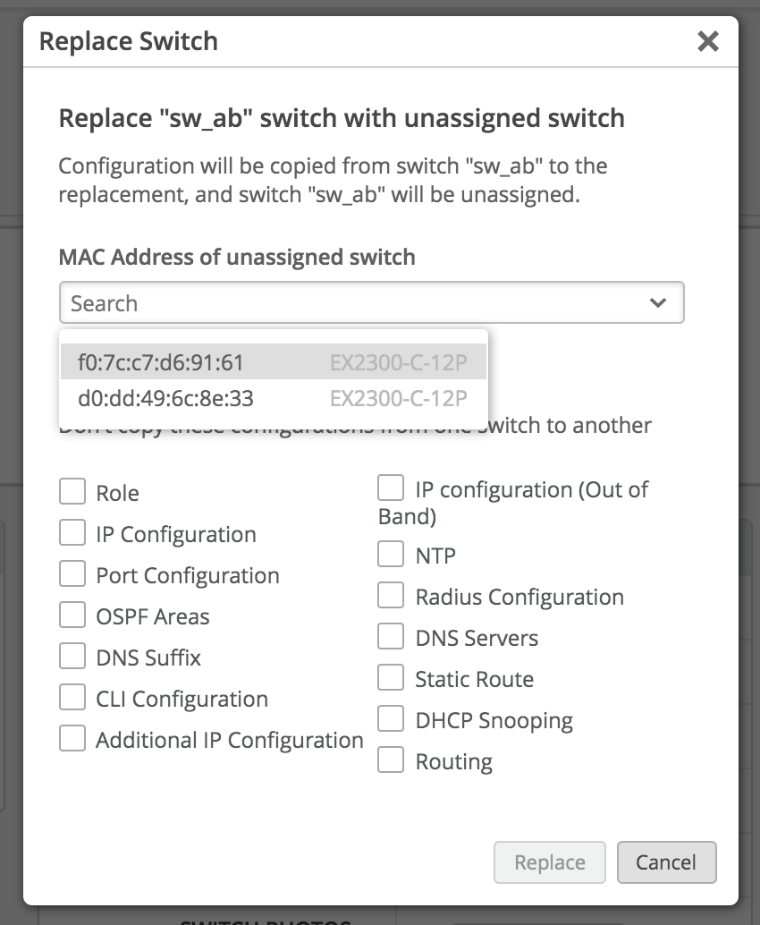
- Search for the MAC address of the new switch in the search box
as seen below:
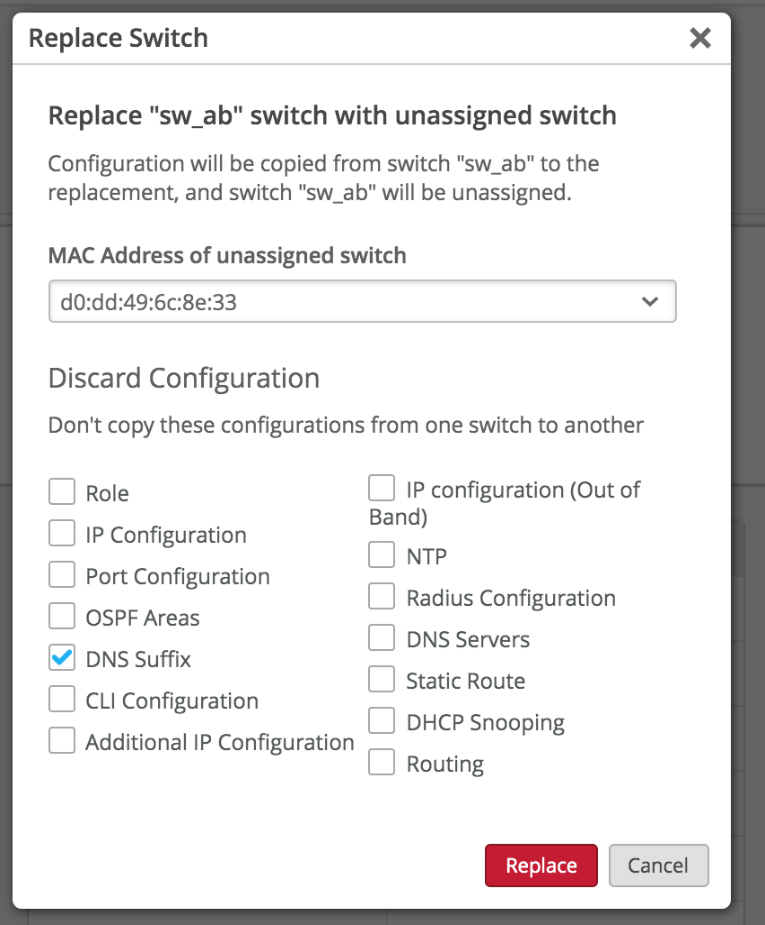
- Click on the checkboxes of any of the listed configuration
items from the old switch that you don’t want to copy to the
new switch, as seen below:
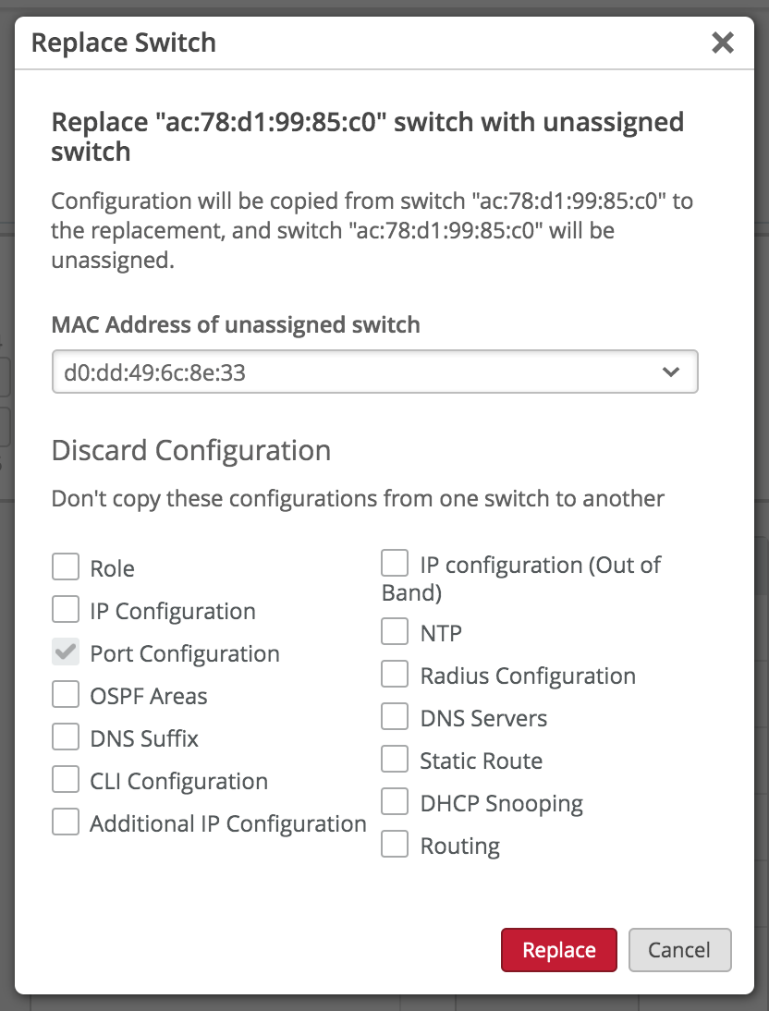
- If a switch with a higher number of ports is getting replaced
with a switch with a lower number of ports, then by default the
portal will discard the port configurations. Hence, the
Port Configuration checkbox will always be checked
by default in such scenarios, as seen below:
- Click the Replace button.
- Notice that the switch is replaced—the new switch takes the place of the old switch.
- The old switch is set to an “Unassigned” state under the Inventory page.
Manage a Virtual Chassis Using Juniper Mist (Add, Delete, Replace, and Modify Members)
Independent of the device type used in the Virtual Chassis, you must always do a preprovisioning of the new switch that will replace an existing switch in the current Virtual Chassis. The Juniper Mist cloud needs to know about and update the Junos OS firmware on the switch that will be added to the Virtual Chassis as well as configure the new device before you can add it to the Virtual Chassis. If the replacement switch arrives at the site, you can leverage one of two methods to be able to image and preprovision the switch before adding it to the Virtual Chassis.
One method is to use a temporary OOBM connection towards the new switch to be able to preprovision it like in the figure shown below. After this switch has joined the Virtual Chassis and all is working again as expected, you can remove the temporary link. If possible, it is recommended to use the same VLAN on the OOBM connection as on the in-band management connection over the LAG.
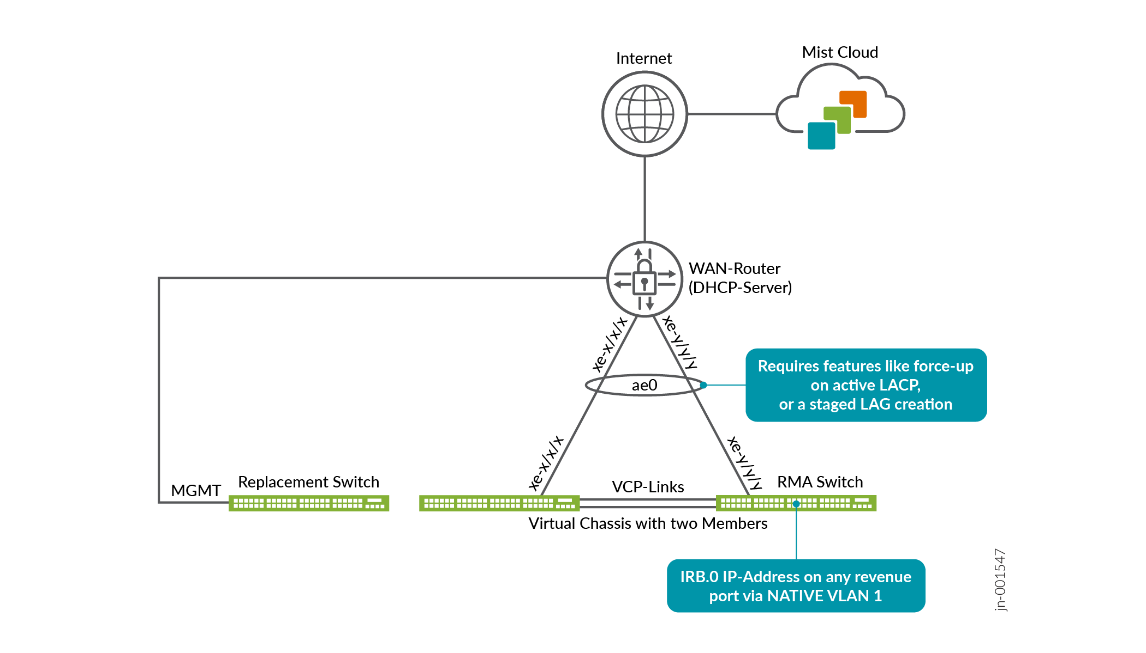
The other option is to daisy chain the in-band management capabilities between an existing (not to be replaced) switch and the new switch using a patch cable between the revenue port on the existing switch and the MGMT port on the new switch:
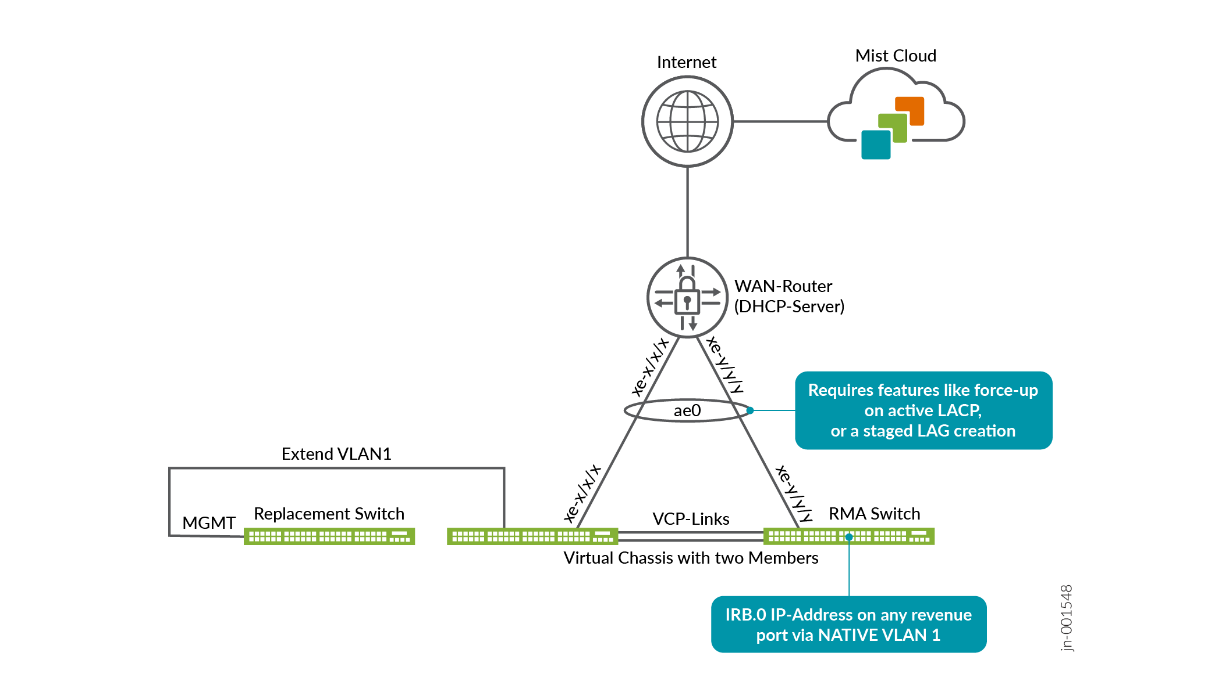
It is NOT RECOMMENDED to daisy chain between the existing switch and the new switch using the revenue ports on both sides! This method has the potential to cause a loop in case someone forgets to remove this cable after the Virtual Chassis is formed again and STP is subsequently removed from these ports.
You can use the Modify Virtual Chassis option on the switch details page to manage your Virtual Chassis. The operations you can perform include renumbering and replacing the Virtual Chassis members and adding new members to a Virtual Chassis.
The modify virtual chassis workflow leverages the Junos OS preprovisioning method which configures the role and serial number of all members in a Virtual Chassis.
The Modify Virtual Chassis option is available for switches that have the configuration management enabled in Juniper Mist.
The preprovisioned configuration specifies the chassis serial number, member ID, and role for both member switches in the Virtual Chassis. When a new member switch joins the Virtual Chassis, Junos OS compares its serial number against the values specified in the preprovisioned configuration. Preprovisioning prevents any accidental role assignment to a Routing Engine, or any accidental addition of a new member to the Virtual Chassis. Role assignments, member ID assignments, and additions or deletions of members in Virtual Chassis are under the control of a preprovisioned configuration.
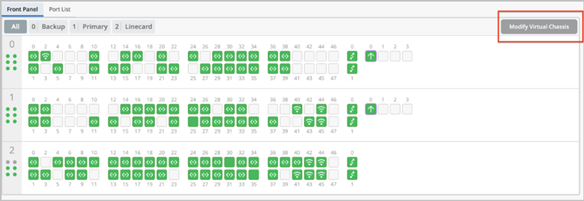
- The Modify Virtual Chassis option is
available:
- To Super Users and Network Admins.
- For switches that have their configuration managed by Juniper Mist.
- This workflow applies to all the EX Series and QFX Series platforms that support Virtual Chassis.
- To delete a member whose MAC address is used as the Virtual Chassis device ID, trash and replace it with an existing member in the Virtual Chassis. To verify if any Virtual Chassis member is used as the device identifier, look for the device ID on the Switch Details page (Virtual Chassis page) or on the switch list.
- The Add Switch dropdown only shows the
switches that:
- Are part of the same site. Models with dedicated VCPs can be in connected or disconnected state. However, to modify the EX2300, EX4650, or QFX5120 Virtual Chassis, the members should be in the connected state as these switches don’t have dedicated VCPs.
- Have configuration management enabled in Mist.
- Are not currently part of the same or another Virtual Chassis.
- Are of the same model family. For example, an EX4100-F switch can be part of a Virtual Chassis with an EX4100-48MP switch.
- The Modify Virtual Chassis button is disabled when the Configuration Management option is disabled for the switch.
- When a Virtual Chassis configuration is in progress, you cannot make any changes inside the Modify Virtual Chassis page.
Prerequisites
Before you perform any modification to a Virtual Chassis, you must remove all the additional CLI commands specific to Virtual Chassis (the virtual-chassis commands) from the associated device or site template. The additional CLI commands take precedence over other types of configurations. If a Virtual Chassis configuration is detected under the Additional CLI Commands section, you cannot make any changes using the Modify Virtual Chassis option. When you attempt to modify a Virtual Chassis, the Juniper Mist dashboard displays a message to indicate that the additional CLI commands (if present) need to be removed and saved.
Convert a Virtual Chassis to Use a Virtual Device ID (Using the API)
When a Virtual Chassis device is represented in Juniper Mist by the MAC address of one of its member switches, managing it can become challenging. Especially replacing or removing a member switch may cause inconsistencies in how the Virtual Chassis is represented, potentially disrupting connectivity.
Therefore, we recommend that you convert any existing Virtual Chassis device that uses a member MAC address as its device ID to use a virtual device ID. Moving to a virtual device ID provides a consistent and centralized way to represent and manage a Virtual Chassis as a single logical entity, making future operations cleaner and more reliable.
A virtual device ID starts with the value of 0200. A device ID that starts with any other value is assumed to be based on a member MAC address.
To convert a virtual chassis (using the API):
- Locate the site where the Virtual Chassis is deployed and
identify the site ID. To do that, use the steps below:
- Navigate to Organization > Site Configuration.
- Select the site to open it. You can find the site ID on the Information tile on this page.
- Identify the current device ID of the Virtual Chassis that is
represented using a member MAC address. To do that, use the steps
below:
- Click Switches to navigate to the switches page and locate the Virtual Chassis that needs to be converted.
- Click the Virtual Chassis device to open the Virtual Chassis (switch) details page. Look for the device ID in the URL. A MAC address-based device ID typically starts with a value other than '0200'.
- Perform the conversion by issuing a POST request to the API endpoint below using your Site ID and Device ID.
API Endpoint:
https://api.<cloud_env>.mist.com/api/v1/sites/<site_id>/devices/<device_id>/vc/convert_to_virtualmac
Example:
POST https://api.mist.com/api/v1/sites/978c48e6-6ef6-11e6-8bbf-02e208b2d34f/devices/00000000-0000-0000-1000-a4e11a000000/vc/convert_to_virtualmac
Following this action, the existing device (represented by a member MAC) is disconnected from the Juniper Mist cloud, and a new device along with a virtual device ID is created and displayed. A virtual device ID typically starts with '0200'.
-
Converting a Virtual Chassis device to use a virtual device ID will permanently erase all the events and stats previously stored for this device in the Juniper Mist cloud.
-
The newly created Virtual Chassis may initially show as disconnected on the switch list page. However, within a few minutes, it will automatically reconnect and appear on the switch list as connected.
-
The conversion does not impact the data plane—switching functionality continues uninterrupted.
Replace a Virtual Chassis Member
Instructions in this topic apply to any
Virtual Chassis device that has a device ID starting with '0200',
as shown in the image below. If the Virtual Chassis uses a member
MAC address as its device identifier, you must follow the
instructions in Replace a Member Whose MAC Address is Used
as Virtual Chassis Device ID to avoid any connectivity
disruptions during the process. You can find the device ID on the
switch details page (Virtual Chassis page).
Replacing a Virtual Chassis member switch involves deleting the old member and adding a new member. Before replacing a member switch, you must ensure that:
- The new switch is of the same model family as the other members in the Virtual Chassis.
- The new switch is connected to the Virtual Chassis.
- The new switch is assigned to the same site as the other members in the Virtual Chassis.
To replace a Virtual Chassis member that has a device ID starting with '0200':
- Onboard the replacement switch to the Juniper Mist cloud and
assign it to the same site as the other members in the Virtual
Chassis. To onboard the switch, use the Claim
Switch or Adopt Switch option on the
Inventory page (Organization >
Inventory). You can also use the MistAI mobile app to
claim a switch.
During the switch onboarding, remember to enable the configuration management for the switch by selecting the Manage Configuration with Mist option.
For the adopt switch workflow, the Manage Configuration with Mist option is available during the site assignment step. For more information on the adopt switch workflow, see Onboard a Brownfield Switch.
For the claim switch workflow, the Manage Configuration with Mist option is available on the Claim Switches and Activate Subscription page. For more information about the claim switch workflow, see Onboard Switches to Mist Cloud.
- If you are replacing the primary member, that is, the Routing Engine of the Virtual
Chassis, perform a graceful switchover from the primary role to the backup role. To do
this, log in to the remote shell and run the following CLI command:
request
            chassis routing-engine master switch
. - When the backup becomes the new primary, power off the original primary member (the member to be replaced). Or remove the VCP cables from this member.
- Connect the Virtual Chassis cables from the existing Virtual Chassis members to the new replacement switch.
- On the Juniper Mist portal, navigate to the switch (Virtual Chassis) details page by clicking Switches > <Switch Name>.
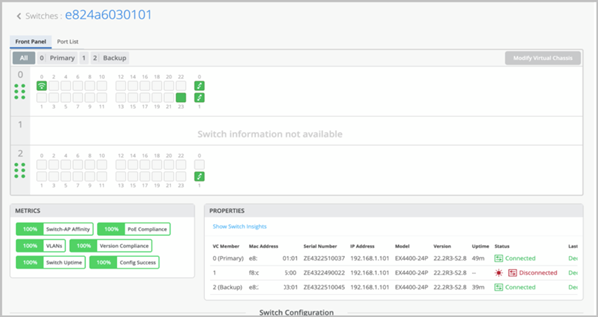
- Wait for the switch details page to display the member switch
to be replaced as offline, as shown below:
- Click Modify Virtual Chassis.
Because you removed the VCP connection from the member switch being replaced, the Modify Virtual Chassis window displays a broken link for this member switch along with a delete (trash) icon.

- Delete the member to be replaced by clicking the trash icon.
- Click Add Switch to add the new replacement member.
- Renumber the new switch by dragging and dropping it into the appropriate slot.
- Edit the MAC address of the primary or backup switch if you are replacing one of them.
- Click Update.

- Ensure that the replacement switch, which is onboarded, is powered on.
- Wait for Virtual Chassis formation to be complete.
The Switch Events page displays all the Virtual Chassis update events.

Replace a Member Whose MAC Address is Used as Virtual Chassis Device ID
Instructions in this topic apply to any
Virtual Chassis device that uses a member MAC address as its device
identifier, as shown in the image below. If the Virtual Chassis
that has a device ID starting with 0200, you must follow the
instructions in Replace a Virtual Chassis Member to replace its
members. You can find the device ID on the switch details page
(Virtual Chassis page).
If a Virtual Chassis uses the MAC address of a member (typically the FPC0) as the device identifier, you cannot replace that member in a single operation as it is used to communicate to the Juniper Mist cloud. You need to carry out the replacement in a 2-step process that includes adding the new replacement switch and then removing the switch to be replaced. In such cases, you should carry out the member replacement operation in a maintenance window as this operation can impact the traffic to the clients connected.
Replacing an FPC member that is used as the device ID will freshly assign the Virtual Chassis with a new device ID that is no longer tied to any FPC member.
Before replacing a member switch, you must ensure that:
- The new switch is of the same model family as the other members in the Virtual Chassis.
- The new switch is connected to the Virtual Chassis.
- The new switch is assigned to the same site as the other members in the Virtual Chassis.
- The Virtual Chassis is preprovisioned. For a 2-member VC, the split and merge feature is disabled by default (no-split-detection) if the Virtual Chassis is provisioned by the cloud.
To replace a member (FPC0, for example) whose MAC address is used as the Virtual Chassis device ID:
- Remove the uplink connection (in-band or OOB) from the FPC0 member (if an uplink is present). Ensure the connectivity to the Juniper Mist cloud is maintained after the removal of the uplink. If this is the only uplink, connect it to another member that can provide the uplink connectivity.
- If the FPC0 is a primary member, that is, the Routing Engine of the Virtual Chassis,
perform a graceful switchover from the primary role to the backup role. To do this, log in
to a remote shell and run the following CLI command:
request chassis
            routing-engine master switch
. - Power off the FPC0 member to be replaced. Or, remove the VCP cable from it.
- Claim the new member switch, assign it to the same site, and
enable configuration management on the switch.
If this member switch belongs to a model (such as the EX2300, EX4000-8P, EX4650, or QFX5120) that does not have a dedicated VC port, you should connect it to the Juniper Mist cloud. For information on how to claim a switch, refer to Activating a Greenfield Switch via claim and ZTP-based installation.
- Connect the VCP cable to the new member on the same ports.
The new member is added to the Virtual Chassis.
Now, the Virtual Chassis status in Junos OS will look like that shown below:
- fpc0 - Not present
- fpc1 – Present
- fpc2 - Non-provisioned because the fpc0 and fpc1 were already
preprovisioned.
user@switch> show virtual-chassis
.
Preprovisioned Virtual Chassis
Virtual Chassis ID: 19e4.0553.ff90
Virtual Chassis Mode: Enabled
                                                Mstr           Mixed Route Neighbor List
Member ID  Status   Serial No    Model          prio  Role      Mode  Mode ID  Interface
0 (FPC 0)  NotPrsnt EZ0524AX0140
1 (FPC 1)  Prsnt    FA1024AX0329 ex4100-48p     129   Master*      N  VC
-          Unprvsnd FJ1123AV0214 ex4100-f-12p
- In the Juniper Mist portal, click Switches > Switch Name to go to the switch details page of the Virtual Chassis to be modified.
- Click Modify Virtual Chassis.
The Modify Virtual Chassis window appears.
- On the Modify Virtual Chassis window, click Add
Switch and add the replacement switch to the Virtual
Chassis as a new member.

- Click Update.

- Wait 5 to 10 minutes for the data to synchronize and appear on the Juniper Mist portal.
- Click Modify Virtual Chassis again.
Because you removed the VCP connection from the FPC0 being replaced, the Modify Virtual Chassis window displays a broken link against this member switch along with a delete (trash) icon.
- Delete the member to be replaced by clicking the trash icon.
The Modify Virtual Chassis window displays a message indicating that FPC0 is required.
- Move the FPC2 member to slot 0 (the FPC0 slot) by dragging and
dropping.
 Note:
Note:Ensure that no role change is performed.
- Click Update.
- Update the Backup field with the MAC address
of the new switch, as shown below:

- Click Update.
Renumber the Virtual Chassis Members
If you prefer to see the Virtual Chassis members on the Juniper Mist portal in the same order as they are physically stacked, you need to reorder the switches (after they are powered on and connected to Virtual Chassis) using the Modify Virtual Chassis option.
You can modify the member switches’ order on the Juniper Mist portal by renumbering the members. On the Modify Virtual Chassis window, accessible from the switch details page, you can move around the port panel of a switch to change the order of the member. The order is incremental. The first entry is member 0, the second is member 1, and so on. You are required to specify the FPC0.
To renumber the switches in a preprovisioned Virtual Chassis:
- Click the Switches tab on the left to navigate to the Switches page.
- Click the Virtual Chassis in which you want to renumber the
members.
The switch details page appears.
- On the switch details page, click Modify Virtual
Chassis.
The Modify Virtual Chassis window appears.
- On the Modify Virtual Chassis screen, drag and drop the port panel of a switch to
different slots to change the switch number. The order is incremental. The first entry is
member 0, the second is member 1, and so on. In the example below, the FPC1 has been
renumbered as FPC2 and the FPC2 has been renumbered as FPC1.
 Note:
Note:Within a Virtual Chassis that uses the MAC address of a member (typically FPC0) as the device ID, you cannot renumber or move around that member unless it is disconnected.Renumbering the members within a Virtual Chassis does not renumber the port configurations and port profile assignment. When you renumber a VC, Mist displays the following warning (as shown in the picture above): "Renumbering of VC members has been detected. The port configurations defined under Port Configuration > Port Profile Assignment will not be modified. Please verify that port configurations are correct after saving these changes."
So, ensure that these changes are taken care of before or after renumbering the members in the Virtual Chassis.
- After you have made the changes, click Update.
The members are renumbered.
Reassign Virtual Chassis Member Roles
A Virtual Chassis configuration in a Juniper Mist™ network has two switches in the Routing Engine role — one in the primary Routing Engine role, and the other in the backup Routing Engine role. The remaining member switches operate in the linecard role. You can change the role of a switch from primary to backup or backup to linecard or linecard to primary.
To change the role of Virtual Chassis members:
- Click the Switches tab on the left to navigate to the Switches page.
- Click the Virtual Chassis in which you want to change the
member roles.
The switch details page appears.
- On the switch details page, click Modify Virtual
Chassis.
The Modify Virtual Chassis window appears.
- On the Modify Virtual Chassis screen, specify a primary switch and a backup switch (optional) from the Primary and Backup drop-down list. All the other switches assume a linecard role.
- After you have made the changes, click Update.
The member roles are changed.
You will see the updated status about the role change on the switches page on the Juniper Mist portal. The role change will take some time (approximately 15 minutes) to appear on the Juniper Mist portal. You can see a banner message at the top after every change that you make, as shown below:

Delete Virtual Chassis Members
You can delete the member switches from the Virtual Chassis by clicking the delete (trash) icon on the Modify Virtual Chassis window. Before deleting any member switch, you must ensure that the switch to be removed is disconnected from the Virtual Chassis. If the switch is connected, power it off or remove the VCP connection from it.
To delete a member switch from Virtual Chassis:
- If you are removing a primary member, that is, the Routing Engine of the Virtual
Chassis, perform a graceful switchover from the primary role to the backup role. To do
this, log in to the Remote Shell and run the following CLI command:
request chassis routing-engine master switch - Power off the member to be removed. Or remove the VCP cable from it.
- On the Juniper Mist portal, click the Switches tab on the left to navigate to the Switches page.
- Click the Virtual Chassis from which you want to delete a
member switch.
The switch details page appears.
- On the switch details page, click Modify Virtual
Chassis.
The Modify Virtual Chassis window appears. Because you have removed the VCP connection from the member switch, the Modify Virtual Chassis window displays a broken link for the member switch along with a delete icon.
- Click the delete icon and then click Update.

Mist removes the member switch from the Virtual Chassis.
Add a Member Switch to a Virtual Chassis
You can add one or more member switches to a Virtual Chassis from the Modify Virtual Chassis window. Before adding a new member switch to a Virtual Chassis, ensure the following:
- The new switch is of the same model family as the other members in the Virtual Chassis.
- The new switch is connected to the network (applicable to EX2300, EX4650, and QFX5120).
- The new switch is assigned to the same site as the other members in the Virtual Chassis.
Juniper Mist automatically upgrades a Virtual Chassis linecard member if it is running a Junos OS version different from that of the primary member. The linecard member will be upgraded to the same version as the primary member if the following conditions are met:
- The switch must form a Virtual Chassis with three or more members—that is, a primary, a backup, and a linecard member.
- The Junos OS version on the linecard member is different from that on the primary member.
- The linecard member must be in Inactive state.
Note that a linecard member will be upgraded only if it is inactive and running a clearly different Junos OS version. Minor differences, such as different spin numbers, will not trigger an upgrade.
- Only the Junos OS versions listed on the Mist portal are available for upgrade.
To add a new member switch to the Virtual Chassis:
- Onboard the new switch to the Juniper Mist cloud and assign it
to the same site as the other members in the Virtual Chassis. To
onboard the switch, use the Claim Switch or
Adopt Switch option on the Inventory page
(Organization > Inventory). You can also use the MistAI mobile
app to claim a switch.
During the switch onboarding, remember to enable the configuration management for the switch by selecting the Manage configuration with Mist option.
For the adopt switch workflow, the Manage configuration with Mist option is available during the site assignment step. For more information on the adopt switch workflow, see Activating a Greenfield Switch via claim and ZTP-based installation .
For the claim switch workflow, the Manage configuration with Mist option is available on the Claim Switches and Activate Subscription page. For more information about the claim switch workflow, see Activating a Brownfield Switch via Adoption Code-Based Installation .
- On the Juniper Mist portal, click the Switches tab on the left to navigate to the Switches page.
- Click the Virtual Chassis to which you want to add the new
member switch.
The switch details page appears.
- On the switch details page, click Modify Virtual
Chassis.
The Modify Virtual Chassis window appears.
- On the Modify Virtual Chassis window, click Add
Switch.

- Specify the VC port ID for the switch, if needed (the port ID configuration applies to the EX2300, EX4650, and QFX5120 switches).
- Click Update.
- Connect the VCPs as specified on the Modify Virtual Chassis
window and wait for 3 to 5 minutes for virtual chassis to be
updated.
While the Virtual Chassis is forming, the switches page displays the status as 'VC Forming'.

- After Mist updates the Virtual Chassis, the switch details page displays the front panel of all the three Virtual Chassis members.

Preprovision a Virtual Chassis
Before modifying any Virtual Chassis, we recommend that you ensure it is preprovisioned.
The preprovisioned configuration specifies the chassis serial number, member ID, and role for the member switches in a Virtual Chassis. When a new member switch joins the Virtual Chassis, Junos OS compares its serial number against the values specified in the preprovisioned configuration. Preprovisioning prevents any accidental role assignments, or the accidental addition of a new member to the Virtual Chassis. Each role, member ID, addition or removal of members, is under the control of the configuration.
To preprovision a Virtual Chassis:
- Navigate to the Switches page (switch list) and review the preprovisioning status in the Preprovisioned VC column. The Virtual Chassis devices that are not preprovisioned are highlighted with an 'x' mark in red.
- Click to open the Virtual Chassis that has not been
preprovisioned.
The Virtual Chassis (switch) details page appears with a warning message indicating that the device is not yet preprovisioned.
- Click the Preprovision button on the right side of the warning message to go to the Modify Virtual Chassis window.
- On the Modify Virtual Chassis window, click Preprovision Virtual
Chassis.
This action pushes the preprovisioned Virtual Chassis configuration to the device and overwrites the old autoprovision Virtual Chassis configuration pushed to the device during the ZTP process. This option assumes the current positioning of the members and preprovisions them as is.
Packet Capture Examples
Packet capture (PCAP) is a tool that helps you to analyze network traffic and troubleshoot network problems. The packet capture tool captures real-time data packets traveling over the network for monitoring and logging.
You can enable on-demand PCAP on switches that have CloudX running. For the list of switches that support CloudX, refer to Switch Connectivity Towards Juniper Mist cloud.
The PCAP feature captures both control traffic (the traffic handled by the device CPU) and transit traffic (the traffic forwarded by network processors) that pass through switches at a site.
To capture transit traffic, a switch must have the secure PCAP feature enabled. Currently, only the EX4400, EX4100, EX4000 switches support this feature. PCAPs capture only ingress transit traffic, not egress traffic.
Packets are captured as binary data, without modification. You can read the packet information offline with a packet analyzer such as Wireshark or tcpdump.
To enable PCAP on a switch:
- Select Site > Wired > Switch Packet Captures.
- Select a site from the Site drop-down list.
- Click the
+icon next to the Add Switch field and select the switch on which you want to enable packet capture.
You can select multiple switches for a single packet capture operation.
- Specify the number of packets captured per switch, packet size
in bytes, and the duration of the capture session in
seconds.Note:
If you specify 0 in the No. of packets/Switch field, unlimited number of packets will be captured.
- Configure a port filter for packet capture. To do that follow
the steps below:
- Click Add Port Filter.
- Click the port icon in the Port Name field,
select a port on which you want to enable packet capture, and then
click Done.
 Note:
Note:You can select multiple ports from multiple switches in a single packet capture configuration.
If you want to capture traffic on CPU, select the Capture Traffic on CPU check box.
- Under Advanced filters, specify filters using a tcpdump
expression if required.
You can also use the expression builder to build the expression.
- Click Save.
- Click Start Capture to enable packet capture on the selected port.
After the packet capture is complete, you can download the file for inspection. To do that, click Captured File on the upper right of the screen. Note that the upload and availability in Juniper Mist cloud can take a few minutes.

For more details about how to view the packet capture in Wireshark, refer to Configure IEEE 802.11 on Wireshark and View Wireless Packet Captures in Wireshark.