Validate Access and Authentication
To ensure positive user experiences and quickly resolve authentication issues, check on connected and failed client devices, identify issues, and get guidance from Marvis about root causes and recommended actions.
Check Connected Client Devices
Watch the following video on validating access and authentication configuration:
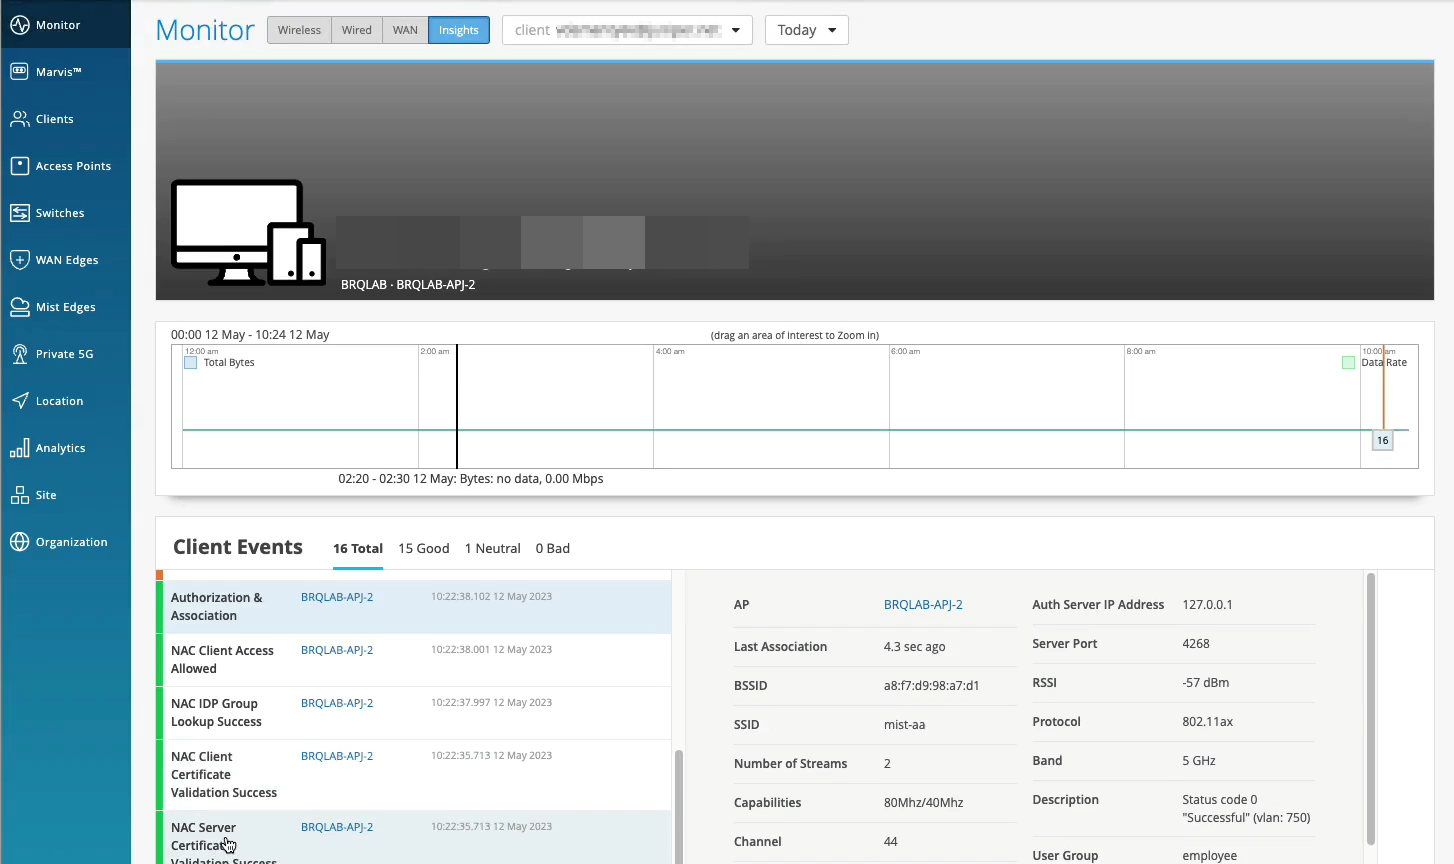
Clients are actually happy and connected and authorized and can actually pass traffic. So let's take a look at one of the clients here that I have as an example. So let's take a look at client insights. What we already see is the client is able to get network connectivity, grab an IP address. It can resolve DNS. We have this information as the client goes through that whole connection process from the network infrastructure, in this particular case from the access point.
But now, we are extending this visibility into the whole NAC authentication and authorization phases. So we know that, OK, client trusted the server cert. Then, actually, we see that it's using certific ate to authenticate. So our service, we're getting all the metadata about the client certificate. We then do an IDP lookup against Okta in our particular scenario. And we know, OK, so this user is actually part of these three groups in the Okta user directory. Great. What's next?
We are actually evaluating whether we should allow or deny this particular client, and what policy we want to assign. So we are saying, oh, client access is allowed, great. We are signing a VLAN. We're signing a role or a user group, employee. But we are also saying, oh, hey, this is the authentication rule that we've hit during the authorization process. So let's take a look. Let's click on it. Oh, voila. So we now can tell you exactly which policy rule triggered during that particular user authentication. So we are seeing not only the authentication experience. We are also seeing the whole end to end connection experience, all the way from the neck, all the way to the client actually being able to pass traffic left and right.
Check Failed Client Devices
Watch the following video on validating access and authentication configuration:
Normally, if we would only have the visibility from the network point of view, we would just say, OK, this client failed authorization. It's a .1X failure. But since we don't control the other side of the authentication process, we don't really know what's happening here.
But now, since we've extended this NAC authentication authorization visibility into the Mist cloud, we now can say exactly what happened. So if you look just at the event below, we are saying, oh, actually, the reason for the failure is because the client does not trust the server certificate, right?
So we are now - we now can tell exactly what is the authentication issue that the client has experienced. And this is caused by the client configuration issue that you need to look at. And again, we are providing all the details in here.
So now, we can pinpoint and answer the question, whether it's client config problem, whether it's a network issue and client cannot get network services, or it's an authentication policy issue and we've just configured our policies incorrectly.
Marvis Actions to Identify Authentication Issues
Marvis Actions is a one-stop information center that provides visibility into ongoing site-wide network issues that affect user experience in an organization.
The type of subscription you have for your organization determines the Marvis Actions usage. See Marvis Actions for Wired, WAN, and Wireless Assurance for details.
Watch the following video on Marvis actions on validating access and authentication configuration:
Maybe I don't even want to be reactive. Is there something that can tell me when there is an issue? Is there something that can look at my entire network and figure out if there is an issue that is widespread, maybe it's affecting a specific site, a specific group of access points or switches or anything like that? Well, yes, sure there is. That's why we have Marvis Actions.
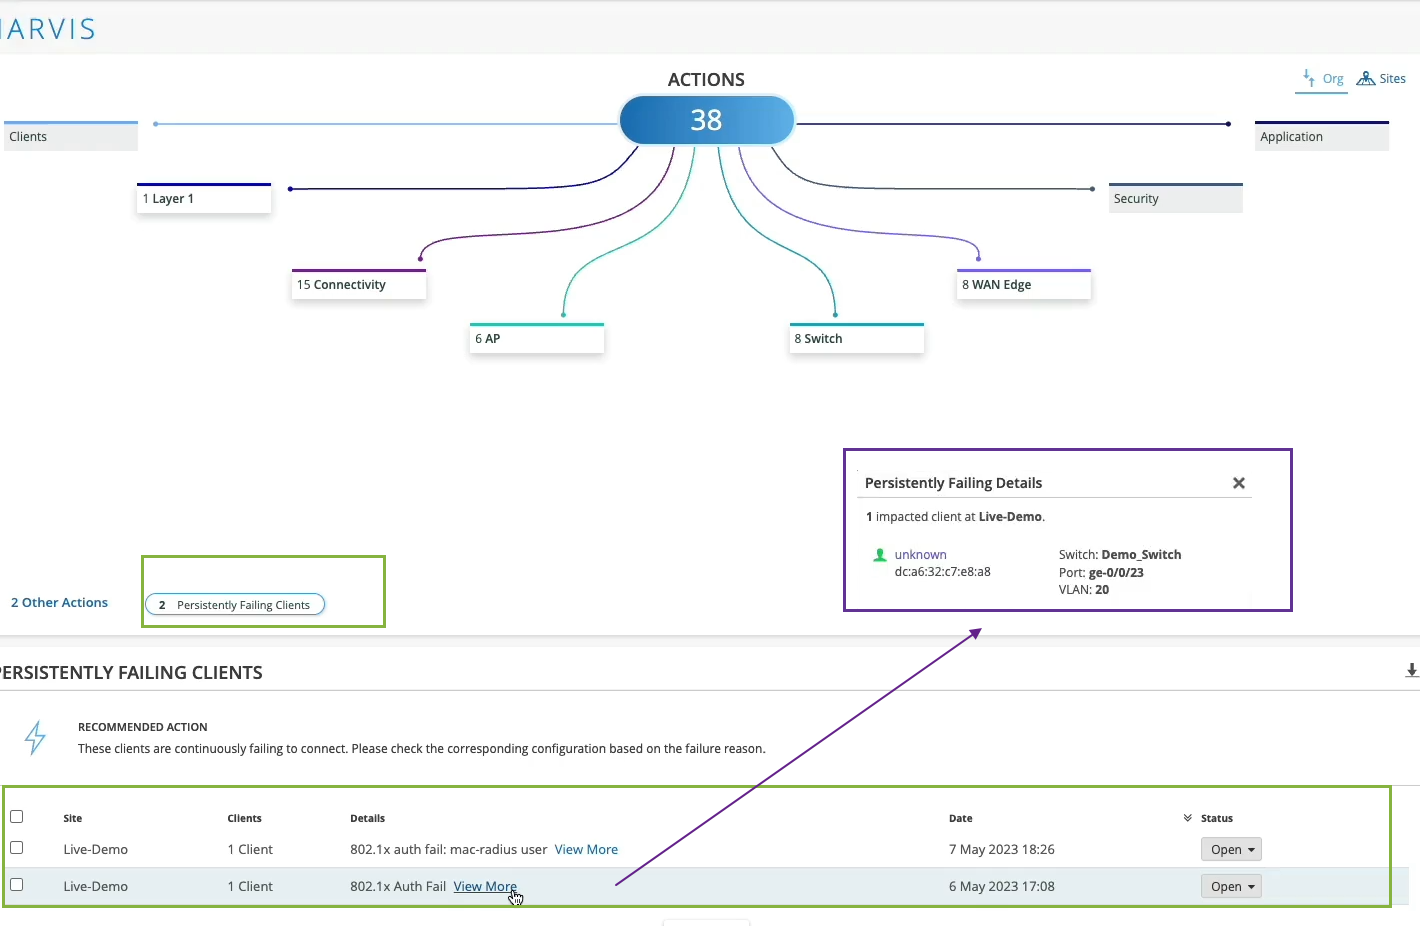
In Marvis Actions, we can start slow and we could say, okay, maybe you have some offenders on the network that are consistently trying to connect and they're failing. So let's take a look at them. Let's see what we have there.
Oh, okay. So we have two clients that are failing .1x authentication persistently, consistently, right? And we are saying, okay, let's take a look and maybe at least we can pinpoint where those users are. Well, they are connected to this specific switch and this specific port and this VLAN.
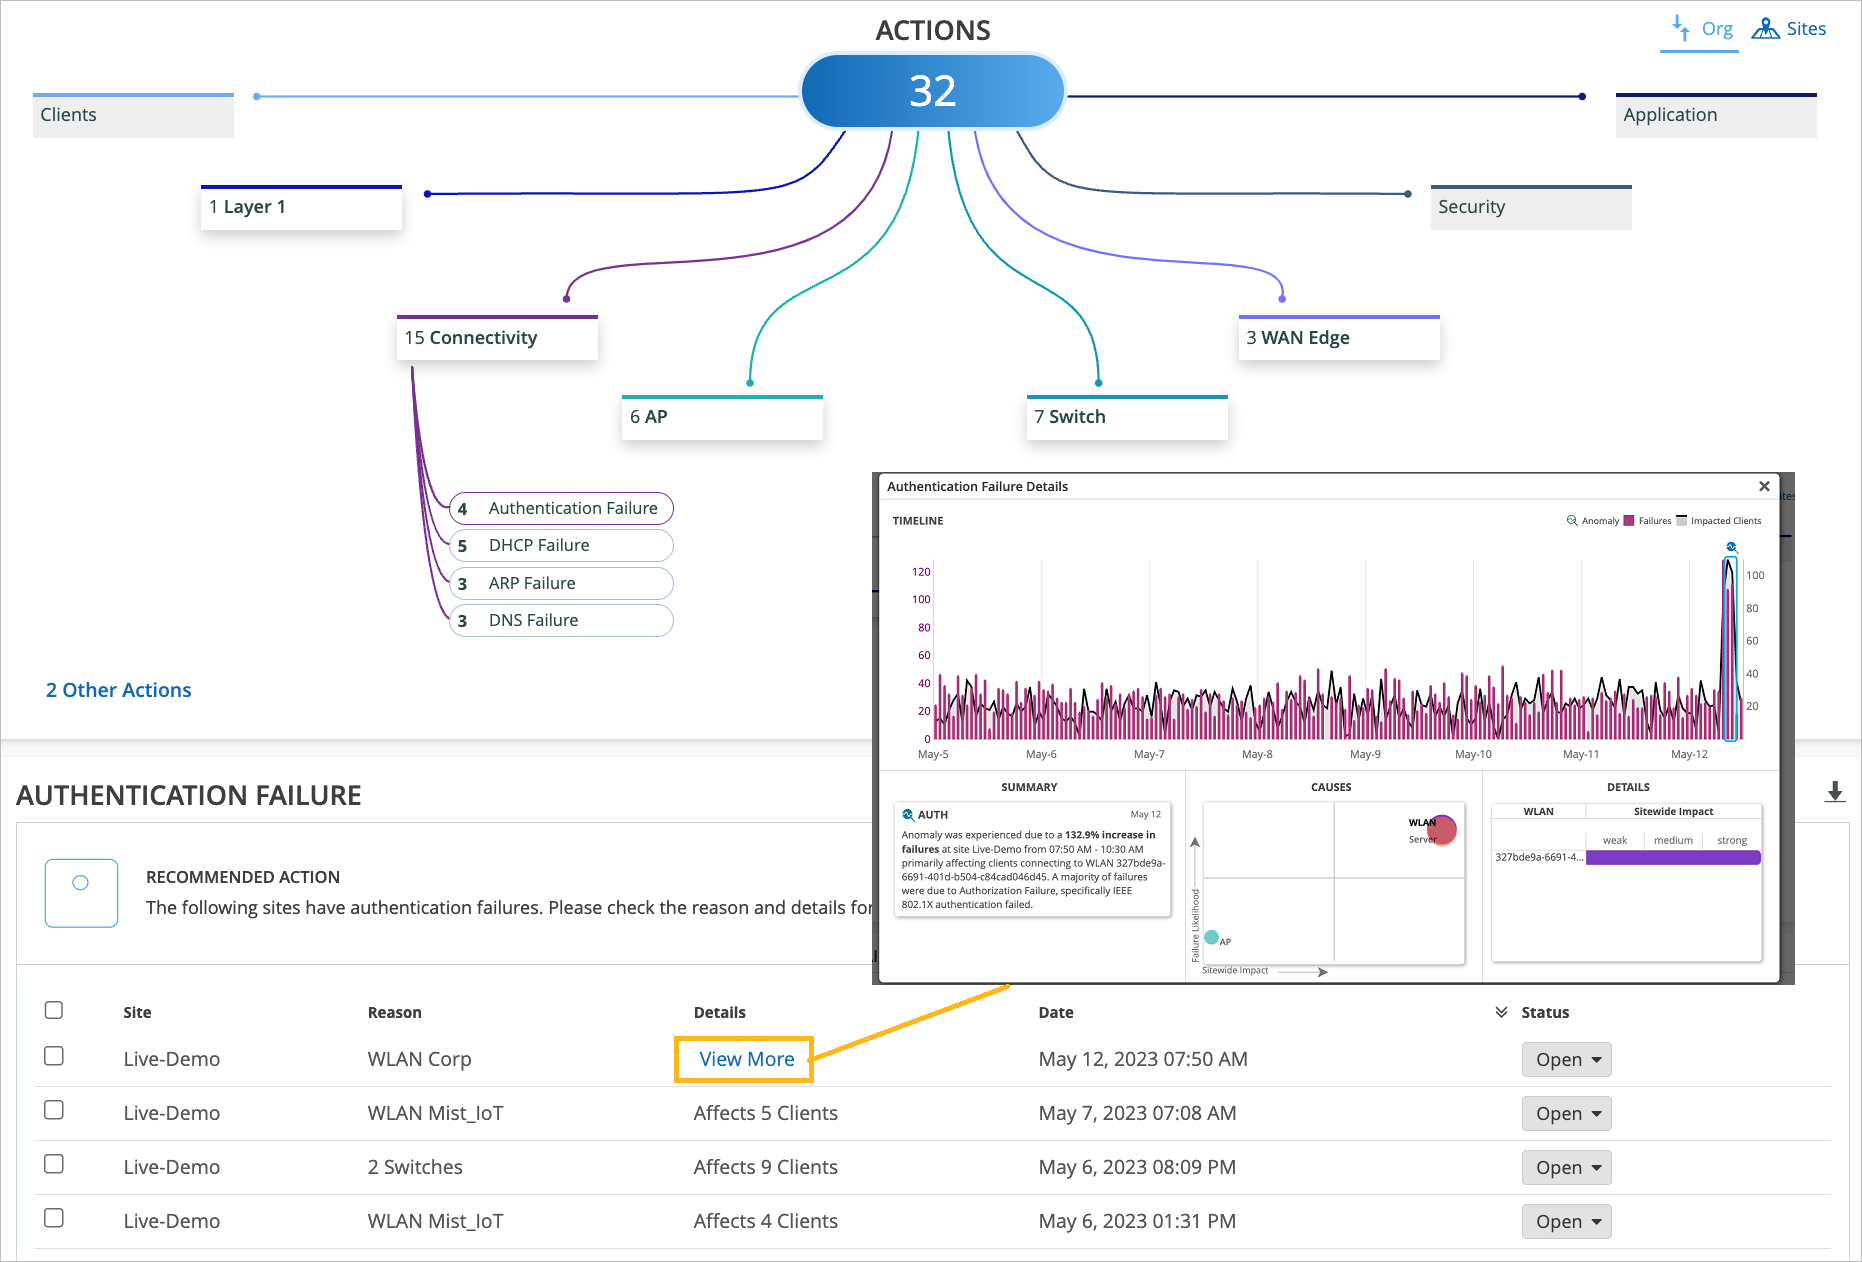
Maybe you want to check and see what's plugged into there that is never able to connect for a long period of time. That's fine. Now, if we look at things at scale, if we look at things holistically, let's say at the whole organization, we can then pinpoint, oh, maybe you have authentication failures that are affecting a specific SSID or specific groups of APs or clients that are more widespread.
This is where we are actually learning what's going on on your network, what's normal, what's not. And whenever there is an anomaly, we would highlight this in the connectivity action in Marvis Action tab. Similarly, if it's not related to authentication or authorization, we can look the layer above and maybe there is an actual network service related issue, maybe your gateway is not responding, maybe you're run out of IP addresses.
The point is all of this information is looked at holistically, right? All the way starting from the NAC authentication authorization now, all the way to client being able to pass traffic and get network services up and running.


