WAN Insights for Session Smart Routers
Monitor metrics for performance, utilization of links, and applications for your Session Smart Routers.
Juniper WAN Assurance is a cloud service that brings automated operations and service levels to the enterprise access layer at the WAN edge. This cloud service also provides WAN insights for Juniper® Session Smart™ Router. You can view comprehensive insights about WAN link service-level expectation (SLE) metrics, performance and utilization of links, and application metrics.
Features and Benefits
-
Provides visibility into user experiences with WAN by generating WAN SLEs metrics.
-
Generates insights on WAN visibility for link and application quality of experience (QoE).
-
Provides traffic metrics for WAN edge devices, interfaces, or zones.
-
Generates details about the devices and applications that use the network's bandwidth.
Before You Begin
-
Refer to the Juniper Mist WAN Configuration Guide for the WAN configuration details.
-
Understand about WAN Service Level Experience (SLE).
-
See Mist Premium Analytics Trial License to know about license requirements for the Juniper Mist Premium Analytics dashboard.
- Become familiar with the options available on the Juniper Mist Premium Analytics dashboard. See Figure 3.
Access WAN Insights-SSR Dashboard
-
On the Premium Analytics page, click WAN Insights -
SSR.
Figure 1: WAN Insights- SSR
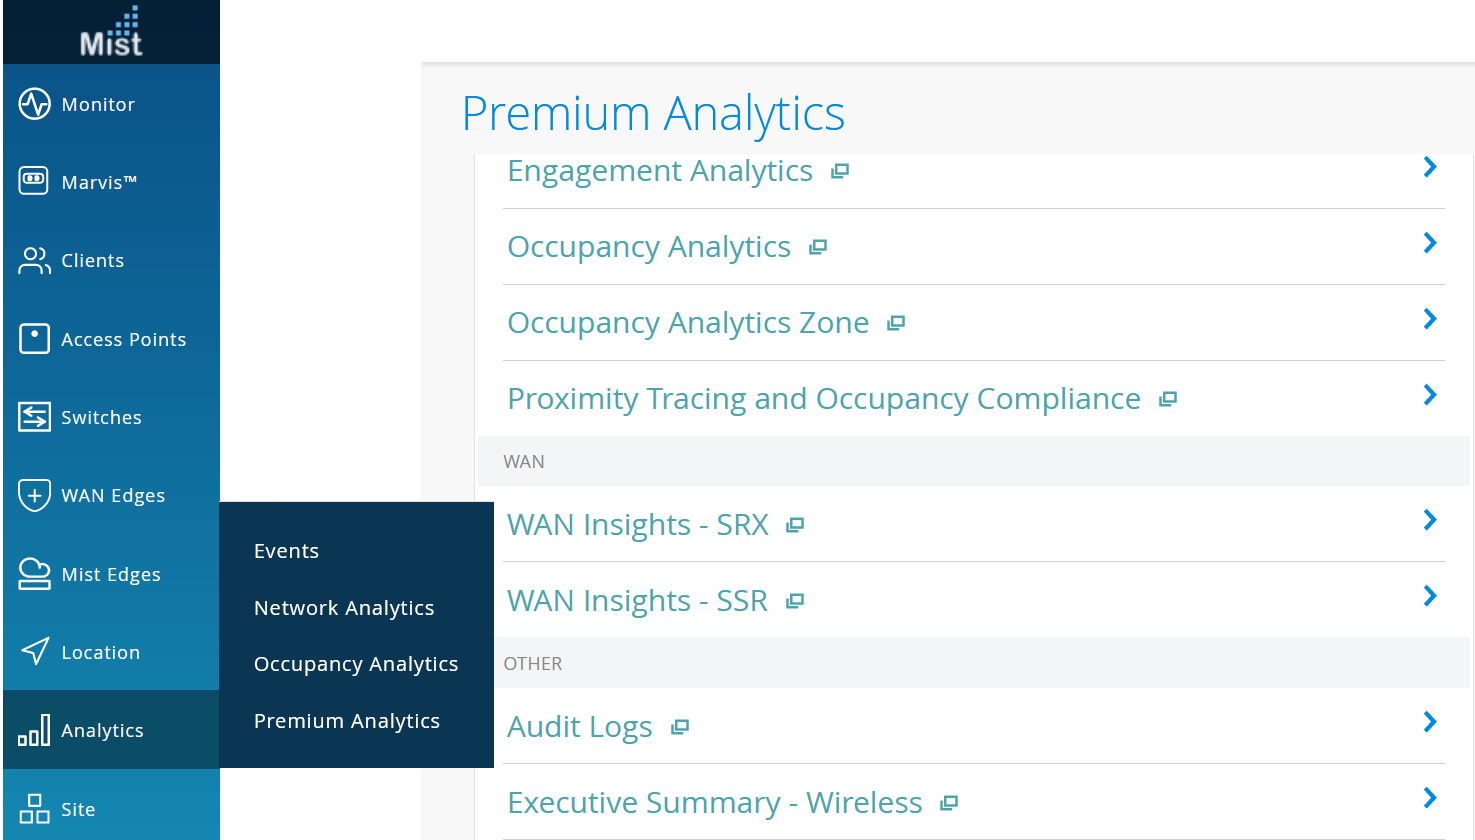 The WAN Insights - SSR page appears.
WAN Insights - SSR Tiles
The WAN Insights - SSR dashboard includes various tiles to provide the WAN performance data in graphical formats. You can use the dashboard to get an overview of the deployed WAN edge devices.
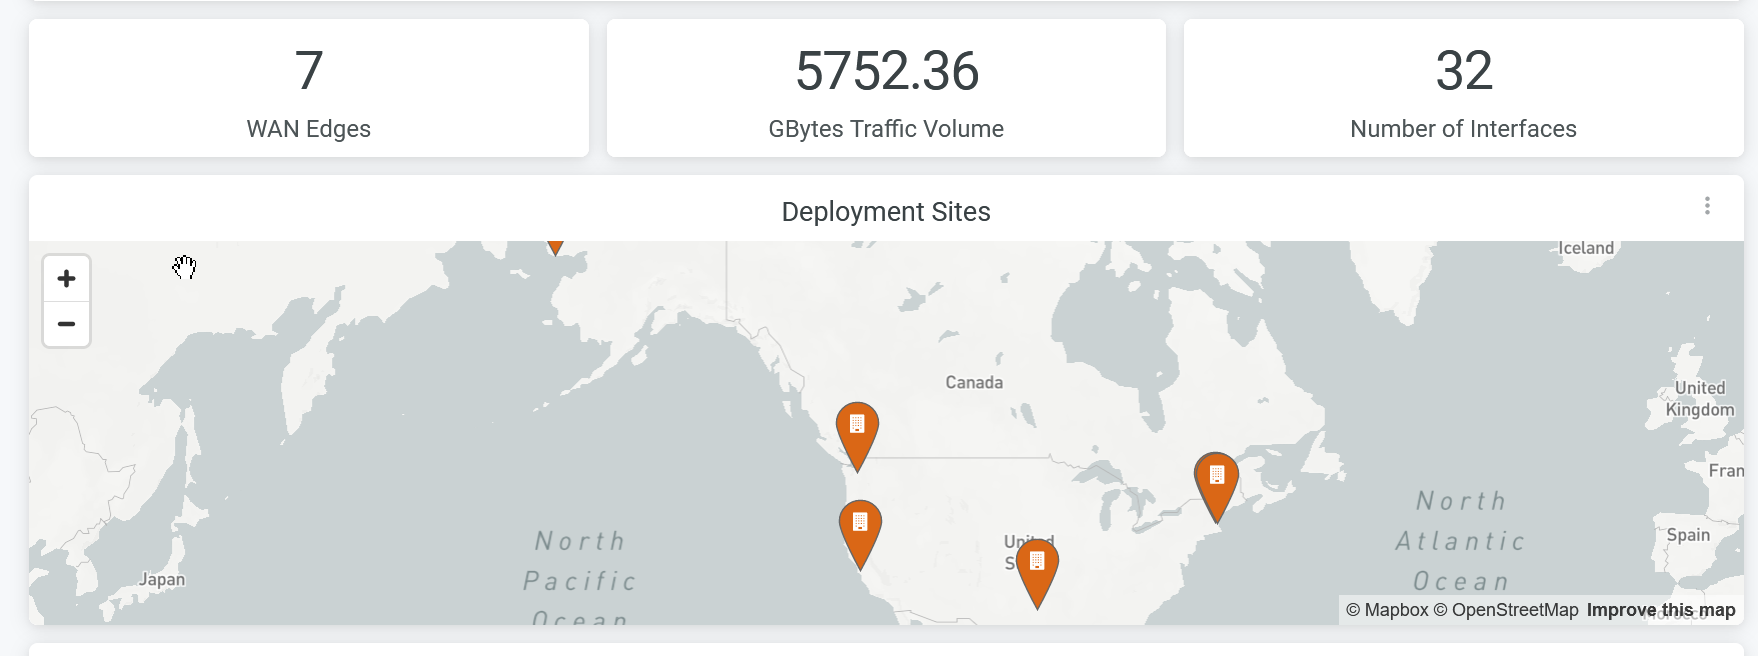
The Figure 2 tile displays:
The dashboard displays the summary of WAN deployment and traffic performance as shown in Figure 2.
- Deployed WAN Edge devices
- Traffic volume
- Number of Interfaces
- Deployment Sites
According to Figure 2, the WAN configuration includes 7 WAN edge devices across different sites as shown in the map. A total of 32 interfaces are active and traffic traveling through the network is 5752.36 GB.
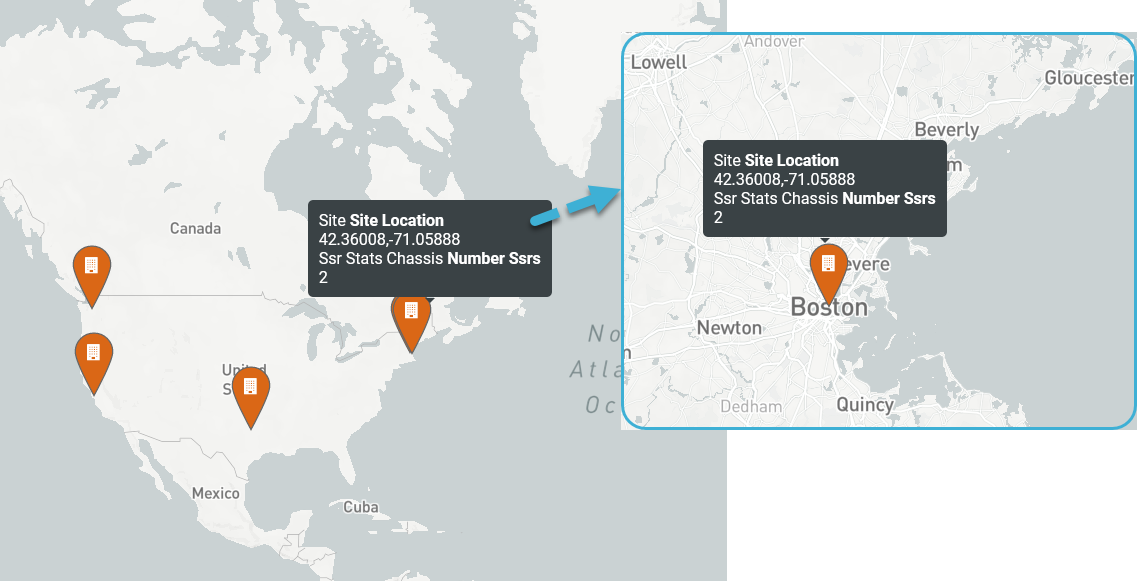
Hover over the map to see the site location. Double-click the map to zoom in—you'll see a detailed view of the map similar to the screenshot in Figure 3.
WAN SLE
Figure 4 shows WAN service-level expectation (SLEs).
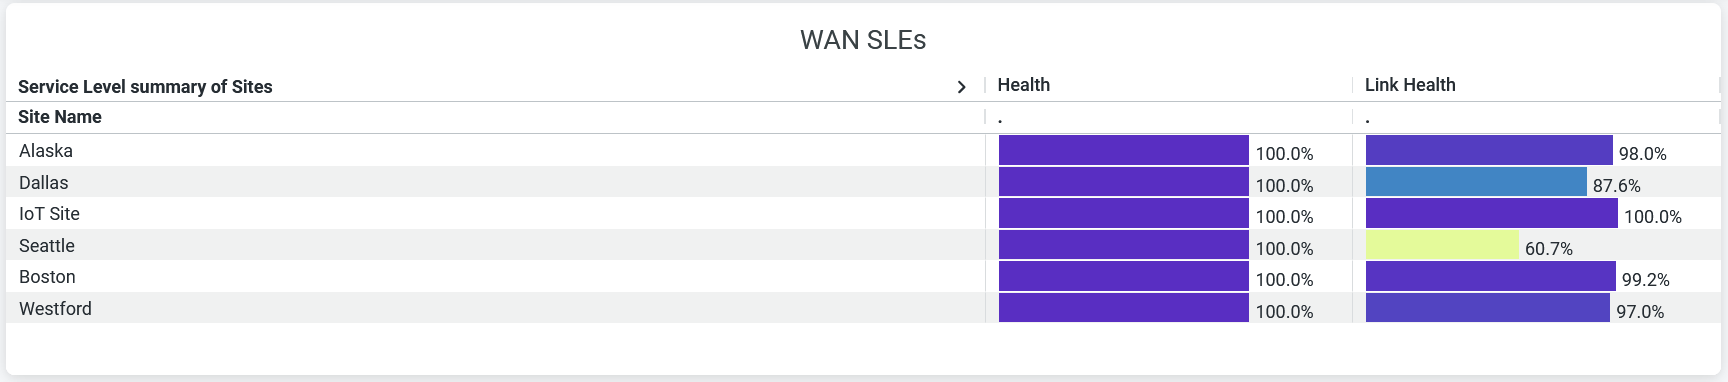
WAN SLE metrics indicate the performance of devices that serve the WAN functions in your network. WAN SLE metrics provide insights about the ability of a device to pass traffic. Therefore, these metrics are important to understand the experience of clients connected to a device.
The Juniper Mist portal displays each SLE metric as a percentage that represents the success rate of the metric.- Health—Indicates the health or performance of the WAN edge device as a percentage. In the above sample, a value of 100 percent for every site indicates that all the WAN edge devices perform at an optimal level.
- WAN Link Health—Indicates about link health. In the above sample, only 60.7 percent of links are healthy in the Seattle site and the remaining 39.3 percent of the links experience some issues.
Link Utilization
Figure 5 shows the Link Utilization tile.
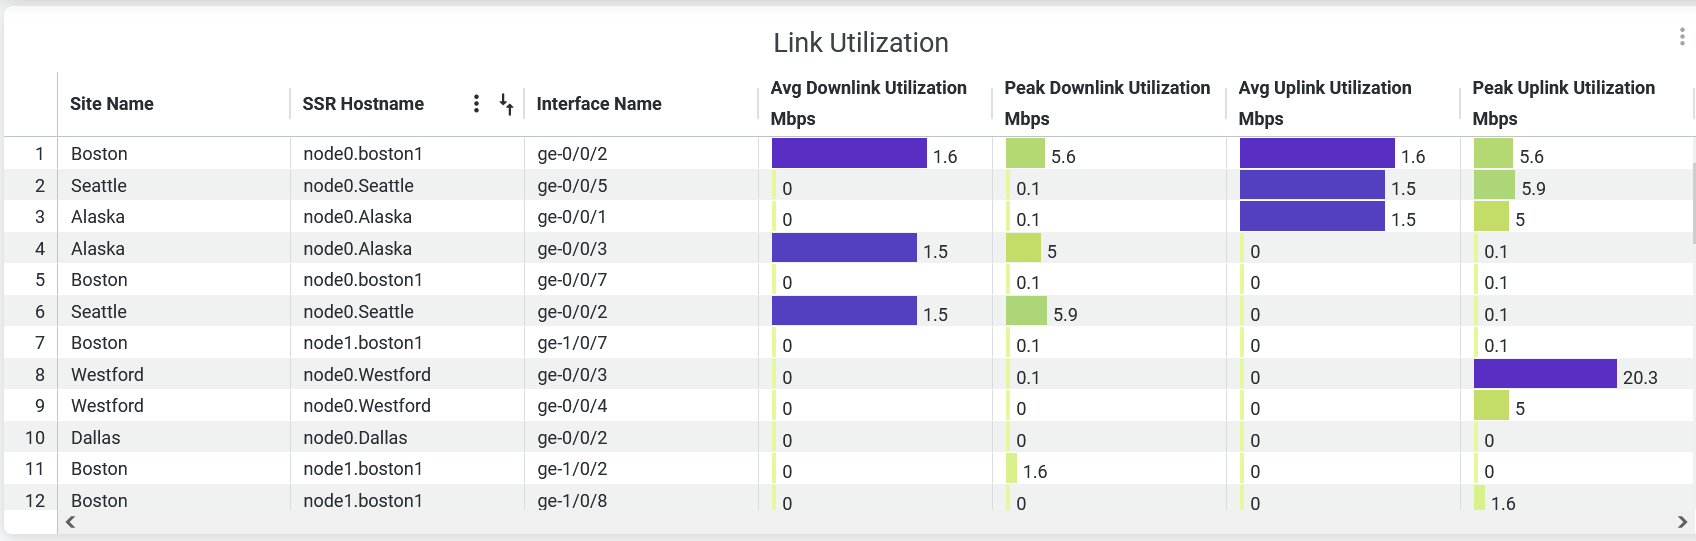
The Link Utilization tile displays the following parameters that represent the data transfer volume on the network interfaces:
-
Site Name—Name of the site where a WAN edge device is located.
-
SSR Hostname—Hostname of a WAN edge device.
-
Interface Name—Interface that a device uses for a WAN connection.
-
Average Downlink Utilization (Mbps)—Incoming traffic volume on an interface.
-
Peak Downlink Utilization (Mbps)—Peak incoming traffic volume on an interface.
-
Average Uplink Utilization (Mbps)—Outgoing traffic volume on an interface.
-
Peak Uplink Utilization (Mbps)—Peak outgoing traffic volume on an interface.
Link Metrics
Figure 6 shows the Link Metrics tile.
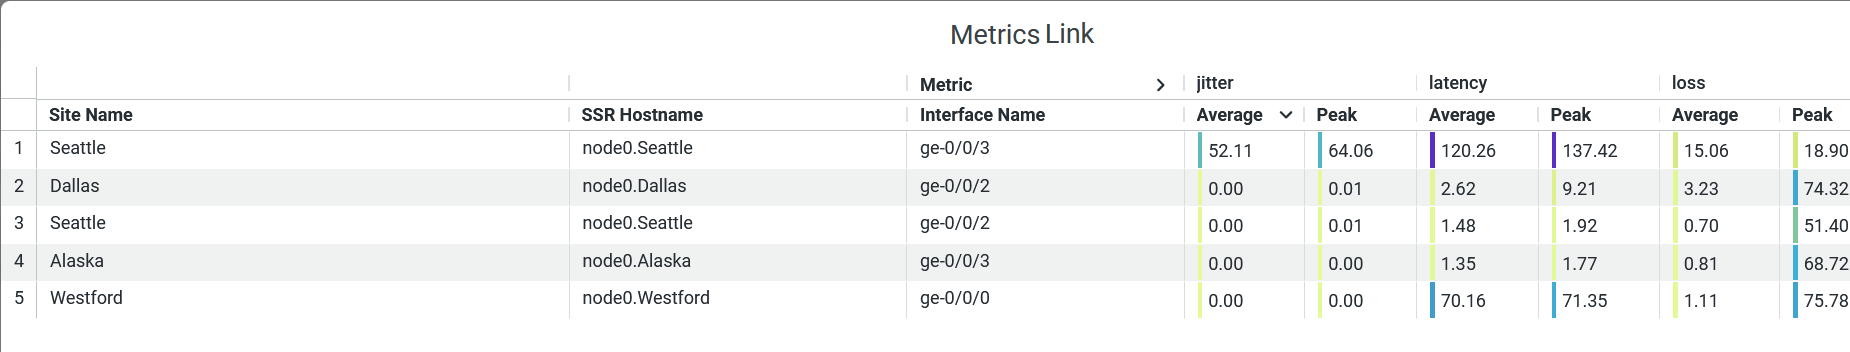
The Link Metrics tile displays the SLE metrics that represent jitter, latency, and packet loss for a WAN link on the network interfaces. The dashboard displays the following details:
-
Site Name—Name of the site where a WAN edge device is located.
-
SSR Hostname—Hostname of a WAN edge device.
-
Interface Name—Interface that the device uses for the WAN connection
-
Jitter—Average and peak values of jitter in microseconds. Jitter is the inconsistency of data packet arrival intervals. Jitter is calculated using the variation (standard deviation) of round-trip time (RTT) within a period of 5 through 10 minutes for a particular WAN link.
-
Latency—Average and peak values of latency in microseconds. Latency is indicates a delay in data transmission. Latency is calculated using the average RTT for traffic over a period of time.
-
Loss—Percentage of packets lost over a given period of time.
Link Metrics Trend
Figure 7 shows the Link Metrics Trend tile.
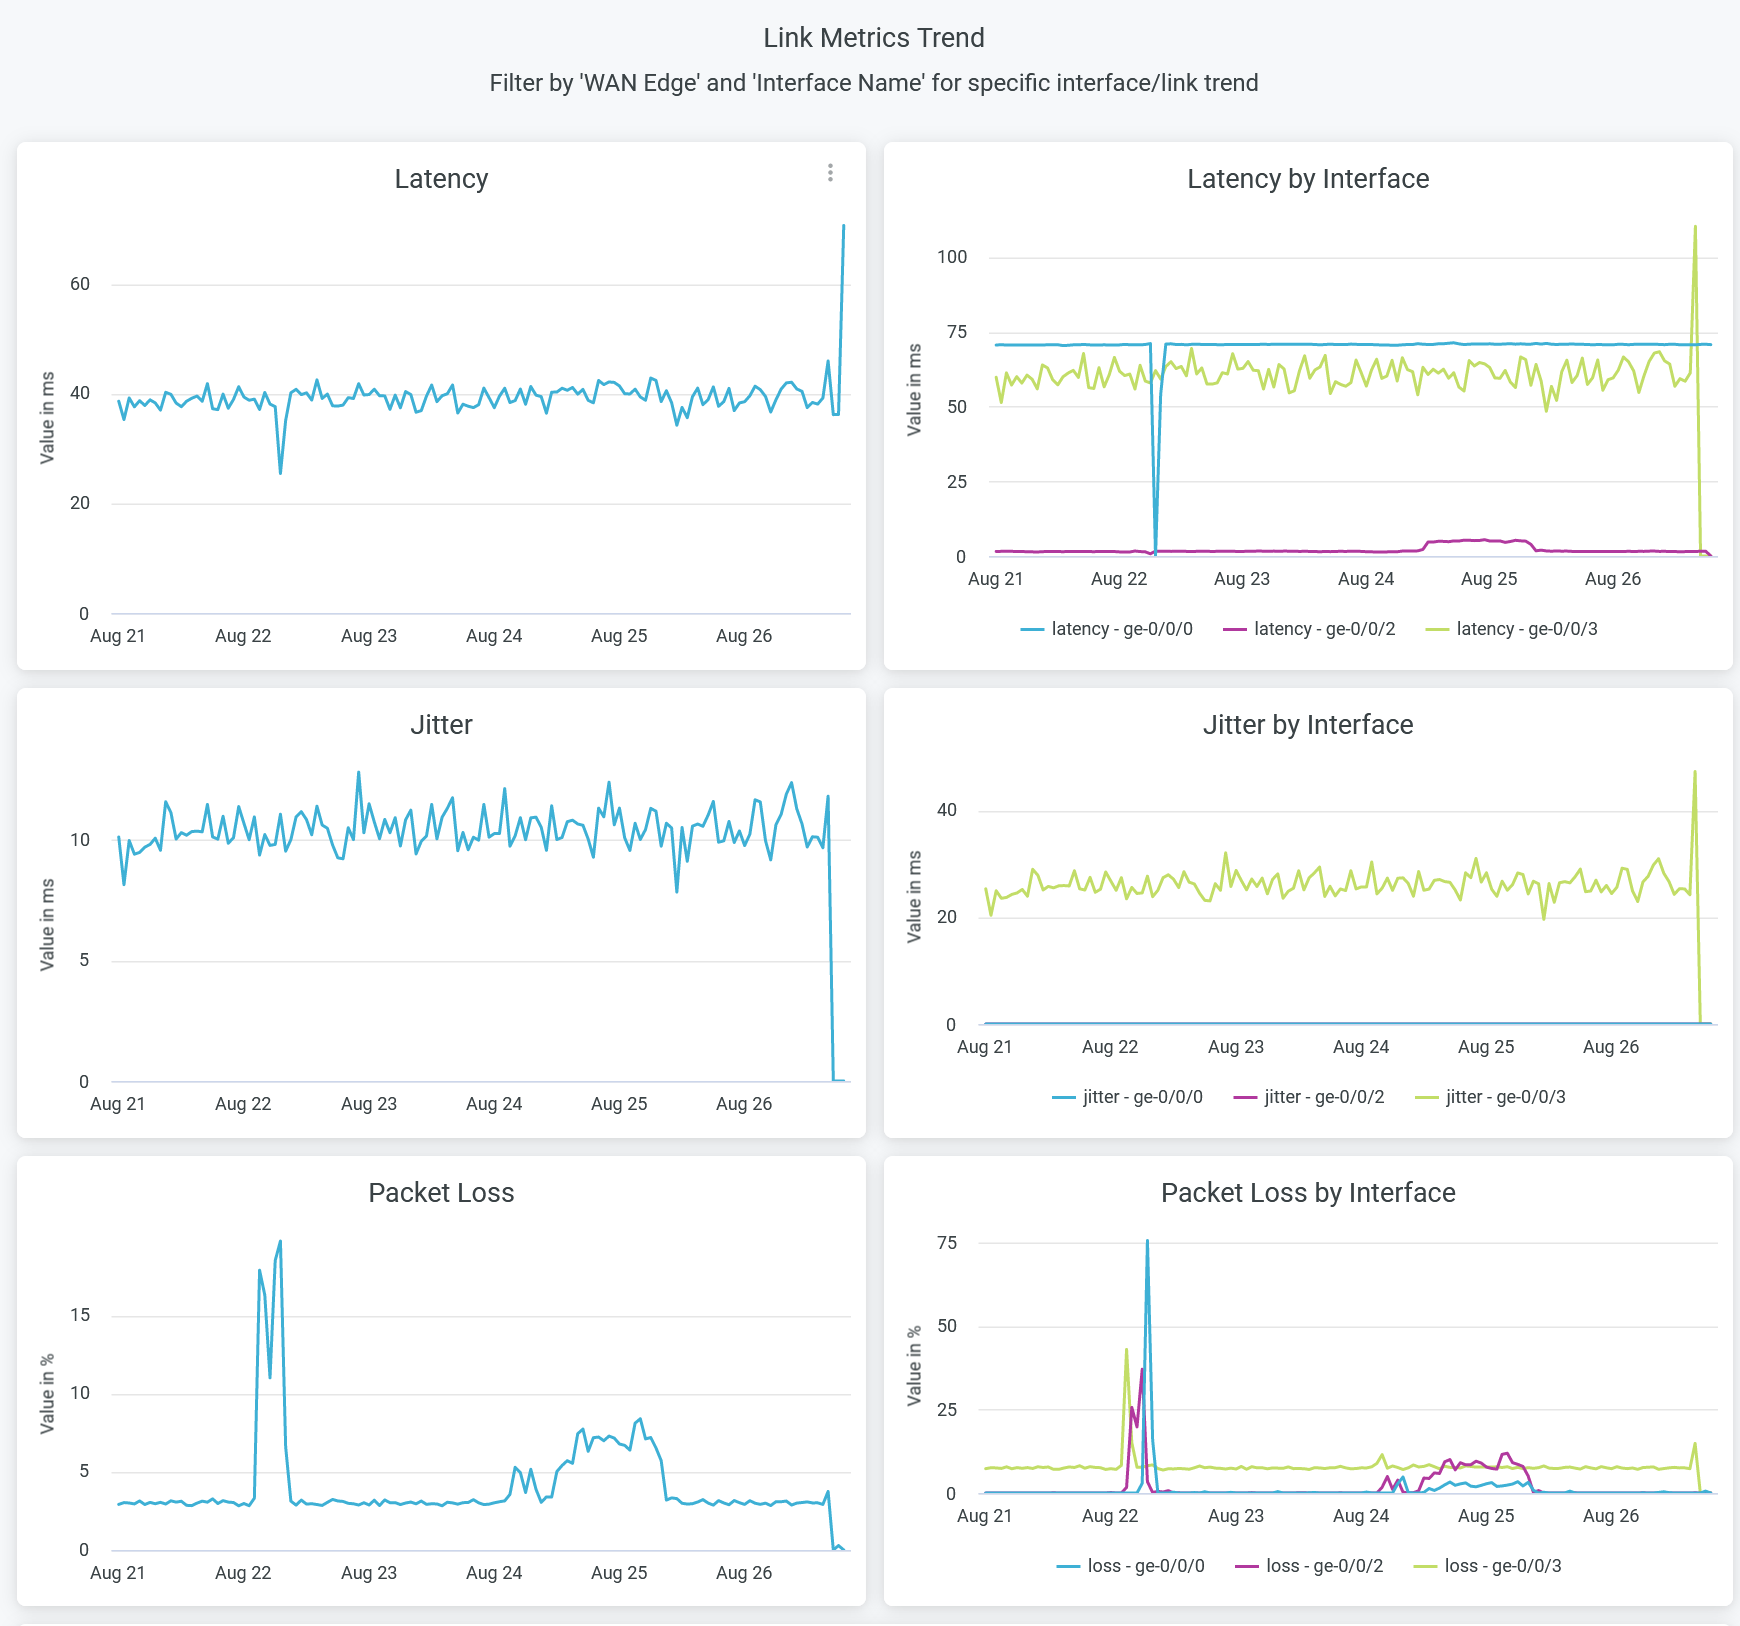
The Link Metrics Trend tile displays the SLE metrics that represent jitter, latency, and packet loss for a WAN link on the network interfaces over a period of time. You can filter by a WAN edge device or an interface name to get details specific details. You can place the cursor anywhere on the chart to see jitter, latency, and packet loss data at a particular time and date.
You can compare the performance of interfaces by viewing the analytics tile. The tile provides charts for overall latency, jitter, and packet loss, and interface-wise latency, jitter, and packet loss.
Traffic Insights
Figure 8 shows the Traffic Insights tile.
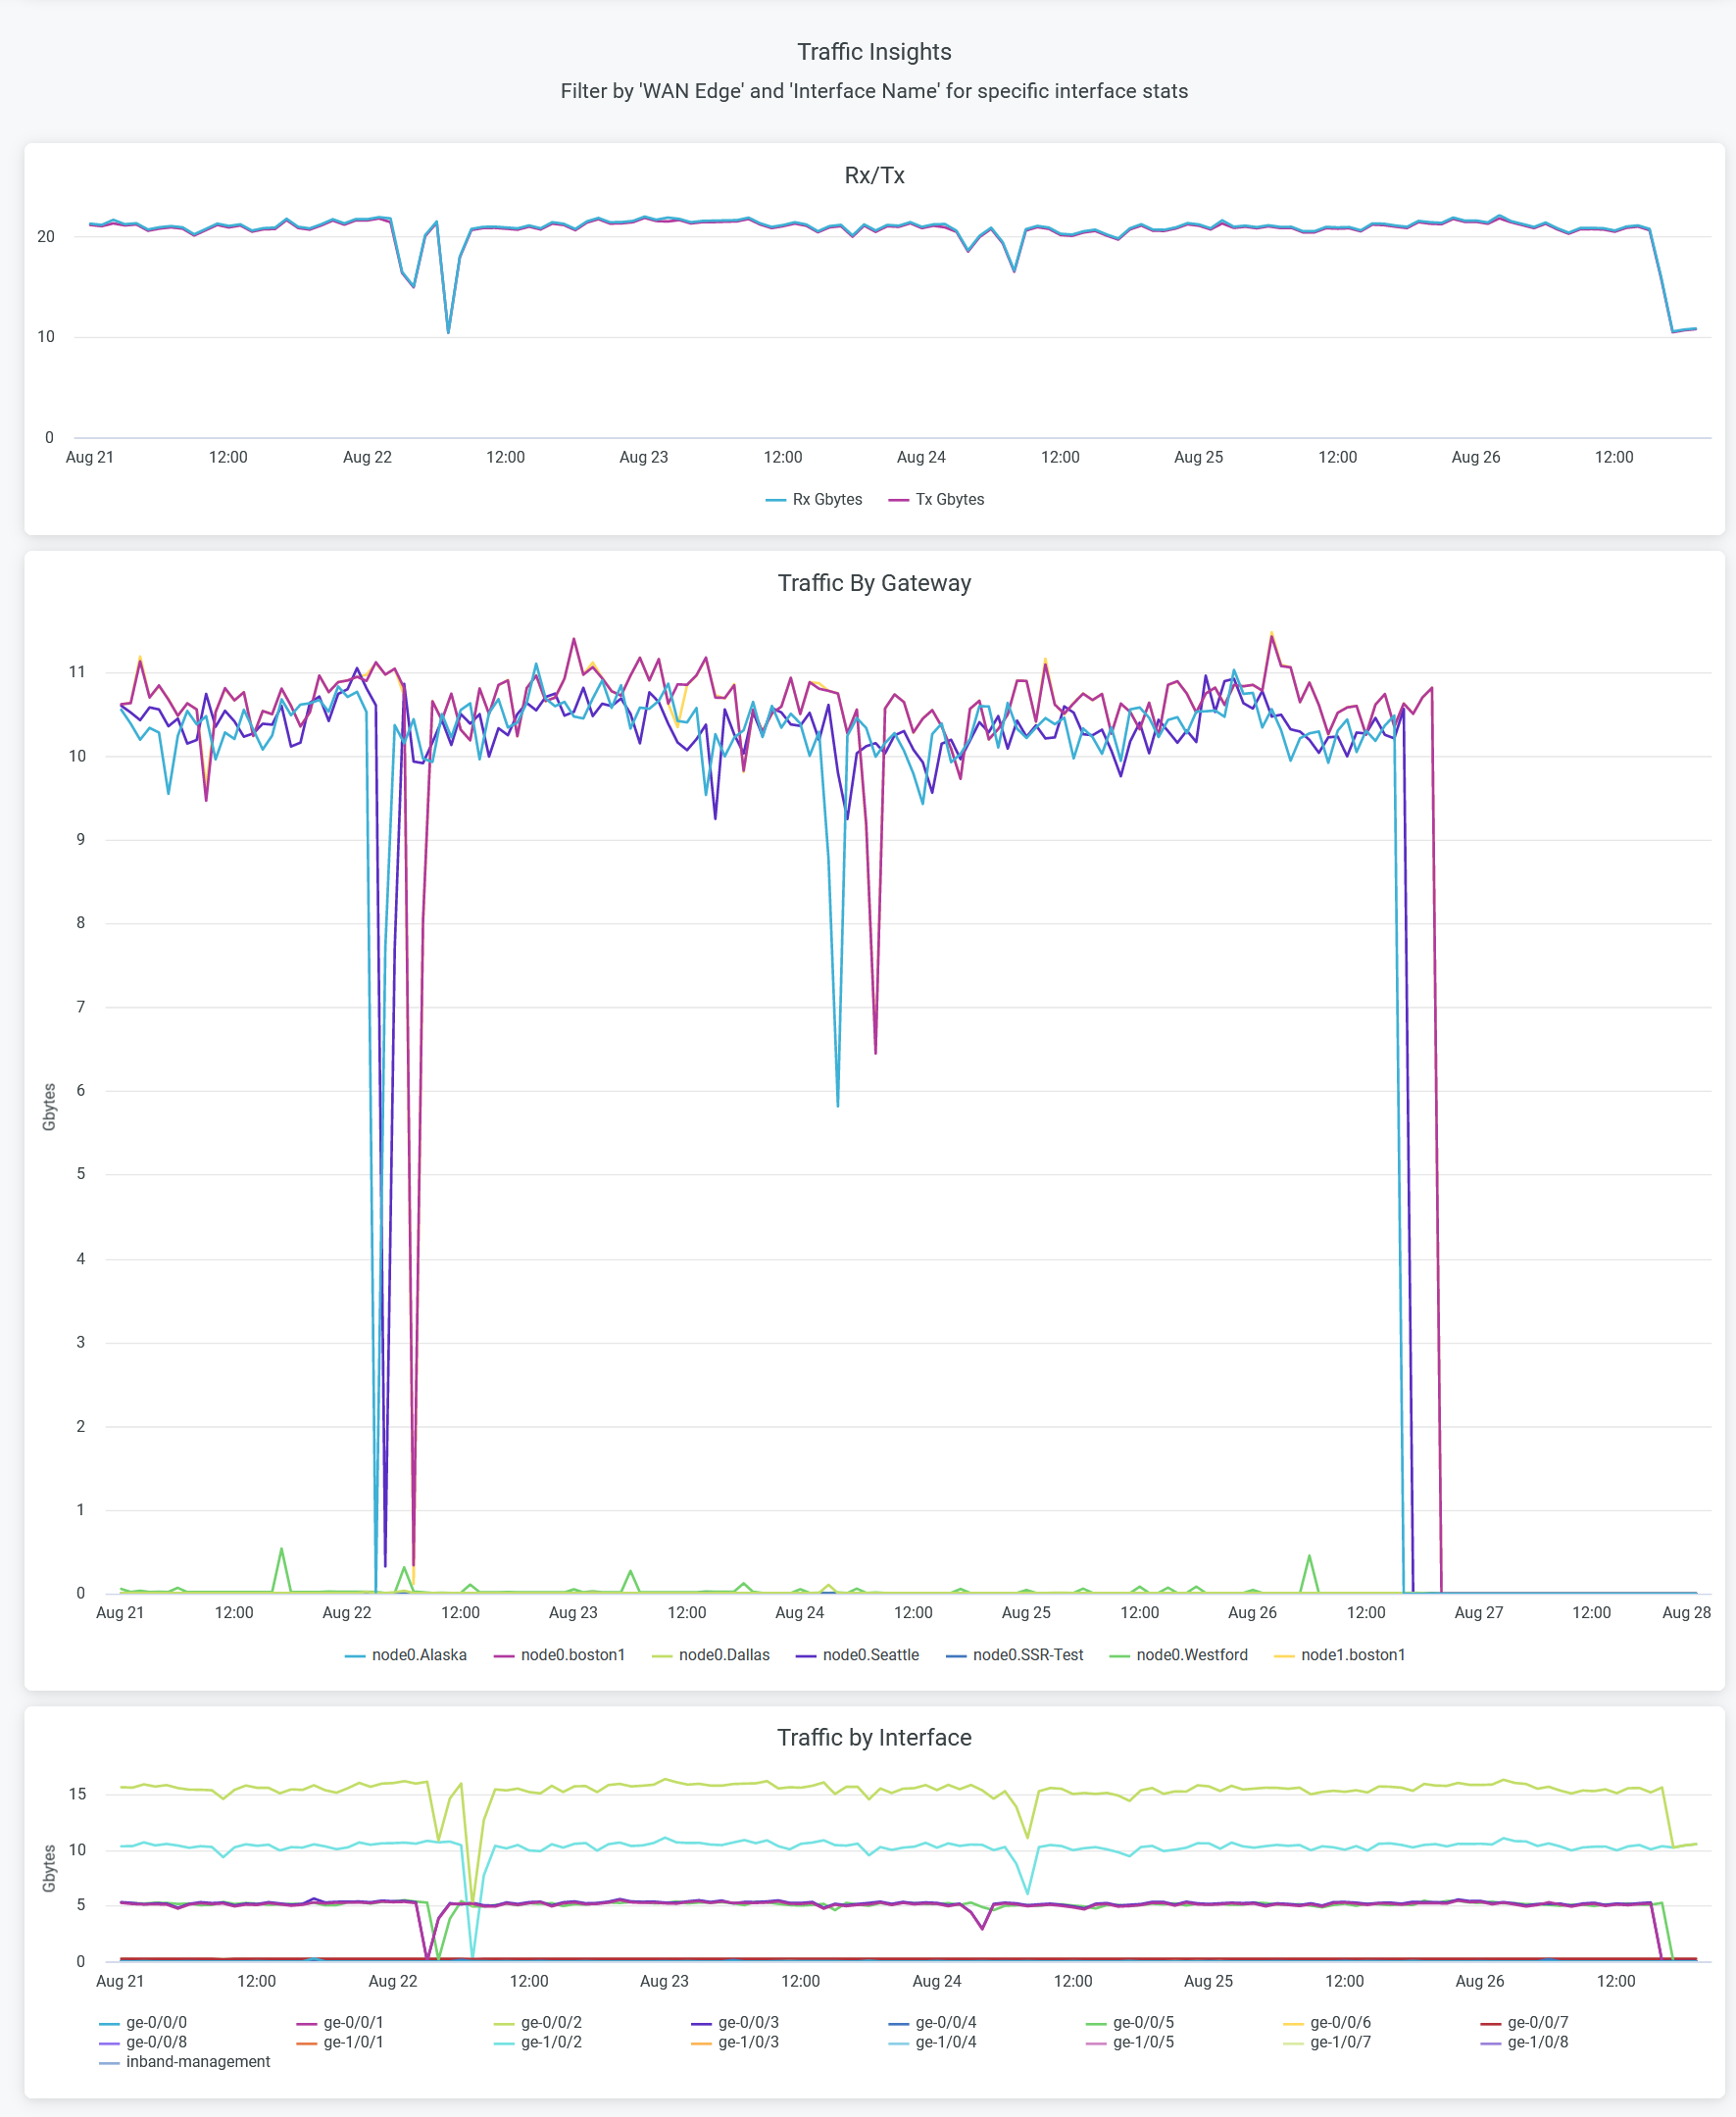
The Traffic Insights tile displays traffic flows over WAN edge devices and interfaces.
- The Rx/Tx chart displays transmitted and received data packets over a period of time.
- The Traffic by Gateway chart displays the volume of traffic that traverses through each WAN edge device over a period of time.
- The Traffic by Interface chart displays the volume of traffic that traverses through each interface of a WAN edge device over a period of time.
Applications Insights
Figure 9 shows the Applications Insights tile.
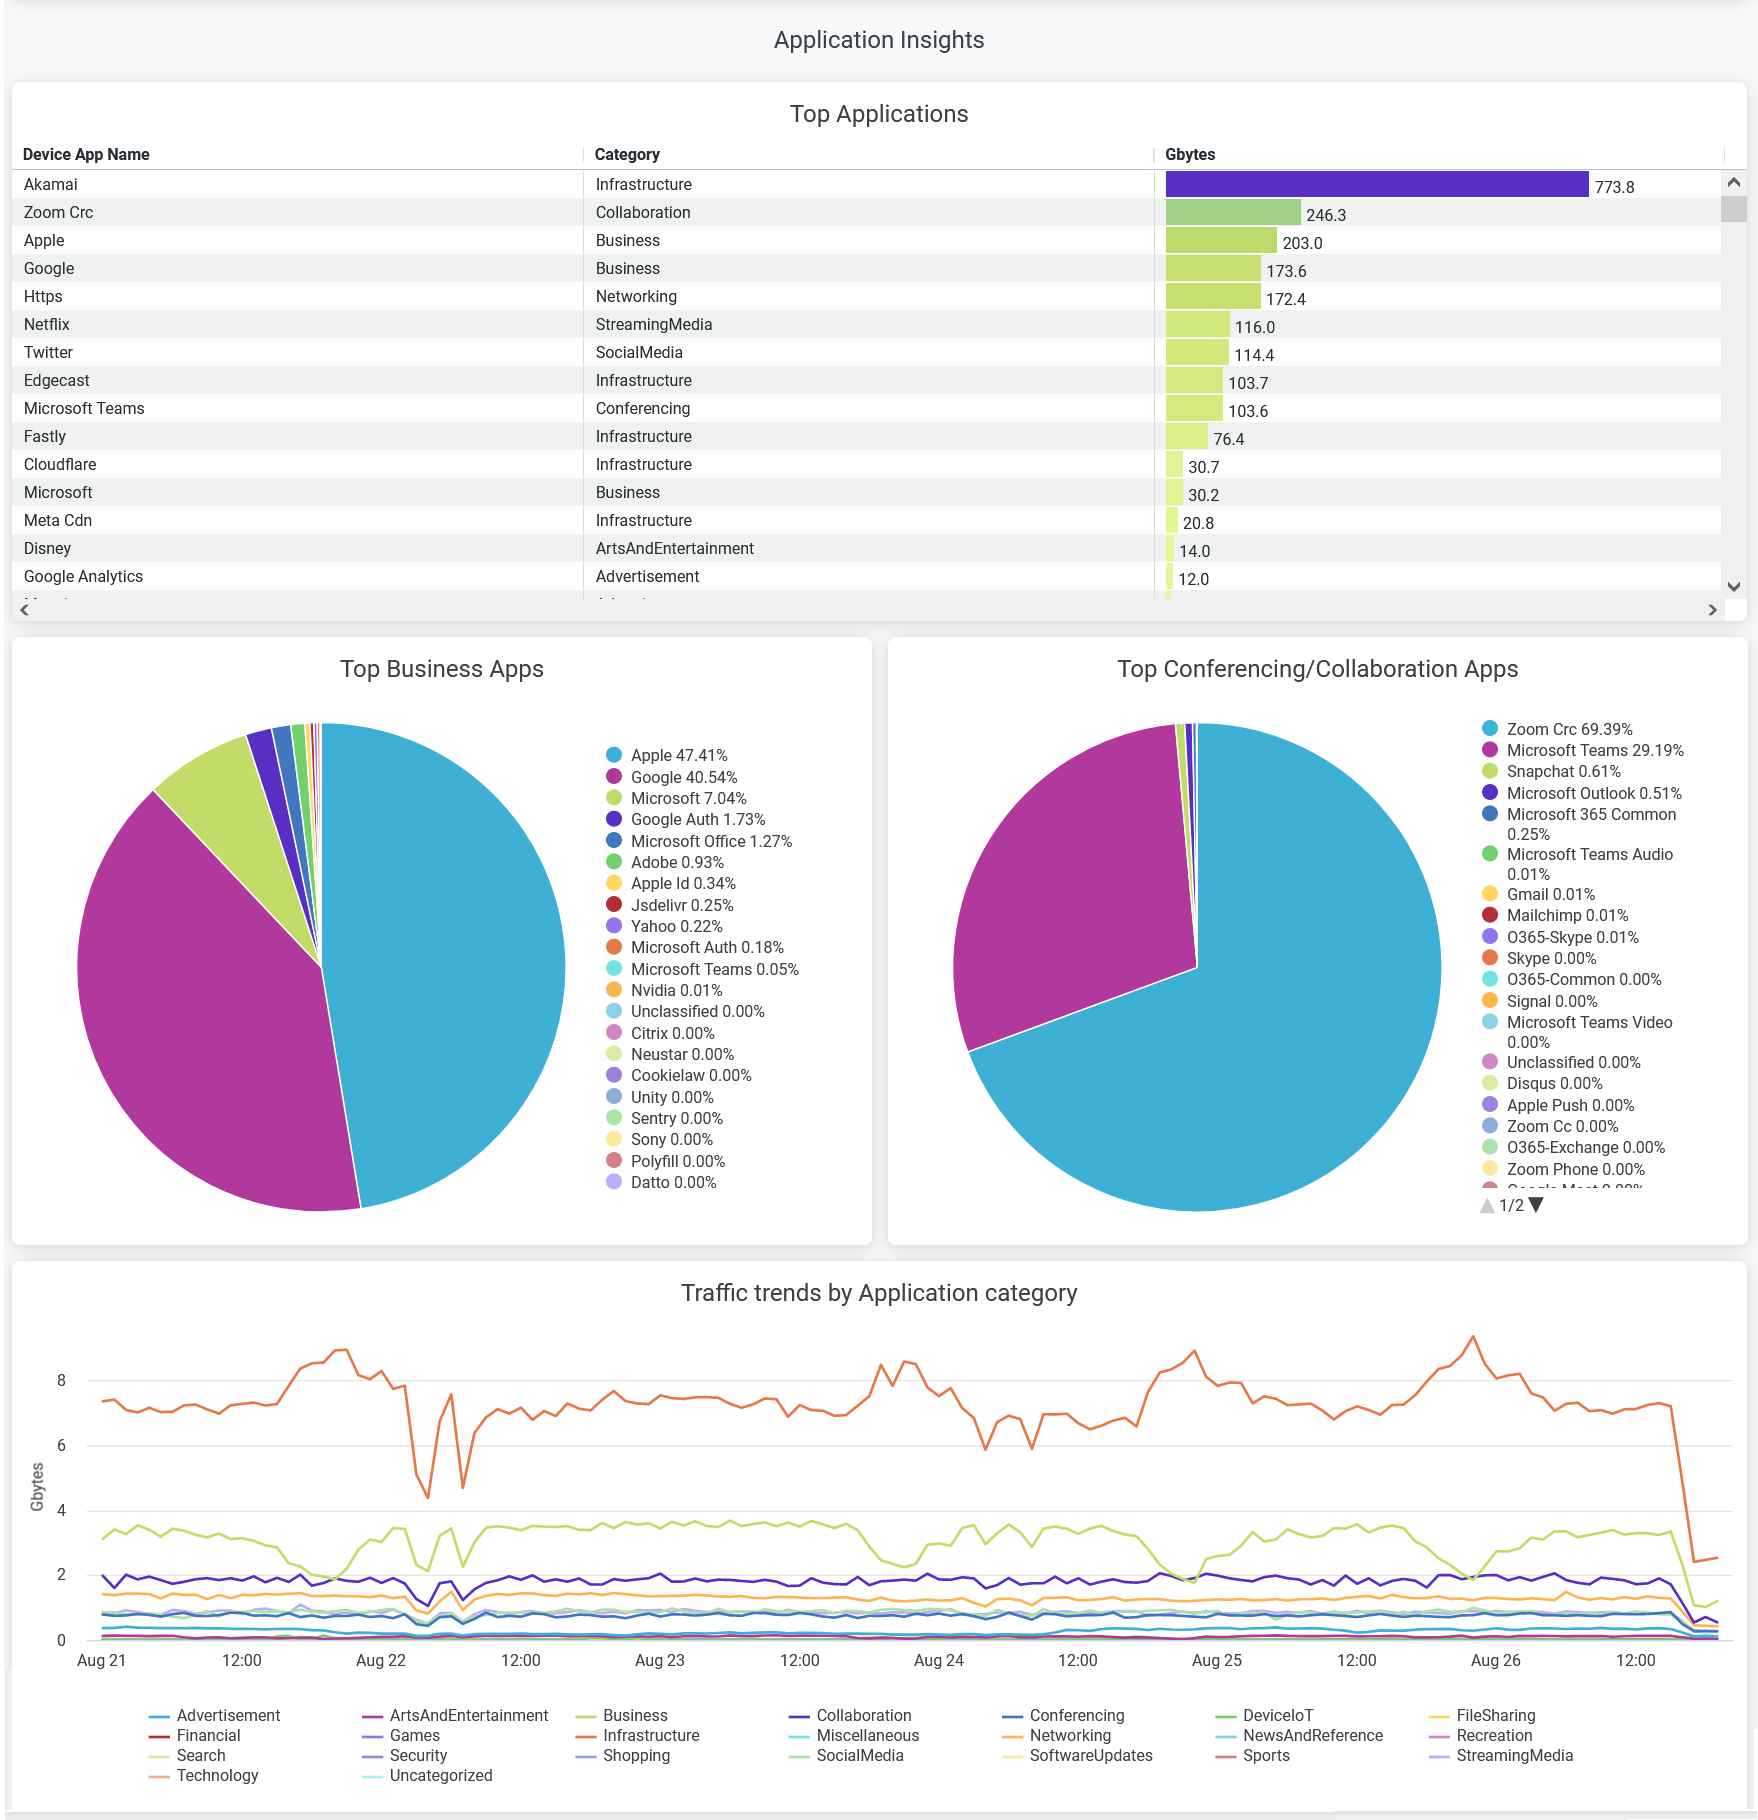
The Application Insights tile displays information about bandwidth consumed by a particular application or application category. You can spot the top applications in terms of various metrics by viewing these charts:
- The Top Applications chart displays the bandwidth usage by all the applications in a site.
- The Top Business Applications chart displays the bandwidth usage by all the applications belonging to a category of business.
- The Top Conferencing and Collaborating Apps chart displays the bandwidth usage by all the applications belonging to a category of collaboration.
- The Traffic Trends by Application category chart displays the bandwidth usage by all the application categories.