ON THIS PAGE
Wireless IDS
Monitor events and resolve issues with rogue access points (APs), rogue clients, and malicious neighbor APs.
Intrusion detection systems (IDS) is the process of monitoring the events occurring in your network and analyzing them for signs of possible incidents, violations, or imminent threats to your security policies. In this dashboard, you'll see the presence of following types of anomalous devices, which can cause security threats in the wireless environment:
- Rogue APs are any wireless access points installed on your network without authorization. Typically, this is an AP connected to the LAN via Ethernet cable connected, like a PC, to an access port. The intent of rogues can be malicious, such as to gain illicit access to the network, or benign, such as an employee setting up their own Wi-Fi hotspot to cover a perceived deadspot.
- Rogue clients are users connected to the rogue AP.
- Malicious Neighbor APs are not connected to your network, but they lurk in the vicinity and may have both the strongest signal and no authorization requirements. As a result, clients may connect to the neighbor AP, assuming it's yours and thus that it's secure.
Features and Benefits
-
Provides report on presence of anomalous devices such as rogue or unauthorized neighbor APs or clients.
-
Offers both a real-time and historical view of rogue and IDS events that helps in formulating your network security strategies.
Before you Begin
- Familiarize with the options available on your dashboard. See Figure 3.
-
See Juniper Mist Wireless Configuration Guide for wireless configuration details.
-
You need a license for using the Juniper Mist Premium Analytics dashboard. See Mist Premium Analytics Trial License.
Access Wireless IDS Dashboard
To access the AP Insights dashboard:
Wireless IDS Tiles
- Threats by Geo
- Threats by Type and Trend
- Rogue APs
- Neighbor APs
- Approved APs
- Security Alarms and Trend
- Security Alarms Details
Threats by Geo
The Threats by Geo tile shows the volume of traffic usage by APs for the selected duration.

You can view the site that are identified with threats in a map. Hover over the map to see the site location, type of device (neighbor, rogue, or rogue client) and the count of devices. Double-click the map to zoom in—you'll see a detailed view of the map. Click the highlighted area of the map to open a new window. The window displays the list of device details. Click Download to download the information.
Threats by Type and Trend
The tile shows the distribution of anomalous or threat device types and connection trends for the selected duration.

You can view the following details:
- Threats by Type—View the percentage of each anomalous or threat AP type. You can see the percentage of device type by using the legend next to the chart. To hide data for a threat type and see data for only the remaining ones, click the threat type in the legend below.
- Threats Trend—View the presence of total threat devices types over a period of time. Place your cursor on a line graph, which represents a threat type device, to see the exact number of unique devices belonging to that category. To hide data about a threat type from the chart and see data only about the remaining ones, click the threat type in the legend below.
Hover over the chart to view the number of anomalous or threat device at a given time.
Rogue APs
The tile shows the details of rogue APs present in the selected duration.

You can view the following details on the tile:
- SSID—SSID to which a rogue AP is connected.
- AP Name—Name of the AP.
- BSSID—Basic service set identification (BSSID)
- Type—Type of AP; rogue AP or rogue client.
- Channel—Channel number that rogue AP is connected to.
- RSSI—Received signal strength indicator (RSSI) of the rogue AP.
- Report Time—Time stamp of the report.
- First Observation—Time when the rogue AP is first detected.
- Last Observation—Time when the rogue AP is last seen.
- Site Name—Name of the site where a rogue AP is connected.
Neighbor APs
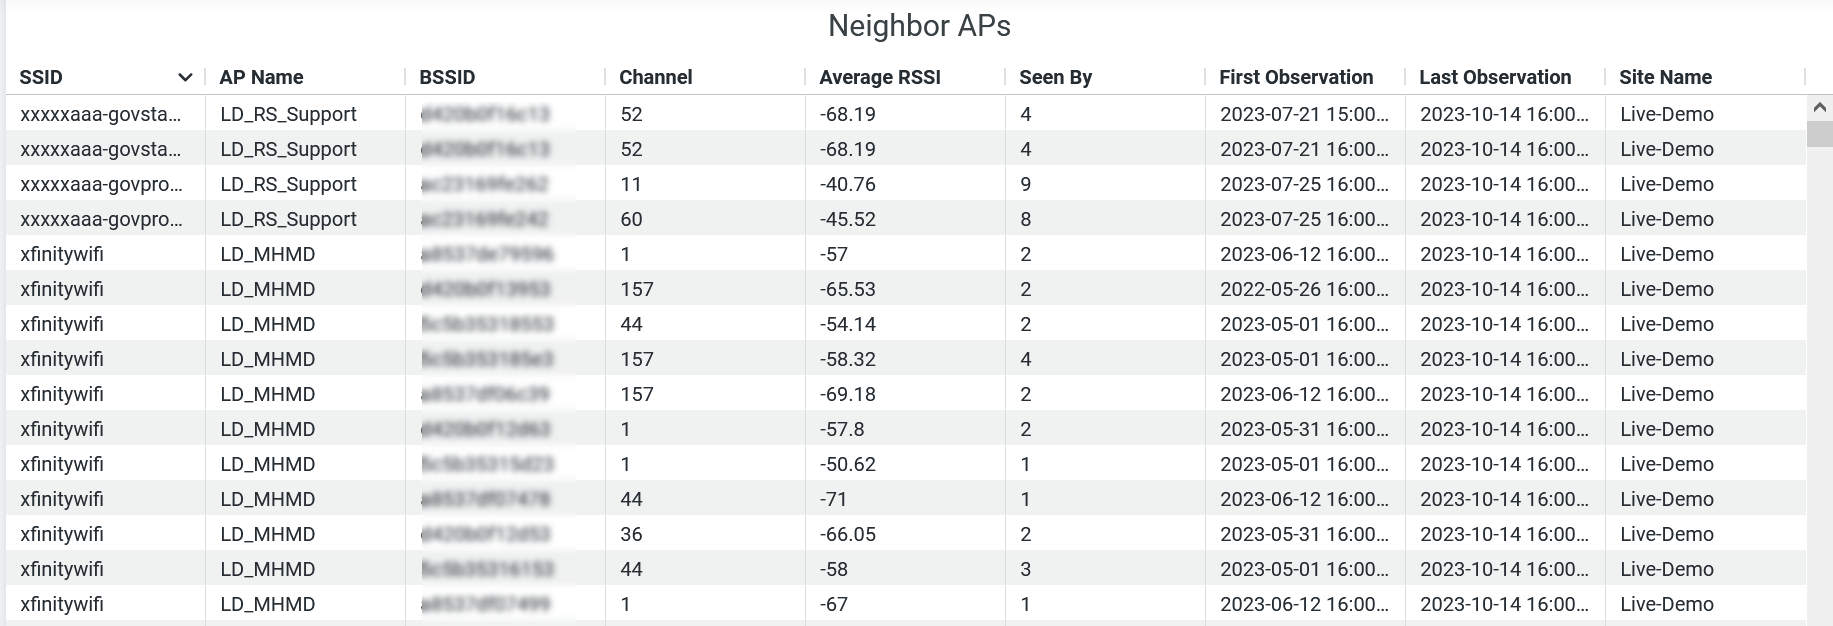
The tile shows the details of neighbor APs present in the selected duration.

You can view the following details on the tile:
- SSID—SSID to which a neighbor AP is connected.
- AP Name—Name of the AP.
- BSSID—Basic service set identification (BSSID) of the AP.
- Channel—Channel number that neighbor AP is connected to.
- Average RSSI—Average received signal strength indicator (RSSI) of the rogue AP.
- Seen By—Number of times that AP was seen in the proximity of your network.
- First Observation—Time when the neighbor AP is first detected.
- Last Observation—Time when the neighbor AP is last seen.
- Site Name—Name of the site where a neighbor AP is connected.
Approved APs
The tile shows the details of approved APs present in the selected duration.

You can see the number of clients connected to the approved APs and the site where the APs are present. Click the chart to open a new window with additional details. Here you can see the details such as client device names, WLAN SSID, and AP Name.
Security Alarms and Trend
The tile shows distribution of security alarms and alarms trends for the events.

You can view the following details:
- Security Alarms—View the percentage of alarm notification for the type of threat. You can see the percentage of notifications for threat types by using the legend next to the chart. To hide data for a threat type and see data for only the remaining ones, click the threat type in the legend below.
- Threats Trend—View the alarm notification trend over a period of time. Place your cursor on a line graph, which represents a threat type alarm, to see the exact number of alarms generated to that category. To hide data about a threat type notification from the chart and see data only about the remaining ones, click the threat type in the legend below.
Security Alarms Details
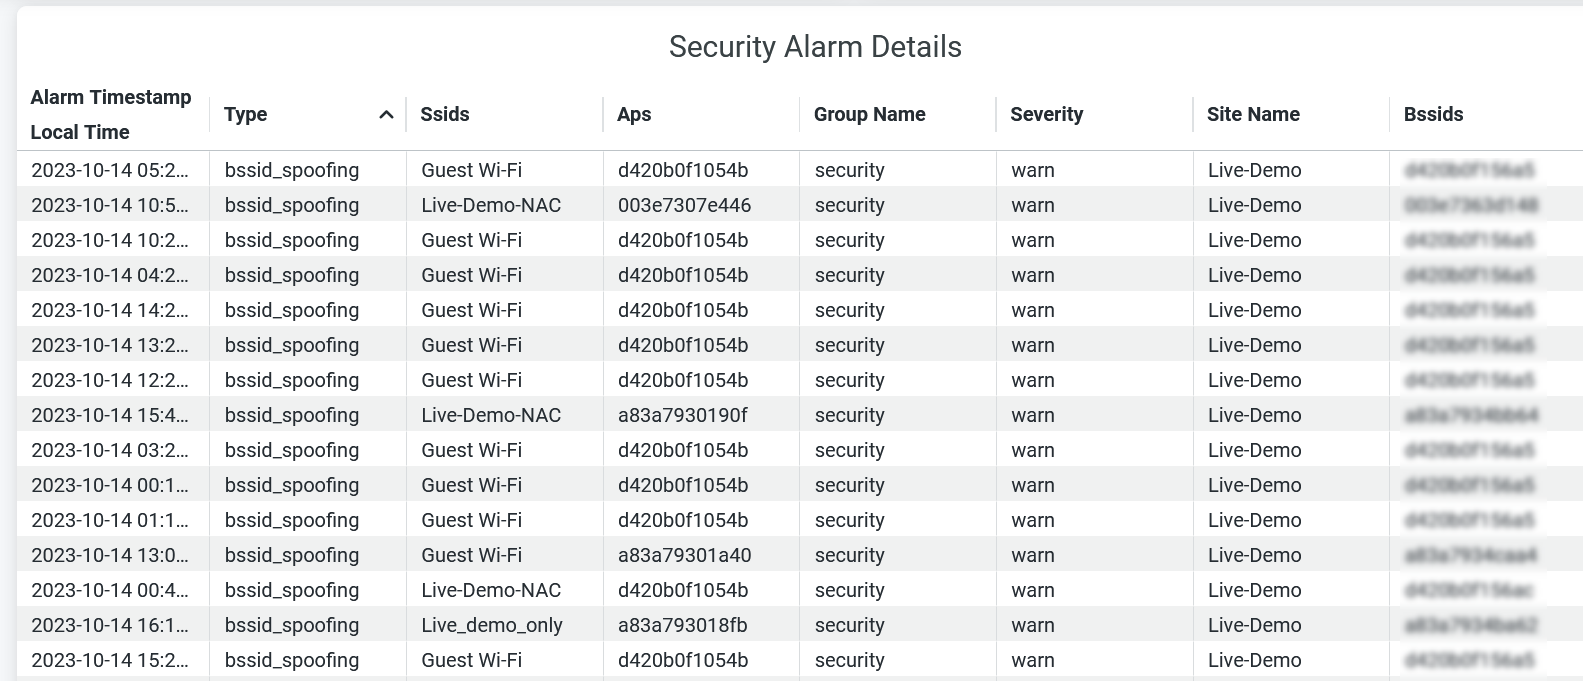
The tile shows the details of alarm notifications for the selected period.

You can view the following details on the tile:
- Alarm Timestamp—Local time when the report was generated.
- Type—Type of threat for which the alarm notification was generated.
- SSID—SSID to which a threat device is connected.
- APs—Name of the AP.
- Group Name—Type of alert.
- Severity—Event severity type (critical, informational, warning)
- BSSID—Basic service set identification (BSSID) of the AP.
- Site Name—Name of the site where a neighbor AP is connected.

