ON THIS PAGE
Troubleshoot Paragon Automation Installation
Read the following topics to learn how to troubleshoot typical problems that you might encounter during and after installation.
Resolve Merge Conflicts of the Configuration File
The init script creates the template configuration files. If you update
an existing installation using the same config-dir directory that was
used for the installation, the template files that the init script
creates are merged with the existing configuration files. Sometimes, this merging action
creates a merge conflict that you must resolve. The script prompts you about how to
resolve the conflict. When prompted, select one of the following
options:
-
C—You can retain the existing configuration file and discard the new template file. This is the default option.
-
n—You can discard the existing configuration file and reinitialize the template file.
-
m—You can merge the files manually. Conflicting sections are marked with lines starting with
<<<<<<<<,||||||||,========, and>>>>>>>>. You must edit the file and remove the merge markers before you proceed with the update. -
d—You can view the differences between the files before you decide how to resolve the conflict.
Resolve Common Backup and Restore Issues
Suppose you destroy an existing cluster and redeploy a software image on the same cluster nodes. In such a scenario, if you try to restore a configuration from a previously backed-up configuration folder, the restore operation might fail. The restore operation fails because the mount path for the backed-up configuration is now changed. When you destroy an existing cluster, the persistent volume is deleted. When you redeploy the new image, the persistent volume gets re-created in one of the cluster nodes wherever space is available, but not necessarily in the same node as it was present in previously. As a result, the restore operation fails.
To work around these backup and restore issues:
-
Determine the mount path of the new persistent volume.
-
Copy the contents of the previous persistent volume's mount path to the new path.
-
Retry the restore operation.
View Installation Log Files
If the deploy script fails, you must check the installation log files in
the config-dir directory. By default, the config-dir
directory stores six zipped log files. The current log file is saved as
log, and the previous log files are saved as
log.1 through log.5 files. Every time you run
the deploy script, the current log is saved, and the oldest one is
discarded.
You typically find error messages at the end of a log file. View the error message, and fix the configuration.
View Log Files in Grafana
Grafana is an open-source data visualization tool. You use the Grafana UI to create and to view charts, graphs, and other visuals to help organize and understand data. You can create dashboards to monitor the status of devices, and you can also query data and view the results from the UI. Grafana UI renders data from Paragon Automation time series database (TSDB). For more information, see Grafana Documentation.
To view logs in the Grafana application:
Troubleshooting Using the kubectl Interface
kubectl (Kube Control) is a command-line utility that interacts with the Kubernetes API, and the most common command line took to control Kubernetes clusters.
You can issue kubectl commands on the primary node right after installation. To issue
kubectl commands on the worker nodes, you need to copy the admin.conf
file and set the kubeconfig environment variable or use the
export KUBECONFIG=config-dir /admin.conf command. The
admin.conf file is copied to the config-dir
directory on the control host as part of the installation process.
You use the kubectl command-line tool to communicate with the Kubernetes API and obtain information about API resources such as nodes, pods, and services, show log files, as well as create, delete, or modify those resources.
The syntax of kubectl commands is as follows:
kubectl [command] [TYPE] [NAME] [flags]
[command] is simply the action that you want to execute.
You can use the following command to view a list of kubectl commands:
root@primary-node:/# kubectl [enter]
You can ask for help, to get details and list all the flags and options associated with a particular command. For example:
root@primary-node:/# kubectl get -h
To verify and troubleshoot the operations in Paragon Automation, you'll use the following commands:
| [command] | Description |
|---|---|
| get |
Display one or many resources. The output shows a table of the most important information about the specified resources. |
| describe | Show details of a specific resource or a group of resources. |
| explain | Documentation of resources. |
| logs | Display the logs for a container in a pod. |
| rollout restart | Manage the rollout of a resource. |
| edit | Edit a resource. |
[TYPE] represents the type of resource that you want to view. Resource
types are case-insensitive, and you can use singular, plural, or abbreviated forms.
For example, pod, node, service, or deployment. For a complete list of resources, and allowed abbreviations (example, pod = po), issue this command:
kubectl api-resources
To learn more about a resource, issue this command:
kubectl explain [TYPE]
For example:
root@primary-node:/# kubectl explain pod
KIND:     Pod
VERSION:  v1

DESCRIPTION:
     Pod is a collection of containers that can run on a host. This resource is
     created by clients and scheduled onto hosts.
---more---
[NAME] is the name of a specific resource—for example, the name of a
service or pod. Names are case-sensitive.
root@primary-node:/# kubectl get pod pod_name
[flags] provide additional options for a command. For example,
-o lists more attributes for a resource. Use help (-h) to get information
about the available flags.
Note that most Kubernetes resources (such as pods and services) are in some namespaces, while others are not (such as nodes).
Namespaces provide a mechanism for isolating groups of resources within a single cluster. Names of resources need to be unique within a namespace, but not across namespaces.
When you use a command on a resource that is in a namespace, you must include the namespace as part of the command. Namespaces are case-sensitive. Without the proper namespace, the specific resource you are interested in might not be displayed.
root@primary-node:/# kubectl get services mgd
Error from server (NotFound): services "mgd" not found

root@primary-node:/# kubectl get services mgd -n healthbot
NAME   TYPE        CLUSTER-IP    EXTERNAL-IP   PORT(S)                    AGE
mgd    ClusterIP   10.102.xx.12   <none>        22/TCP,6500/TCP,8082/TCP   18h
You can get a list of all namespaces by issuing the kubectl get namespace
command.
If you want to display resources for all namespaces, or you are not sure what namespaces
the specific resource you are interested in belongs to, you can enter
--all-namespaces or - A.
For more information about Kubernetes, see:
- https://kubernetes.io/docs/reference/kubectl/overview/
- https://kubernetes.io/docs/reference/generated/kubectl/kubectl-commands
Use the following topics to troubleshoot and view installation details using the kubectl interface.
- View Node Status
- View Pod Status
- View Detailed Information About a Pod
- View the Logs for a Container in a Pod
- Run a Command on a Container in a Pod
- View Services
- Frequently Used kubectl Commands
View Node Status
Use the kubectl get nodes command, abbreviated as the kubectl
get no command, to view the status of the cluster nodes. The status of the
nodes must be Ready, and the roles must be either
control-plane or none. For example:
root@primary-node:~# kubectl get no
NAME           STATUS   ROLES                  AGE    VERSION
10.49.xx.x1   Ready    control-plane,master   5d5h   v1.20.4
10.49.xx.x6   Ready    <none>                 5d5h   v1.20.4
10.49.xx.x7   Ready    <none>                 5d5h   v1.20.4
10.49.xx.x8   Ready    <none>                 5d5h   v1.20.4
If a node is not Ready, verify whether the kubelet process is running.
You can also use the system log of the node to investigate the issue.
To verify kubelet: root@primary-node:/# kubelet
View Pod Status
Use the kubectl get po –n namespace
or
kubectl get po -A command to view the status of a pod. You can
specify an individual namespace (such as healthbot,
northstar, and common) or you can use the
-A parameter to view the status of all namespaces. For example:
root@primary-node:~# kubectl get po -n northstar
NAME                                  READY   STATUS      RESTARTS   AGE
bmp-854f8d4b58-4hwx4                  3/3     Running     1          30h
dcscheduler-55d69d9645-m9ncf          1/1     Running     1          7h13m
The status of healthy pods must be Running or
Completed, and the number of ready containers should match the total.
If the status of a pod is not Running or if the number of containers
does not match, use the kubectl describe po or kubectl log (POD
| TYPE/NAME) [-c CONTAINER] command to troubleshoot the issue further.
View Detailed Information About a Pod
Use the kubectl describe po -n namespace
pod-name
command to view detailed information about a
specific pod. For example:
root@primary-node:~# kubectl describe po -n northstar bmp-854f8d4b58-4hwx4
Name:         bmp-854f8d4b58-4hwx4
Namespace:    northstar
Priority:     0
Node:         10.49.xx.x1/10.49.xx.x1
Start Time:   Mon, 10 May 2021 07:11:17 -0700
Labels:       app=bmp
              northstar=bmp
              pod-template-hash=854f8d4b58
…
View the Logs for a Container in a Pod
Use the kubectl logs -n namespace
pod-name [-c container-name] command to
view the logs for a particular pod. If a pod has multiple containers, you must specify
the container for which you want to view the logs. For example:
root@primary-node:~# kubectl logs -n common atom-db-0 | tail -3
2021-05-31 17:39:21.708 36 LOG {ticks: 0, maint: 0, retry: 0}
2021-05-31 17:39:26,292 INFO: Lock owner: atom-db-0; I am atom-db-0
2021-05-31 17:39:26,350 INFO: no action.  i am the leader with the lock
Run a Command on a Container in a Pod
Use the kubectl exec –ti –n
namespace
pod-name [-c
container-name] -- command-line
command to run commands on a container inside a pod. For example:
root@primary-node:~# kubectl exec -ti -n common atom-db-0 -- bash

 ____        _ _
/ ___| _ __ (_) | ___
\___ \| '_ \| | |/ _ \
 ___) | |_) | | | (_) |
|____/| .__/|_|_|\___/
      |_|

This container is managed by runit, when stopping/starting services use sv

Examples:

sv stop cron
sv restart patroni

Current status: (sv status /etc/service/*)

run: /etc/service/cron: (pid 29) 26948s
run: /etc/service/patroni: (pid 27) 26948s
run: /etc/service/pgqd: (pid 28) 26948s
root@atom-db-0:/home/postgres#
After you run exec the command, you get a bash shell into the Postgres
database server. You can access the bash shell inside the container, and run commands to
connect to the database. Not all containers provide a bash shell. Some containers
provide only SSH, and some containers do not have any shells.
View Services
Use the kubectl get svc -n namespace
or
kubectl get svc -A command to view the cluster services. You can
specify an individual namespace (such as healthbot,
northstar, and common), or you can use the
-A parameter to view the services for all namespaces. For
example:
root@primary-node:~# kubectl get svc -A --sort-by spec.type
NAMESPACE              NAME                              TYPE           EXTERNAL-IP    PORT(S)
…
healthbot              tsdb-shim                         LoadBalancer   10.54.xxx.x3   8086:32081/TCP
healthbot              ingest-snmp-proxy-udp             LoadBalancer   10.54.xxx.x3   162:32685/UDP
healthbot              hb-proxy-syslog-udp               LoadBalancer   10.54.xxx.x3   514:31535/UDP
ems                    ztpservicedhcp                    LoadBalancer   10.54.xxx.x3   67:30336/UDP
ambassador             ambassador                        LoadBalancer   10.54.xxx.x2   80:32214/TCP,443:31315/TCP,7804:32529/TCP,7000:30571/TCP
northstar              ns-pceserver                      LoadBalancer   10.54.xxx.x4   4189:32629/TCP
…
In this example, the services are sorted by type, and only services of type
LoadBalancer are displayed. You can view the services that are
provided by the cluster and the external IP addresses that are selected by the load
balancer to access those services.
You can access these services from outside the cluster. The external IP address is exposed and accessible from devices outside the cluster.
Frequently Used kubectl Commands
-
List the replication controllers:
# kubectl get –n namespace deploy
# kubectl get –n namespace statefulset
-
Restart a component:
kubectl rollout restart –n namespace deploy deployment-name -
Edit a Kubernetes resource: You can edit a deployment or any Kubernetes API object, and these changes are saved to the cluster. However, if you reinstall the cluster, these changes are not preserved.
# kubectl edit –ti –n namespace deploy deployment-name
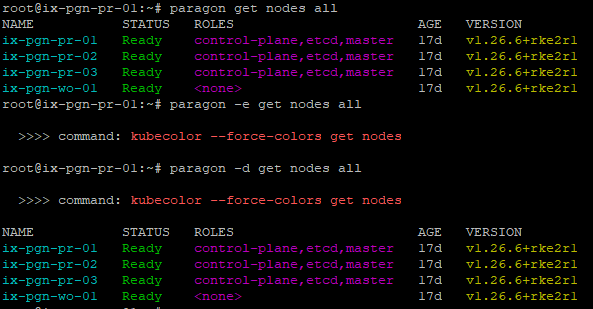
Troubleshoot Using the paragon CLI Utility
paragon command CLI
utility to run commands on pods running in the system. The paragon commands
are a set of intuitive commands to enable you to analyze, query, and troubleshoot your
cluster. To execute the commands, log in to any of the primary nodes. The output of some of
the commands is color-coded because, for some commands, the paragon command
utility executes the kubecolor commands instead of kubectl, kubecolor color codes your
kubectl command output. See Figure 1
for an example output.To view the entire set of commands help options available, use one of the following commands:
root@primary-node:~# paragon ?
root@primary-node:~# paragon --help
root@primary-node:~# paragon -h
You can view help options at any command level (not only at top level). For example:
root@primary-node:~# paragon insights cli ?

   paragon insights cli alerta =>  Gets into the CLI of paragon insights alerta pod.
   paragon insights cli byoi =>  Gets into the CLI of byoi plugin.Usage : --byoi <BYOI plugin name>.
   paragon insights cli configserver =>  Gets into the CLI of paragon insights config-server pod.
   paragon insights cli grafana =>  Gets into the CLI of paragon insights grafana pod.
   paragon insights cli influxdb =>  Gets into the CLI of paragon insights InfluxDB pod.Use Argument: --influx <influxdb-nodeip> to specify the node ip ,else the command will use first influx node as default.Eg: --influx influxdb-172-16-18-21
   paragon insights cli mgd =>  Gets into the CLI of paragon insights mgd pod.
You
can use the tab option to view possible auto-completion options for the commands. To see
top-level command auto-completion, type paragon and press tab. For
example:
root@primary-node:~# paragon
ambassador   describe   get   pathfinder   set   common   ems   insights   rookceph
To view the underlying command that a paragon command runs, use the echo or
-e option. For
example:
root@primary-node:~# paragon -e get nodes all

  >>>> command: kubecolor --force-colors get nodes
To execute a
paragon command as well as view the underlying command that it runs, use the debug or
-d option. For
example:
root@primary-node:~# paragon -d get nodes all

  >>>> command: kubecolor --force-colors get nodes

NAME           STATUS   ROLES                       AGE   VERSION
ix-pgn-pr-01   Ready    control-plane,etcd,master   17d   v1.26.6+rke2r1
ix-pgn-pr-02   Ready    control-plane,etcd,master   17d   v1.26.6+rke2r1
ix-pgn-pr-03   Ready    control-plane,etcd,master   17d   v1.26.6+rke2r1
ix-pgn-wo-01   Ready    <none>                      17d   v1.26.6+rke2r1
To
view the entire list of paragon commands and the corresponding underlying
commands that they run,
use:
root@primary-node:~# paragon --mapped
paragon command output
Follow the instructions with regards to specific usage criteria such as arguments or
prerequisites, if any, in the help section of each command. Some commands need mandatory
arguments. For instance, the paragon insights logs devicegroup analytical
command needs the argument --dg devicegroup-name-with
subgroup
. For example:
paragon insights logs devicegroup analytical --dg
            controller-0
Some commands have prerequisites. For instance, prior to using the paragon
insights get playbooks command, you must set the username and password by using
the paragon set username --cred username
and
paragon set password --cred
                        password
commands.
The complete set of commands along with their usage criteria is listed in Table 1.
|
Command |
Description |
|---|---|
|
|
Shows Paragon ambassador emissary pods. |
|
|
Shows all Paragon ambassador pods. |
|
|
Shows all Paragon ambassador services. |
|
|
Helps to find the Postgres roles. |
|
|
Shows the description of a particular node in the cluster. Use the Example: You can use the |
|
|
Shows the device manager Paragon ems pods. |
|
|
Shows the job manager Paragon EMS pods. |
|
|
Shows all Paragon EMS pods. |
|
|
Shows all Paragon EMS services. |
|
|
Shows the logs of Paragon EMS device manager pods. Use the |
|
|
Shows the logs of paragon ems job manager pod. Use the |
|
|
Shows all namespaces available in Paragon. |
|
|
Shows a list of all nodes in the cluster. |
|
|
Validates if kubelet has any disk pressure. Use the Example: |
|
|
Validates if kubelet has sufficient memory. Use the Example: |
|
|
Checks for issues with calico and the network. Use the Example: |
|
|
Shows list of all nodes that is not ready in the cluster. |
|
|
Validates if kubelet has sufficient PID available. Use the Example: |
|
|
Shows list of all nodes that is ready in the cluster. |
|
|
Shows list of all taint on the nodes. |
|
|
Shows all the healthy Paragon pods. |
|
|
Shows all the unhealthy Paragon pods. |
|
|
Shows all the Paragon services that are exposed. |
|
|
Logs in to the CLI of the Paragon Insights alerta pod. |
|
|
Logs in to the CLI of the BYOI plug-in. Use the |
|
|
Logs in to the CLI of Paragon Insights config-server pod. |
|
|
Logs in to the CLI of Paragon Insights grafana pod. |
|
|
Logs in to the CLI of Paragon Insights influxdb pod. Use the Example:
|
|
|
Logs in to the CLI of Paragon Insights mgd pod. |
|
|
Describes the Paragon Insights alerta pod. |
|
|
Describes the Paragon Insights REST API pod. |
|
|
Describes the Paragon Insights config-server pod. |
|
|
Describes the Paragon Insights grafana pod. |
|
|
Describes the Paragon Insights influxdb pod. Use the Example: |
|
|
Describes the Paragon Insights mgd pod. |
|
|
Shows the Paragon Insights alerta pod. |
|
|
Shows the Paragon Insights REST API pod. |
|
|
Shows the Paragon Insights config-server pod. |
|
|
Shows all the Paragon Insights device groups. The default username is As a prerequisite, run the |
|
|
Shows all Paragon Insights devices. The default username is As a prerequisite, run the |
|
|
Shows the Paragon Insights grafana pod. |
|
|
Shows the Paragon Insights influxdb pod. |
|
|
Shows the Paragon Insights network telemetry ingestion pods. |
|
|
Shows the Paragon Insights mgd pod. |
|
|
Shows all Paragon Insights playbooks. The default username is As a prerequisite, run the |
|
|
Shows all the Paragon Insights pods. |
|
|
Shows all the Paragon Insights services. |
|
|
Shows the logs of the Paragon Insights alerta pod. |
|
|
Shows the logs of the Paragon Insights rest api pod. |
|
|
Shows the logs of the Paragon Insights BYOI plug-in. Use the |
|
|
Shows the logs of the Paragon Insights config-server pod. |
|
|
Shows the logs of the Paragon Insights device group for service analytical engine. Use the Example: In the example, controller is the devicegroup name and 0 is the subgroup. |
|
|
Shows the logs of the Paragon Insights device group for service itsdb. Use the Example: In the example, controller is the devicegroup name and 0 is the subgroup. |
|
|
Shows the logs of the Paragon Insights device group for service jtimon. Use the Example: In the example, controller is the devicegroup name and 0 is the subgroup. |
|
|
Shows the logs of the Paragon Insights device group for service jti native. Use the Example: In the example, controller is the devicegroup name and 0 is the subgroup. |
|
|
Shows the logs of the Paragon Insights device group for service syslog. Use the Example: In the example, controller is the devicegroup name and 0 is the subgroup. |
|
|
Shows the logs of the Paragon Insights Grafana pod. |
|
|
Shows the logs of the Paragon Insights influxdb pod. Use the Example: |
|
|
Shows the logs of the Paragon Insights mgd pod. |
|
|
Logs in to the CLI of the Paragon Pathfinder BMP container. |
|
|
Logs in to the CLI of the Paragon Pathfinder ns-configserver container. |
|
|
Logs in to the CLI of the Paragon Pathfinder cRPD container. |
|
|
Logs in to the CLI of the Paragon Pathfinder debugutils container. |
|
|
Logs in to the CLI of the Paragon Pathfinder netconf container. |
|
|
Logs in to the CLI of the Paragon Pathfinder ns-pceserver container (PCEP) services. |
|
|
Logs in to the CLI of the Paragon Pathfinder ns-pcserver (PCS) container. |
|
|
Logs in to the CLI of the Paragon Pathfinder ns-pcsviewer (Paragon Planner Desktop Application) container. |
|
|
Gets into the CLI of paragon pathfinder scheduler container. |
|
|
Logs into the CLI of the Paragon Pathfinder ns-toposerver (Topology service) container. |
|
|
Logs into the CLI of the Paragon Pathfinder ns-web container. |
|
|
Debugs the Paragon Pathfinder cRPD routing-options configuration related to BGP-LS. |
|
|
Debugs the Paragon Pathfinder cRPD routes related to BGP-LS. |
|
|
Shows Paragon Pathfinder debugutils genjvisiondata help. |
|
|
Shows Paragon Pathfinder debugutils genjvisiondata params. |
|
|
Logs in to the Paragon Pathfinder PCEP CLI for debugging. |
|
|
Shows the Kubernetes cluster Postgres status. |
|
|
Shows the rabbitmqctl cluster status. |
|
|
Runs Paragon Pathfinder debugutils pod to snoop and decode data exchanged between AMQP. |
|
|
Shows Paragon Pathfinder debugutils snoop help. |
|
|
Runs Paragon Pathfinder debugutils pod to snoop and decode data exchanged between Postgres. |
|
|
Runs Paragon Pathfinder debugutils pod to snoop and decode data exchanged between Redis link. |
|
|
Runs Paragon Pathfinder debugutils pod to snoop and decode data exchanged between Redis lsp. |
|
|
Runs Paragon Pathfinder debugutils pod to snoop and decode data exchanged between redis nodes. |
|
|
Shows Paragon Pathfinder debugutils topo_util help. |
|
|
Shows Paragon Pathfinder debugutils topo_util tool to deactivate safe mode. |
|
|
Runs Paragon Pathfinder debugutils topo_util tool to refresh the current topology. |
|
|
Runs Paragon Pathfinder debugutils topo_util tool to save the current topology snapshot. |
|
|
Describes Paragon Pathfinder pod including cRPD and BMP containers. |
|
|
Describes Paragon Pathfinder pod including config-server container. |
|
|
Describes Paragon Pathfinder pod including debugutils container. |
|
|
Describes Paragon Pathfinder pod including ns-netconfd container. |
|
|
Describes Paragon Pathfinder pod including ns-pceserver container (PCEP services). |
|
|
Describes Paragon Pathfinder pod including ns-pcserver container (PCS). |
|
|
Describes paragon pathfinder pod including ns-pcsviewer container (Paragon Planner Desktop Application). |
|
|
Describes Paragon Pathfinder pod including scheduler container. |
|
|
Describes Paragon Pathfinder pod including ns-toposerver (Topology service) container. |
|
|
Describes Paragon Pathfinder pod including web container. |
|
|
Shows Paragon Pathfinder pod including cRPD and BMP containers. |
|
|
Shows Paragon Pathfinder pod including ns-configserver and syslog containers. |
|
|
Shows Paragon Pathfinder pod including debugutils container. |
|
|
Shows Paragon Pathfinder pod associated with the netconf process. |
|
|
Shows Paragon Pathfinder pod including ns-pceserver container (PCEP services). |
|
|
Shows Paragon Pathfinder pod including ns-pcserver container (PCS). |
|
|
Shows Paragon Pathfinder pod including ns-pcsviewer container (Paragon Planner Desktop Application). |
|
|
Shows all Paragon Pathfinder pods. |
|
|
Shows Paragon Pathfinder pod associated with the scheduler process. |
|
|
Shows all Paragon Pathfinder services. |
|
|
Shows Paragon Pathfinder pod including ns-toposerver container (Topology service). |
|
|
Shows Paragon Pathfinder pod associated with the ns-web process. |
|
|
Shows the logs of Paragon Pathfinder bmp pods bmp container. Use the
|
|
|
Shows the logs of Paragon Pathfinder bmp pods cRPD container. Use the
|
|
|
Shows the logs of Paragon Pathfinder bmp pods syslog container. Use the
|
|
|
Shows the logs of Paragon Pathfinder configserver pods ns-configserver
container. Use the |
|
|
Shows the logs of Paragon Pathfinder configserver pods syslog container. Use
the |
|
|
Shows the logs of Paragon Pathfinder netconf pods ns-netconfd container. Use
the |
|
|
Shows the logs of Paragon Pathfinder netconf pods syslog container. Use the
|
|
|
Shows the logs of Paragon Pathfinder pceserver pods ns-pceserver container. Use
the |
|
|
Shows the logs of Paragon Pathfinder pceserver pods syslog container. Use the
|
|
|
Shows processed logs of Paragon Pathfinder pceserver pods syslog container
fetching only timestamp, level, and message. Use the |
|
|
Shows the logs of Paragon Pathfinder pcserver pods ns-pcserver container. Use
the |
|
|
Shows the logs of Paragon Pathfinder pcserver pods syslog container. Use the
|
|
|
Shows processed logs of Paragon Pathfinder pceserver pods syslog container
fetching only with timestamp, level, and message. Use the |
|
|
Shows the logs of Paragon Pathfinder pcviewer pods ns-pcviewer container. Use
the |
|
|
Shows the logs of Paragon Pathfinder pcviewer pods syslog container. Use the
|
|
|
Shows the logs of Paragon Pathfinder toposerver pods ns-topo-dbinit container.
Use the |
|
|
Shows the logs of Paragon Pathfinder toposerver pods ns-topo-dbinit-cache
container. Use the |
|
|
Shows the logs of Paragon Pathfinder toposerver pods ns-toposerver container.
Use the |
|
|
Shows the logs of Paragon Pathfinder toposerver pods syslog container. Use the
|
|
|
Shows processed logs of Paragon Pathfinder toposerver pods syslog container
fetching only with timestamp, level, and message. Use the |
|
|
Shows the logs of Paragon Pathfinder web pods ns-web container. Use the
|
|
|
Shows the logs of Paragon Pathfinder web pods ns-web-dbinit container. Use the
|
|
|
Shows the logs of Paragon Pathfinder web pods syslog container. Use the
|
|
|
Shows the federation status (from rabbitmq-0 instance). GeoHa status is only available for a dual cluster setup. |
|
|
Reports Rook and Ceph OSD file system disk space usage. |
|
|
Shows Rook and Ceph OSD pool statistics. |
|
|
Shows Rook and Ceph OSD status. |
|
|
Shows Rook and Ceph OSD tree. |
|
|
Shows Rook and Ceph OSD utilization. |
|
|
Shows Rook and Ceph pg status. |
|
|
Shows Rook and Ceph status. |
|
|
Logs in to the CLI of Rook and Ceph toolbox pod. |
|
|
Shows Rook and Ceph pods. |
|
|
Shows Rook and Ceph services. |
|
|
This is RADOS gateway user administration utility which gets the period info. |
|
|
This is RADOS gateway user administration utility which gets the metadata sync status. |
|
|
Sets the Paragon (UI host) password for REST calls authentication. Use this mandatory one-time set password command to set the
password
using the
Example: |
|
|
Sets the Paragon (UI host) username for Rest calls authentication. The default
username is Use the Example: |
Troubleshoot Ceph and Rook
Ceph requires relatively newer Kernel versions. If your Linux kernel is very old, consider upgrading or reinstalling a new one.
Use this section to troubleshoot issues with Ceph and Rook.
Insufficient Disk Space
A common reason for installation failure is that the object storage daemons (OSDs) are not created. An OSD configures the storage on a cluster node. OSDs might not be created because of non-availability of disk resources, in the form of either insufficient resources or incorrectly partitioned disk space. Ensure that the nodes have sufficient unpartitioned disk space available.
Reformat a Disk
Examine the logs of the "rook-ceph-osd-prepare-hostname-*" jobs. The logs are descriptive. If you need to reformat the disk or partition, and restart Rook, perform the following steps:
- Use one of the following methods to reformat an existing disk or partition.
- If you have a block storage device that should have been used for Ceph, but
wasn't used because it was in an unusable state, you can reformat the disk
completely.
$ sgdisk -zap /dev/disk
$ dd if=/dev/zero of=/dev/disk bs=1M count=100
- If you have a disk partition that should have been used for Ceph, you can clear
the data on the partition
completely.
$ wipefs -a -f /dev/partition
$ dd if=/dev/zero of=/dev/partition bs=1M count=100
Note:These commands completely reformat the disk or partitions that you are using and you will lose all data on them.
- If you have a block storage device that should have been used for Ceph, but
wasn't used because it was in an unusable state, you can reformat the disk
completely.
- Restart Rook to save the changes and reattempt the OSD creation
process.
$ kubectl rollout restart deploy -n rook-ceph rook-ceph-operator
View Pod Status
To check the status of Rook and Ceph pods installed in the rook-ceph
namespace, use the # kubectl get po -n rook-ceph command. The following
pods must be in the running state.
-
rook-ceph-mon-*—Typically, three monitor pods are created. -
rook-ceph-mgr-*—One manager pod -
rook-ceph-osd-*—Three or more OSD pods -
rook-ceph-mds-cephfs-*—Metadata servers -
rook-ceph-rgw-object-store-*—ObjectStore gateway -
rook-ceph-tools*—For additional debugging options.To connect to the toolbox, use the command:
$ kubectl exec -ti -n rook-ceph
                  $(kubectl get po -n rook-ceph -l app=rook-ceph-tools \ -o
                  jsonpath={..metadata.name}) -- bash
Some of the common commands you can use in the toolbox are:
# ceph status # ceph osd status, # ceph osd
                df, # ceph osd utilization, # ceph osd pool stats, # ceph osd tree, and # ceph pg
                stat
Troubleshoot Ceph OSD failure
Check the status of pods installed in the rook-ceph namespace.
# kubectl get po -n rook-ceph
If a rook-ceph-osd-*
pod is in the
Error or CrashLoopBackoff state, then you must
repair the disk.
-
Stop the
rook-ceph-operator.# kubectl scale deploy -n rook-ceph rook-ceph-operator --replicas=0 -
Remove the failing OSD processes.
# kubectl delete deploy -n rook-ceph rook-ceph-osd-number -
Connect to the toolbox.
$ kubectl exec -ti -n rook-ceph $(kubectl get po -n rook-ceph -l app=rook-ceph-tools -o jsonpath={..metadata.name}) -- bash -
Identify the failing OSD.
# ceph osd status -
Mark out the failed OSD.
[root@rook-ceph-tools-/]# ceph osd out 5
marked out osd.5.
[root@rook-ceph-tools-/]# ceph osd status
ID  HOST           USED  AVAIL  WR OPS  WR DATA  RD OPS  RD DATA  STATE
 0  10.xx.xx.210  4856M  75.2G      0        0       0        0   exists,up
 1  10.xx.xx.215  2986M  77.0G      0        0       1       89   exists,up
 2  10.xx.xx.98   3243M  76.8G      0        0       1       15   exists,up
 3  10.xx.xx.195  4945M  75.1G      0        0       0        0   exists,up
 4  10.xx.xx.170  5053M  75.0G      0        0       0        0   exists,up
 5  10.xx.xx.197     0      0       0        0       0        0   exists
-
Remove the failed OSD.
# ceph osd purge number --yes-i-really-mean-it - Connect to the node that hosted the failed OSD and do one of the following:
- Replace the hard disk in case of a hardware failure.
- Reformat the disk
completely.
$ sgdisk -zap /dev/disk
$ dd if=/dev/zero of=/dev/disk bs=1M count=100
- Reformat the partition
completely.
$ wipefs -a -f /dev/partition
$ dd if=/dev/zero of=/dev/partition bs=1M count=100
-
Restart
rook-ceph-operator.# kubectl scale deploy -n rook-ceph rook-ceph-operator --replicas=1 -
Monitor the OSD pods.
# kubectl get po -n rook-cephIf the OSD does not recover, use the same procedure to remove the OSD, and then remove the disk or delete the partition before restarting
rook-ceph-operator.
Troubleshoot Air-Gap Installation Failure
The air-gap installation as well as the kube-apiserver fails with the
following error because you do not have an existing /etc/resolv.conf
file.
TASK [kubernetes/master : Activate etcd backup cronjob] ********************************************************************
fatal: [192.xx.xx.2]: FAILED! => changed=true
  cmd:
  - kubectl
  - apply
  - -f
  - /etc/kubernetes/etcd-backup.yaml
  delta: '0:00:00.197012'
  end: '2022-09-13 13:46:31.220256'
  msg: non-zero return code
  rc: 1
  start: '2022-09-13 13:46:31.023244'
  stderr: The connection to the server 192.xx.xx.2:6443 was refused - did you specify the right host or port?
  stderr_lines: <omitted>
  stdout: ''
  stdout_lines: <omitted>
To create a new file, you must run the #touch /etc/resolv.conf command
as the root user, and then redeploy the Paragon Automation cluster.
Recover from a RabbitMQ Cluster Failure
To check for this
condition, run the kubectl get po -n northstar -l app=rabbitmq command.
This command should show three pods with their status as Running. For
example:
$ kubectl get po -n northstar -l app=rabbitmq
NAME READY STATUS RESTARTS AGE
rabbitmq-0 1/1 Running 0 10m
rabbitmq-1 1/1 Running 0 10m
rabbitmq-2 1/1 Running 0 9m37s
However, if the status of one or more pods is
Error, use the following recovery procedure:
-
Delete RabbitMQ.
kubectl delete po -n northstar -l app=rabbitmq -
Check the status of the pods.
kubectl get po -n northstar -l app=rabbitmq.Repeat
kubectl delete po -n northstar -l app=rabbitmquntil the status of all pods isRunning. -
Restart the Paragon Pathfinder applications.
kubectl rollout restart deploy -n northstar
Disable udevd Daemon During OSD Creation
udevd daemon for managing new
hardware such as disks, network cards, and CDs. During the creation of OSDs, the
udevd daemon detects the OSDs and can lock them before they are fully
initialized. The Paragon Automation installer disables systemd-udevd during
installation and enables it after Rook has initialized the OSDs.When adding or replacing
nodes and repairing failed nodes, you must manually disable the udevd
daemon so that OSD creation does not fail. You can reenable the daemon after the OSDs are
created.
Use these commands to manually disable and enable
udevd.
- Log in to the node that you want to add or repair.
- Disable the
udevddaemon.- Check whether udevd is running.
# systemctl is-active systemd-udevd - If
udevdis active, disable it.# systemctl mask system-udevd --now
- Check whether udevd is running.
-
When you repair or replace a node, the Ceph distributed filesystems are not automatically updated. If the data disks are destroyed as part of the repair process, then you must recover the object storage daemons (OSDs) hosted on those data disks.
-
Connect to the Ceph toolbox and view the status of OSDs. The
ceph-toolsscript is installed on a primary node. You can log in to the primary node and use the kubectl interface to accessceph-tools. To use a node other than the primary node, you must copy the admin.conf file (in the config-dir directory on the control host) and set thekubeconfigenvironment variable or use theexport KUBECONFIG=config-dir/admin.confcommand.$ ceph-tools# ceph osd status -
Verify that all OSDs are listed as
exists,up. If OSDs are damaged, follow the troubleshooting instructions explained in Troubleshoot Ceph and Rook.
-
- Log in to node that you added or repaired after verifying that all OSDs are created.
-
Reenable
udevdon the node.systemctl unmask system-udevd
disable_udevd:
          true
in the config.yml and run the ./run -c
config-dir deploy command. We do not recommend that you
redeploy the cluster only to disable the udevd daemon.Wrapper Scripts for Common Utility Commands
| Command | Description |
|---|---|
paragon-db [arguments]
|
Connect to the database server and start the Postgres SQL shell using the superuser account. Optional arguments are passed to the Postgres SQL command. |
pf-cmgd [arguments]
|
Start the CLI in the Paragon Pathfinder CMGD pod. Optional arguments are executed by the CLI. |
pf-crpd [arguments]
|
Start the CLI in the Paragon Pathfinder cRPD pod. Optional arguments are executed by the CLI. |
pf-redis [arguments]
|
Start the (authenticated) redis-cli in the Paragon Pathfinder Redis pod. Optional arguments are executed by the Redis pod. |
pf-debugutils [arguments]
|
Start the shell in the Paragon Pathfinder debugutils pod. Optional arguments
are executed by the shell. Pathfinder debugutils utilities are installed if
install_northstar_debugutils: true is configured in the
config.yml file. |
ceph-tools [arguments]
|
Start the shell to the Ceph toolbox. Optional arguments are executed by the shell. |
Back Up the Control Host
Alternatively, you can also rebuild the inventory and config.yml files by downloading information from the cluster using the following commands:
# kubectl get cm
            -n common metadata -o jsonpath={..inventory} > inventory
#
            kubectl get cm -n common metadata -o jsonpath={..config_yml} >
          config.yml
You cannot recover SSH keys; you must replace failed keys with new keys.
User Service Accounts for Debugging
Paragon Pathfinder, telemetry manager, and base platform applications internally use Paragon Insights for telemetry collection. To debug configuration issues associated with these applications, three user service accounts are created, by default, during Paragon Automation installation. The scope of these service accounts is limited to debugging the corresponding application only. The service accounts details are listed in the following table.
| Application Name and Scope | Account Username | Account Default Password |
|---|---|---|
| Paragon Pathfinder (northstar) | hb-northstar-admin | Admin123! |
| Telemetry manager (tm) | hb-tm-admin | |
| Base platform (ems-dmon) | hb-ems-dmon |
You must use these accounts solely for debugging purposes. Do not use these accounts for day-to-day operations or for modifying any configuration. We recommend that you change the login credentials for security reasons.