Proximity Tracing and Occupancy Compliance
Track wireless client devices as they come into contact with the network, either directly or through connections to neighboring APs, and perform proximity tracing.
You can track wireless client devices as they come into contact with, either directly or through connections to neighboring APs, as well as perform location tracing.
Features
-
- Provides comprehensive insights on visitor count, user journey, and proximity tracing. You can use the insights to analyze user behavior and improve customer engagement and optimize workspace utilization.
- Provides proximity tracing and compliance reports. With these reports, you can analyze whether your network follows the prescribed capacity utilization restrictions.
Before You Begin
-
See Juniper Mist Location Services Guide for information about how to set up your sites and floor plans for location services.
- See Set Up Occupancy Analytics for a Site for information about zone occupancy settings.
-
See Set the Engagement Dwell Limits and Schedule for a Site to learn how to enable engagement analytics options for a site.
-
See Mist Premium Analytics Trial License to know about license requirements for Juniper Mist™ Premium Analytics.
- Become familiar with the options available on the Juniper Mist Premium Analytics dashboards. See Figure 3.
Access Proximity Tracing and Occupancy Compliance
Proximity Tracing and Occupancy Compliance Tiles
The Proximity Tracing and Occupancy Compliance dashboard includes various tiles that provide graphical representations of analytics at a granular level.
On the top of the dashboard, you can view a summary of the reports such as areas visited and contacts in proximity.
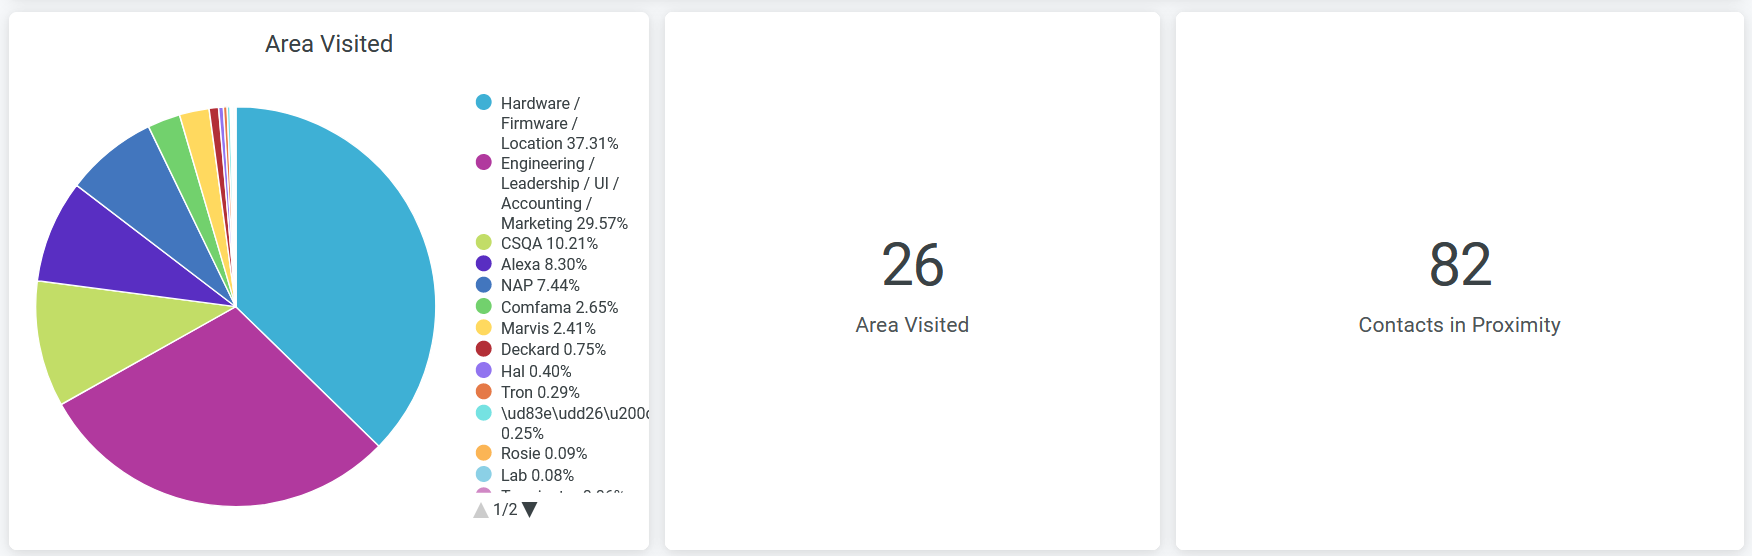
In a pie chart you can view the distribution of dwell time in different zones.
Place the cursor on a wedge, which represents a zone in the site, of the pie chart to view the time spent (in minutes) by visitors in that zone.
Additionally, you can see in the legend next to the chart the percentage of visitors' minutes in each zone. To hide information about a zone from the chart and see information only for the remaining zones, click the zone name in the legend.
You can see the count of areas that have visitors and the number of visitors in proximity.
- User Journey and Dwell Insights
- Proximity Tracing
- Proximity Tracing by Area Visited
- Compliance Based on Capacity Utilization by Area
- Device Per Site and Last Observation by Device
User Journey and Dwell Insights
The tile displays the occupancy status of each zone on an hourly basis.
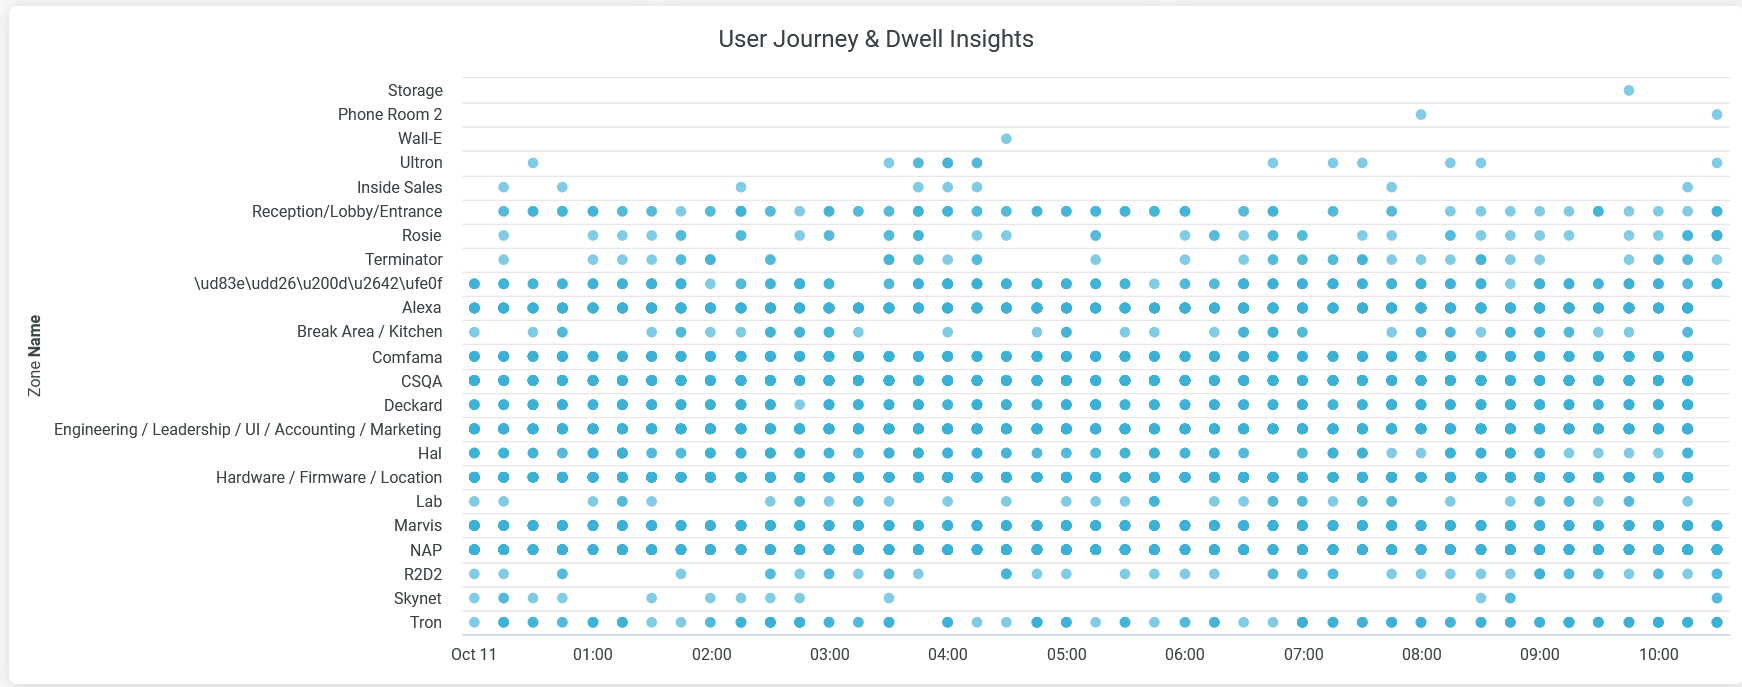
When you hover over the chart, you see a pop-up message with the occupancy status of a particular zone with time stamps.
Proximity Tracing
You can view the list of devices that are in close contact with the APs, that is the devices within the proximity zones of the APs.
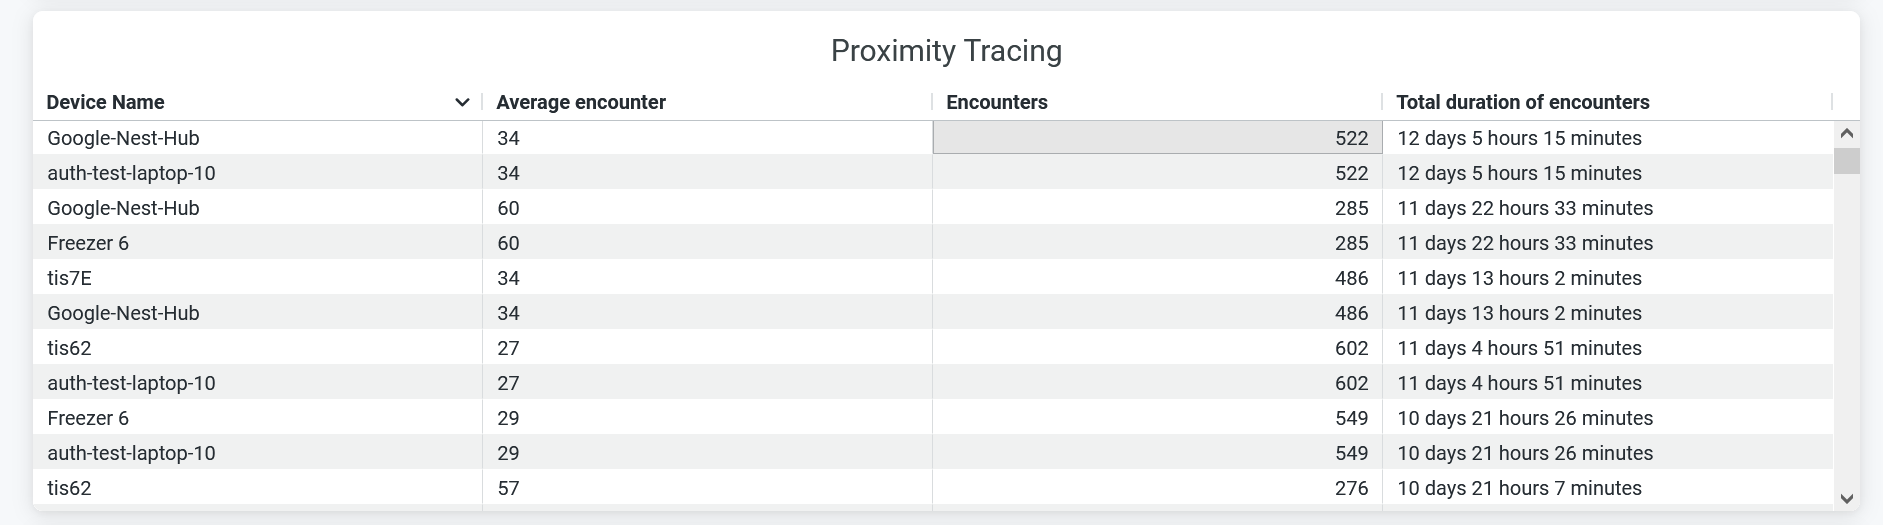
You can view:
- Device Name—Name of the client or user device.
- Average Encounter—Average number of times the device is within the proximity zone.
- Encounter—Number of times the device is within the proximity zone.
- Duration of Encounter—Total duration of the device's presence in the proximity zone.
Proximity Tracing by Area Visited
You can view the list of zones with details of devices that are in the proximity zones.
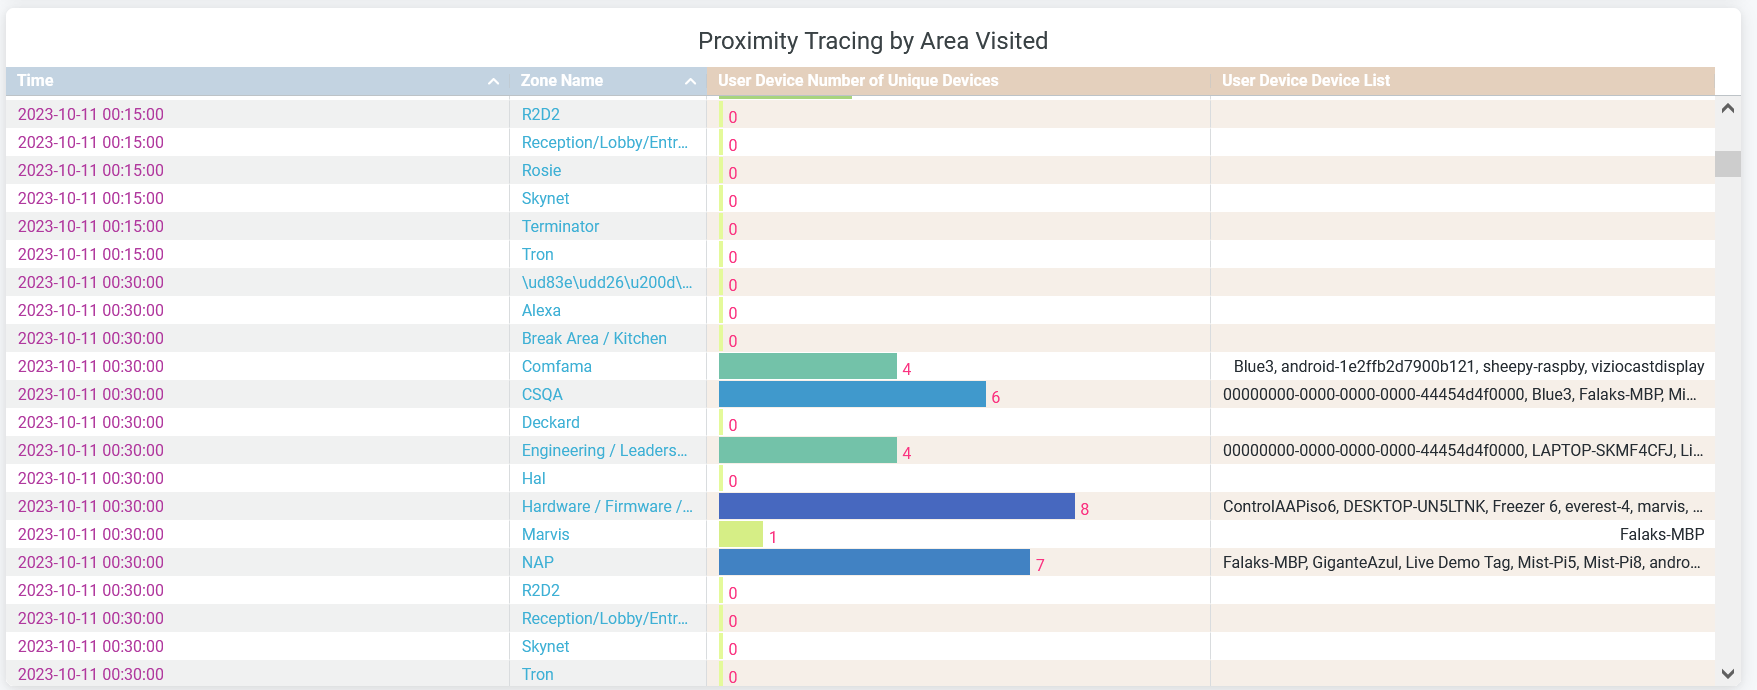
You can view:
- Time—Time of report generation.
- Zone Name—Name of the proximity zone.
- Number of Unique Devices—Number of unique devices present in the proximity zone.
- User Device or Device List—Name of the devices present in the proximity zone.
Compliance Based on Capacity Utilization by Area
You can view the details of zones along with the percentage that represents the ratio of occupancy to capacity.
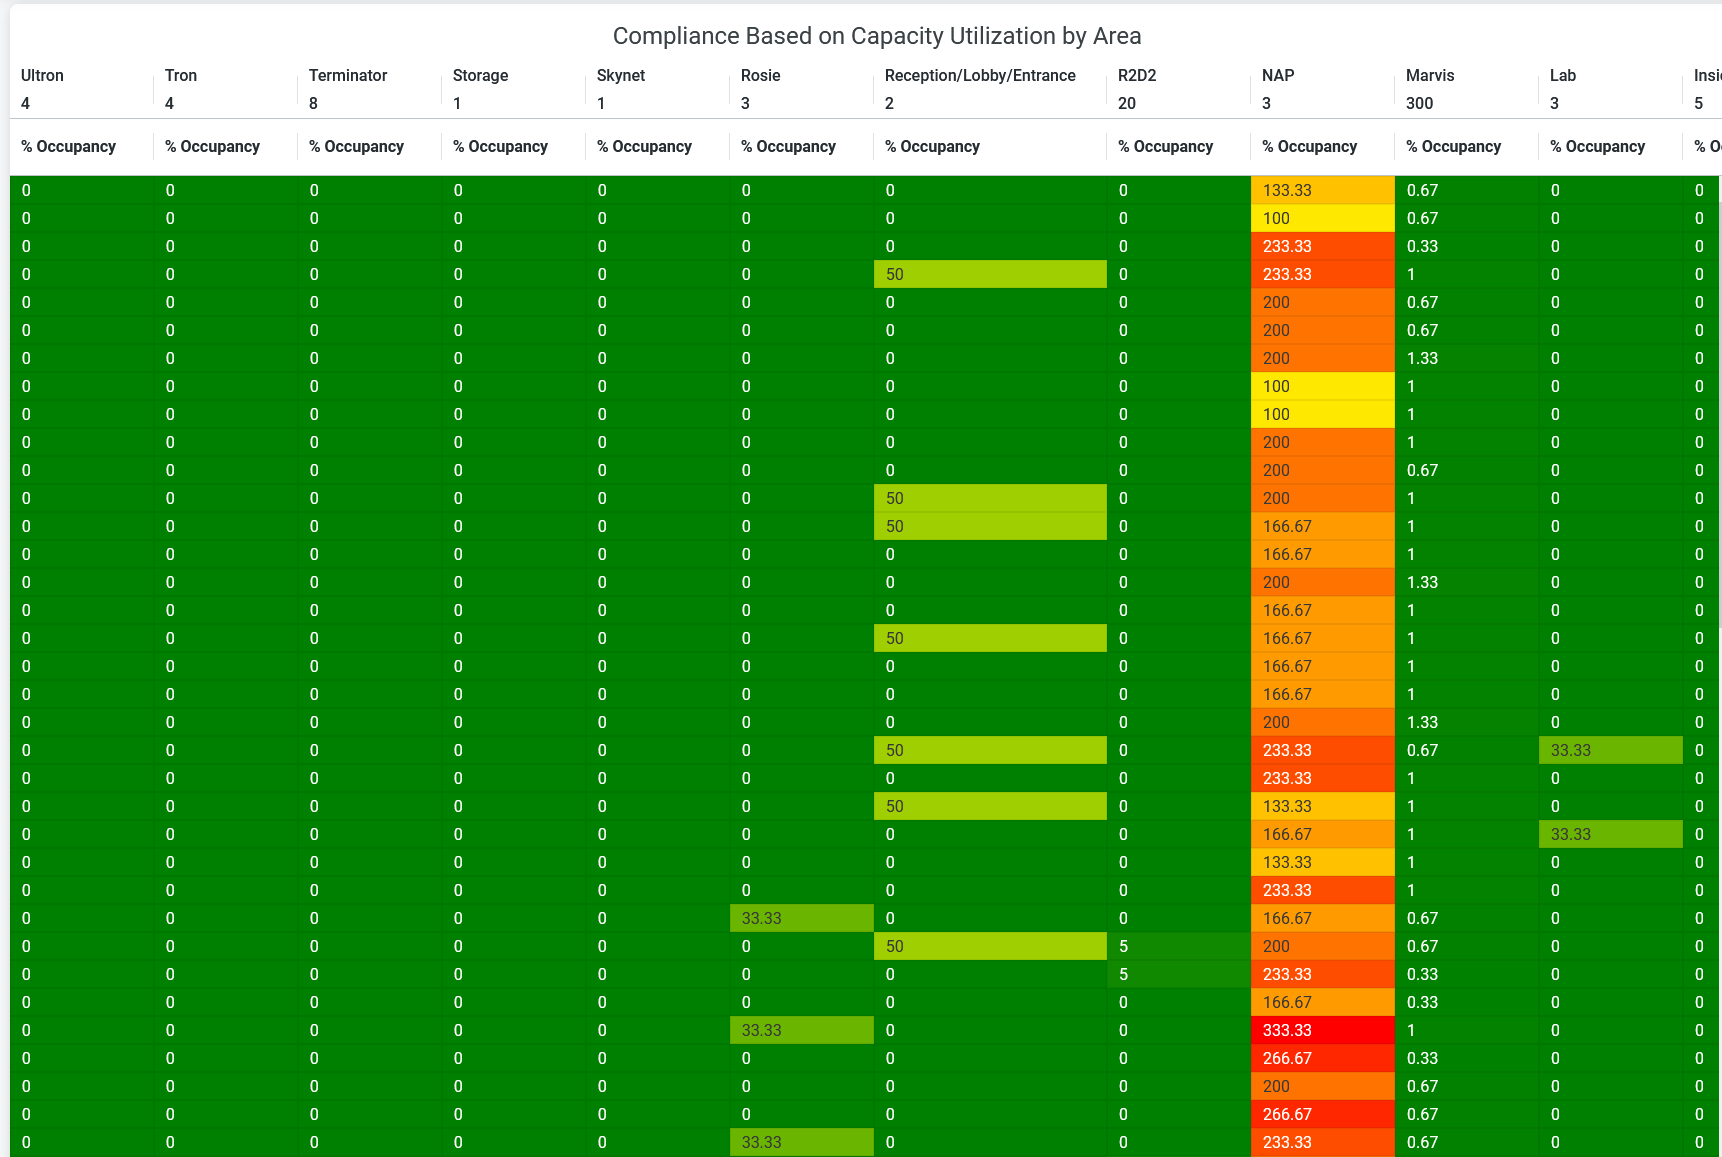
In the tile, you can see that zones with low occupancy (below 50 percent of capacity) are in green. Zones with medium occupancy (50–100 percent of capacity) are in yellow and zones with excess occupancy (over 100 percent of capacity) are in red. Additionally, you can see the percentage of occupancy.
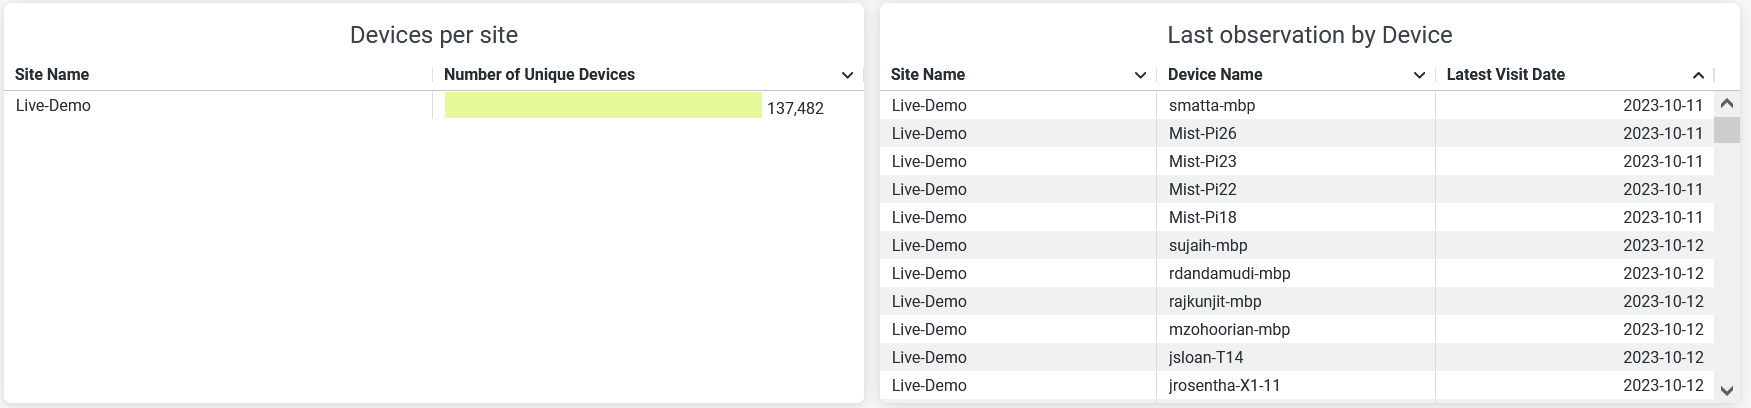
Device Per Site and Last Observation by Device
The tile shows the total number of client or user devices present in your site. Additionally, it provides a list of devices on the site, each with its most recent visit date.
You can view:
- Time—Time of the report generation.
- Zone Name—Name of the proximity zone.
- Number of Unique Devices—Number of unique devices present in the proximity zone.
- User Device or Device List—Name of the devices present in the proximity zone.