Configuring RED Drop Profiles
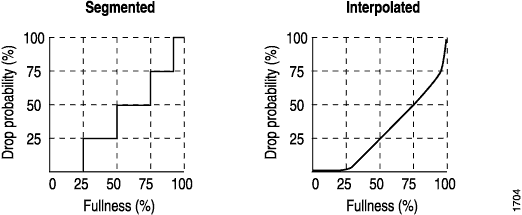
Create a segmented configuration and an interpolated configuration that correspond to the graphs in Figure 1. The values defined in the configuration are matched to represent the data points in the graph line. In this example, the drop probability is 25 percent when the queue is 50 percent full. The drop probability increases to 50 percent when the queue is 75 percent full.

Segmented
class-of-service {
    drop-profiles {
        segmented-style-profile {
            fill-level 25 drop-probability 25;
            fill-level 50 drop-probability 50;
            fill-level 75 drop-probability 75;
            fill-level 95 drop-probability 100;
        }
    }
}
To create the profile’s graph line, the software begins at the bottom-left corner, representing a 0 percent fill level and a 0 percent drop probability. This configuration draws a line directly to the right until it reaches the first defined fill level, 25 percent for this configuration. The software then continues the line vertically until the first drop probability is reached. This process is repeated for all of the defined levels and probabilities until the top-right corner of the graph is reached.
Create a smoother graph line by configuring the profile with
the interpolate statement. This allows the software to
automatically generate 64 data points on the graph beginning at (0,
0) and ending at (100, 100). Along the way, the graph line intersects
specific data points, which you define as follows:
Interpolated
class-of-service {
    drop-profiles {
        interpolated-style-profile {
            interpolate {
                fill-level [ 50 75 ];
                drop-probability [ 25 50 ];
            }
        }
    }
}
