Wired Network Insights
Assess wired network performance by viewing analytics for traffic throughput, port usage, and more.
The report provides in-depth information including service-level expectation (SLE) trends, traffic trends, and switch and port usage. With this information, you can perform comprehensive network analysis to optimize the usage of your wired network resources.
Features and Benefits
-
Provides insights on organization-wide wired traffic trends and usage of switches and ports. With these insights, you can spot the areas of the network that experience problems.
-
Track network health, performance, and status.
-
Monitors the amount and types of traffic passing through the network.
-
Provides details about the client devices that are connected to the switches and ports in your network.
Before You Begin
-
See the Juniper Mist Wired Configuration Guide for the wired configuration details.
-
See Mist Premium Analytics Trial License to know about license requirements for the Juniper Mist Premium Analytics dashboard.
- Become familiar with the options available on the Juniper Mist Premium Analytics dashboard. See Figure 3.
Access Wired Network Insights Dashboard
To access the Wired Network Insights dashboard:
-
On the Premium Analytics page, click Wired Network
Insights.
Figure 1: Access Premium Analytics
 The Wired Network Insights page appears.
Wired Network Insights Tiles
The Wireless Network Insights dashboard includes various tiles that provide graphical representations of analytics at a granular level. You can see the number of connected clients, traffic volume, information about the switches and ports that support the highest traffic volume, and other metrics.
- Service Level Expectations(SLE)
- Switches by Model
- Top Ports
- RX/TX Trend GBs
- Switches Summary Report
- Active Ports Trend
- Trend by Switch GBs
Service Level Expectations(SLE)
Figure 2 shows the Service Level Expectations(SLE) tile.
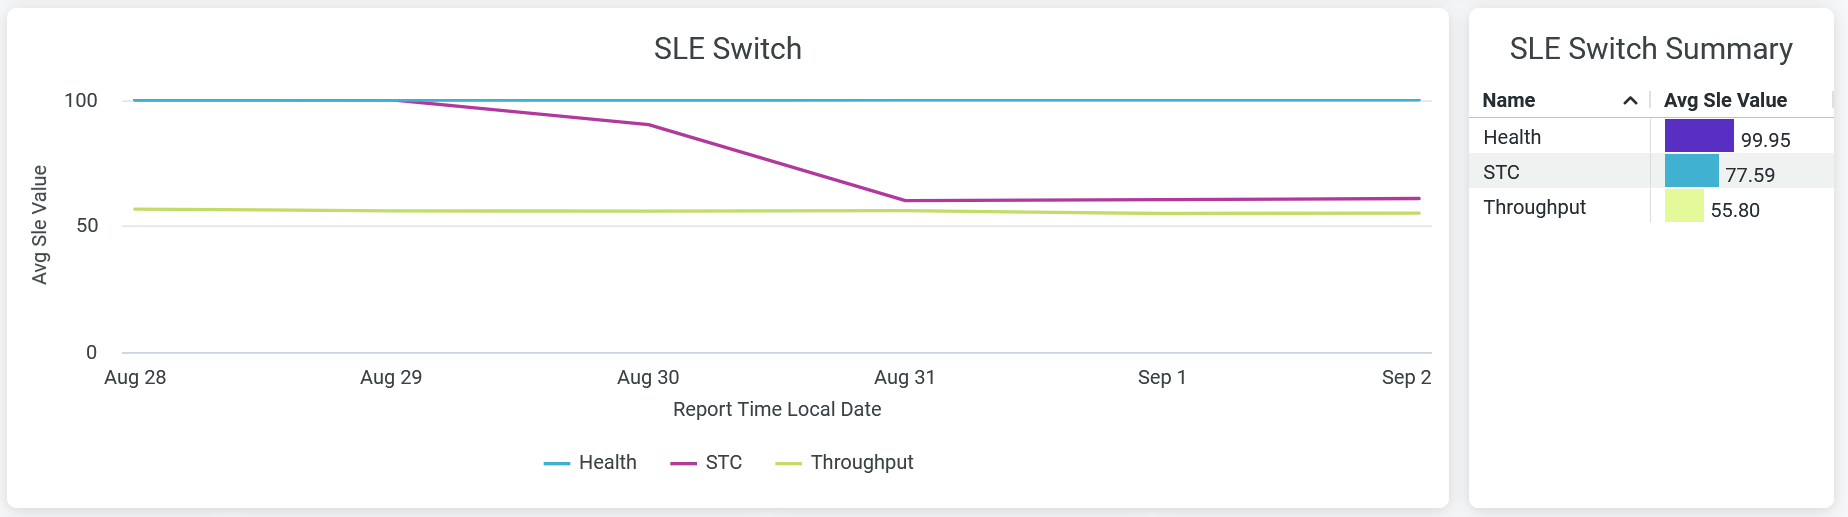
The SLE Switch tile displays SLE trends over a period of time in the network. The chart displays the performance of the following SLE metrics as a percentage that represents the success rate of the metric:
-
Health—Percentage of user minutes during which the health status of the switches meets the SLE goal.
-
STC—Percentage of successful connections.
-
Throughput—Percentage of time the wired users can pass traffic without any disruptions.
Hover over the chart to see the actual values of the metric at the given time.
The SLE Switch Summary tile displays the success rate of the SLE metrics as a percentage. According to the sample that the tile displays, 99.95 percent of the connections meet the specified health level and 77.59 percent of the connections are successful. Additionally, the sample shows that 55.80 percent of the sessions successfully receive the specified throughput. Therefore, the remaining 54.20 percent of the wired sessions face problems.
Switches by Model
Figure 3 shows the Switches by Model chart.
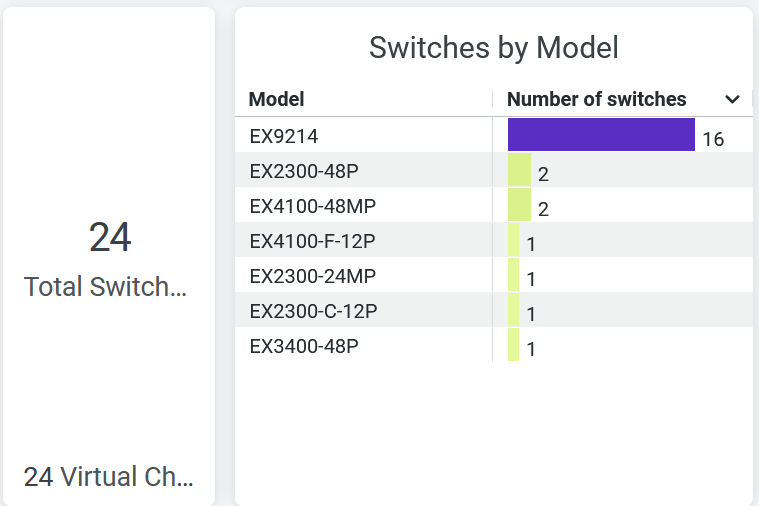
This tile displays the switch models in the order of their count and the total number of switches in the wired network of your organization.
Top Ports
Figure 4 shows the Top Ports tile.
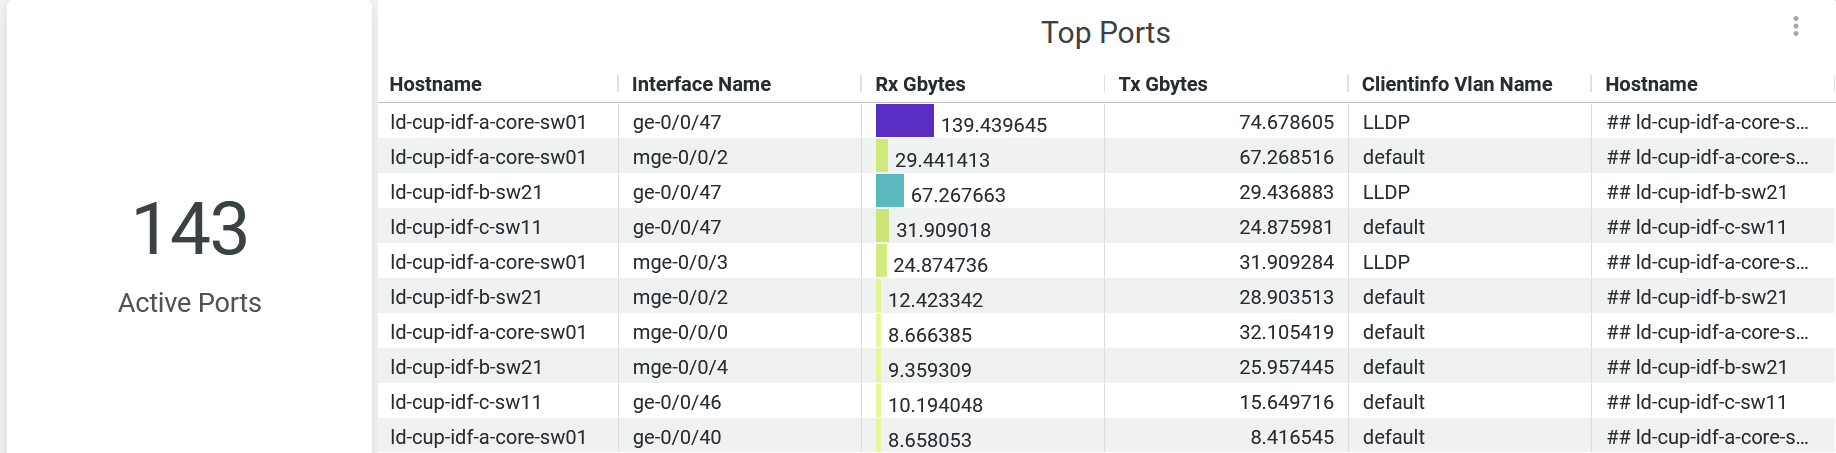
The tile displays the number of active ports and the list of active interfaces on the switches. The tile displays a list of interfaces ordered based on the traffic volume on each interface. The tile displays:
-
Hostname—Hostname for a switch.
-
Interface Name—Interface on a switch.
-
RX Gbytes—Traffic volume that an interface receives.
-
TX Gbytes—Traffic volume that an interface transmits.
-
Client Info Vlan Name—Dynamic port profile.
-
Hostname—Hostname for a switch.
RX/TX Trend GBs
Figure 5 shows the RX/TX Trend GBs tile.
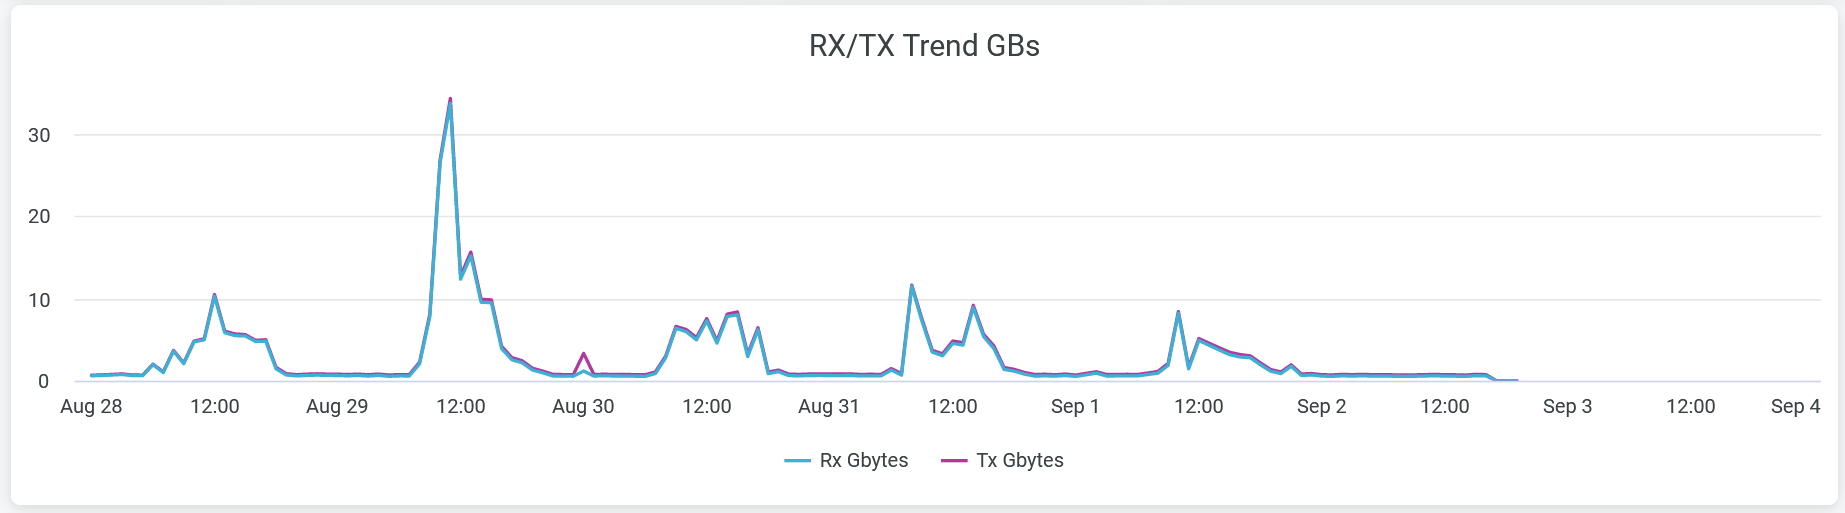
The tile displays client traffic volume that your wired network receives and transmits over 7 days.
To hide either transmitted or received traffic from the chart and see only the remaining traffic type, click the relevant unit of measure in the legend.
Place the cursor on the chart to see the volume of traffic at the given time.
Switches Summary Report
Figure 6 shows the Switches Summary Report tile.
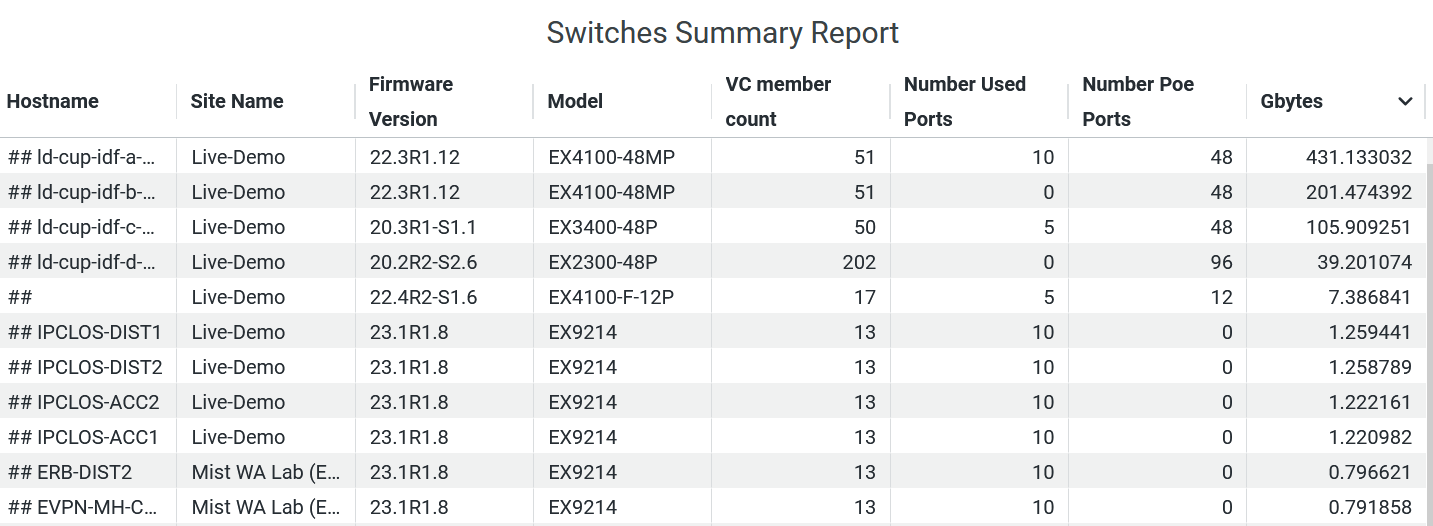
The tile displays the following details about the switches in your network:
-
Hostname—Hostname for a switch.
-
Site Name—Name of the site that a switch is associated with.
-
Firmware Version—Firmware version of a switch
-
Model—Model of a switch.
-
VC member count—Count of virtual chassis configured on a switch.
-
Number Used Ports—Number of ports on a switch.
-
Number PoE Ports—Number of Power over Ethernet (PoE) ports on a switch.
-
Gbytes—Traffic volume on an interface.
Active Ports Trend
Figure 7 shows the Active Ports Trend tile.
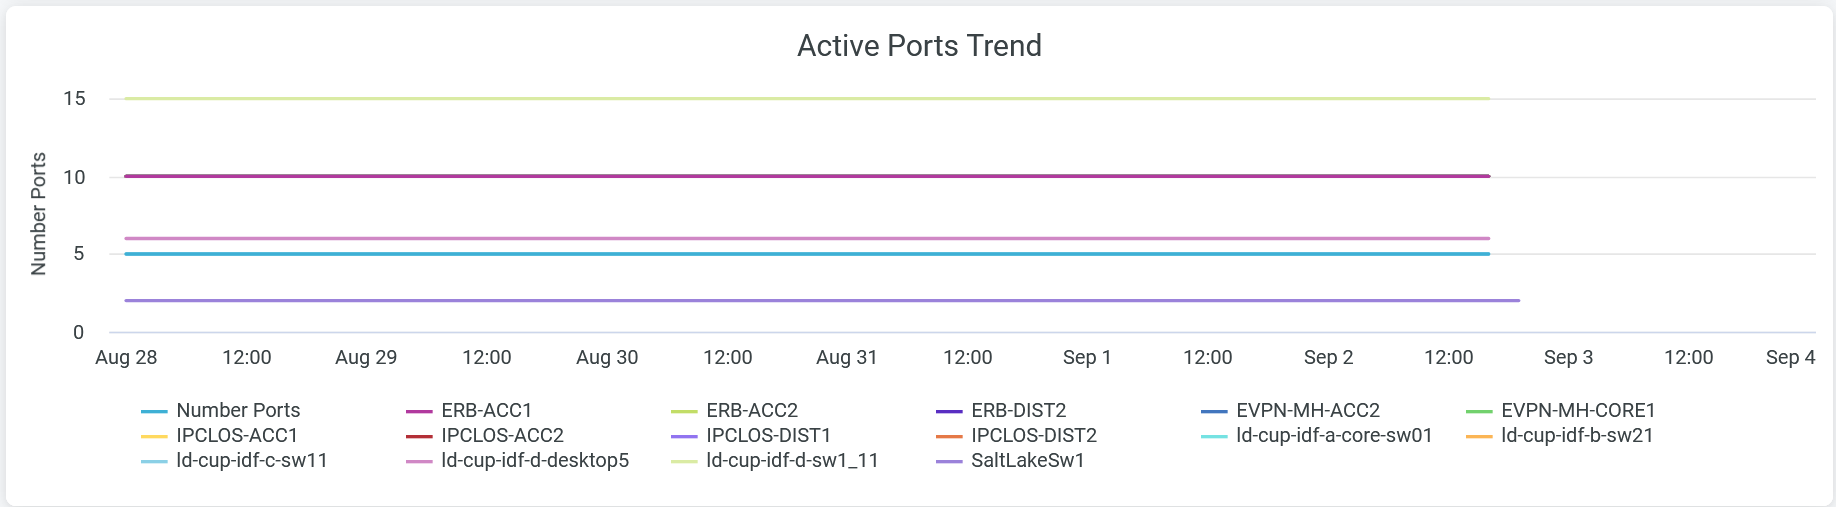
Place the cursor on a line graph, which represents a switch, to see the actual number of ports active on that switch.
Click the chart to see a pop-up menu with the option to open the chart in a new window with additional details. You can generate the chart by the hostname or the interface names of the selected switch.
The legend below the chart shows hostname of switches. To hide port details of a switch from the chart and see only details of the remaining ports from other switches, click the name of the switch in the legend below.
Trend by Switch GBs
Figure 8 shows the Trend by Switch GBs tile.
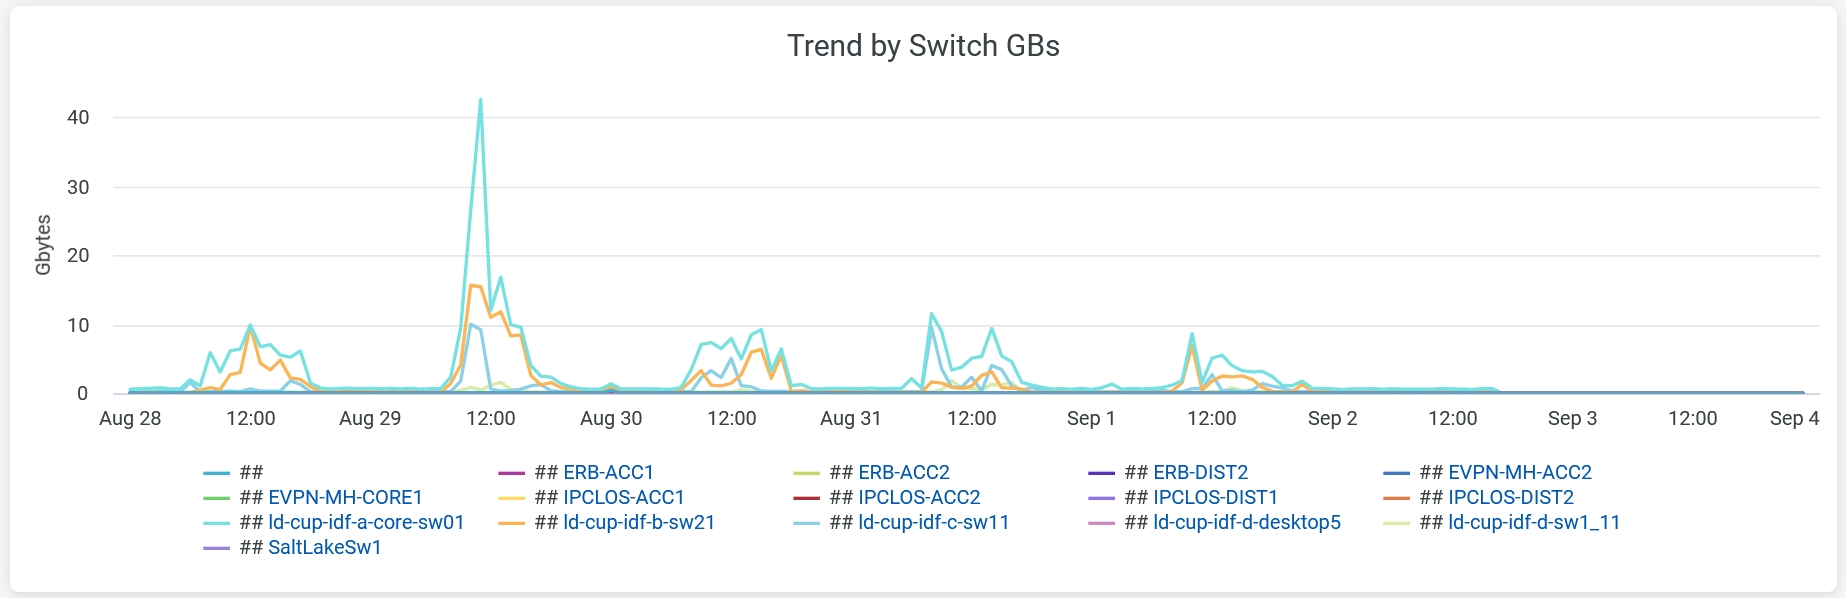
The tile shows the traffic trend on a switch over a period of time.
Place the cursor on a line graph, which represents a switch, to see the actual number of ports active on that switch.
Click the chart to see a pop-up menu with the option to open the report in a new window with additional details. Select the option to open the report in a new window. You can view the details as a chart or as a table and also download the report. You can sort the details by:
-
Show All—Traffic statistics on all the interfaces on the switch.
-
By Report Local Time—Traffic statistics on the switches at frequent intervals.
-
By ID—Traffic statistics for the interface ID.
-
By Client Info Host Name—Traffic statistics grouped by the hostnames of client devices.
-
By Hostname—Traffic statistics for the switch hostname.
-
By LLDP neighbor Local Parent Iface Name—Traffic statistics by LLDP port settings.
-
By Interface Name—Traffic statistics for the switch interfaces.
-
By Client Info Iface Name—Traffic statistics for the client interfaces.
-
By Client Info VLAN Name—Traffic statistics grouped by VLANs.
To hide the details of a switch from the chart and see only the details of the remaining switches, click the name of the switch in the legend below the chart.