Wired Site Comparison
Compare site performance to proactively troubleshoot connectivity and performance issues on your wired network.
On the Wired Site Comparison dashboard, you can see service-level expectation (SLE) metrics and traffic performance of different sites in separate graphs. You can compare and monitor sites in terms of SLE metrics, performance, interface usage, bandwidth, and Power over Ethernet (PoE). You can use the information to proactively troubleshoot connectivity and performance issues in the wireless network of your organization.
Features and Benefits
-
Tracks the performance of systems, applications, and the network and identifies the sites in which the network performance is below the expected standard.
-
Monitors wired network traffic, identifies bandwidth usage, and tracks the busiest switches and interfaces to provide a comprehensive view of your organization's network for efficient management.
-
Provides visibility of devices and applications that use the network's bandwidth.
-
Tracks traffic activity that you can use to identify and troubleshoot network incidents faster or even prevent these incidents from happening.
Before You Begin
-
See the Juniper Mist Wired Configuration Guide for the wired configuration details.
-
See Mist Premium Analytics Trial License to know about license requirements for the Juniper Mist Premium Analytics dashboard.
- Become familiar with the options available on the Juniper Mist Premium Analytics dashboard. See Figure 3.
Access Wired Site Comparison Dashboard
-
In the Juniper Mist portal, click Analytics > Premium
Analytics .
Figure 1: Access Wired Site Comparison Analytics

Wired Site Comparison Tiles
Site SLE Summary
Figure 2 shows the site SLE summary tile.
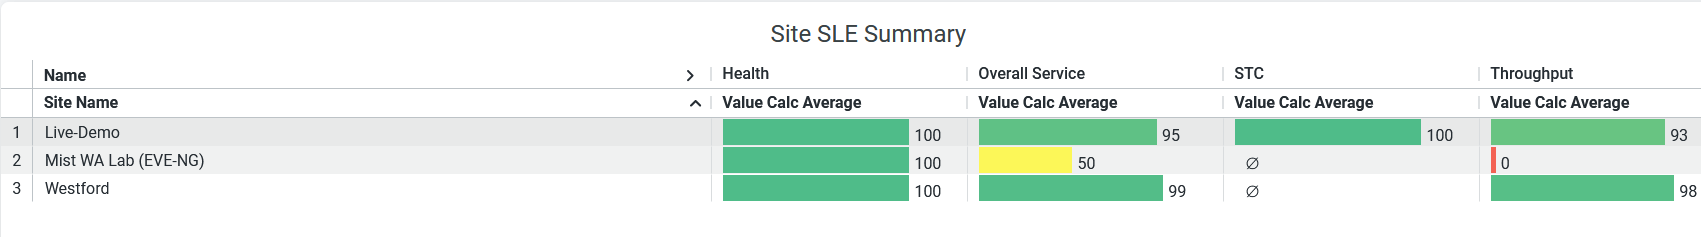
The Site SLE Summary tile displays the percentage of time that the SLE metrics met the specified goal within a specific time range. The Juniper Mist portal displays each SLE metric as a percentage that represents the success rate of the metric. The tile displays:
- Health—Shows the switch health SLE success rate. With this information, you can identify bad user minutes resulting from various conditions.
- Overall Service—Identifies the number of connections that experience the specified SLEs. In the above sample, 99 percent of the connections in the Westford site and 95 percent of the connections in the Live-Demo site meet the specified SLE goal. In the Mist WA Lab site, only 50 percent of the connections meet the specified SLE goal.
- STC—Shows the percentage of successful connections. In the above sample, 100 percent of the connections in the Live-Demo site are successful.
- Throughput—Identifies the percentage of time that the wired users pass traffic without any disruptions. In the above sample, 93 percent of the connections in the Live-Demo site achieve the specified throughput successfully. The graph shows 0 percent SLE success rate for the Mist WA Lab site, indicating that all the wired sessions face issues in this site.
Site Performance Comparison
Figure 3 shows the site performance comparison tile.
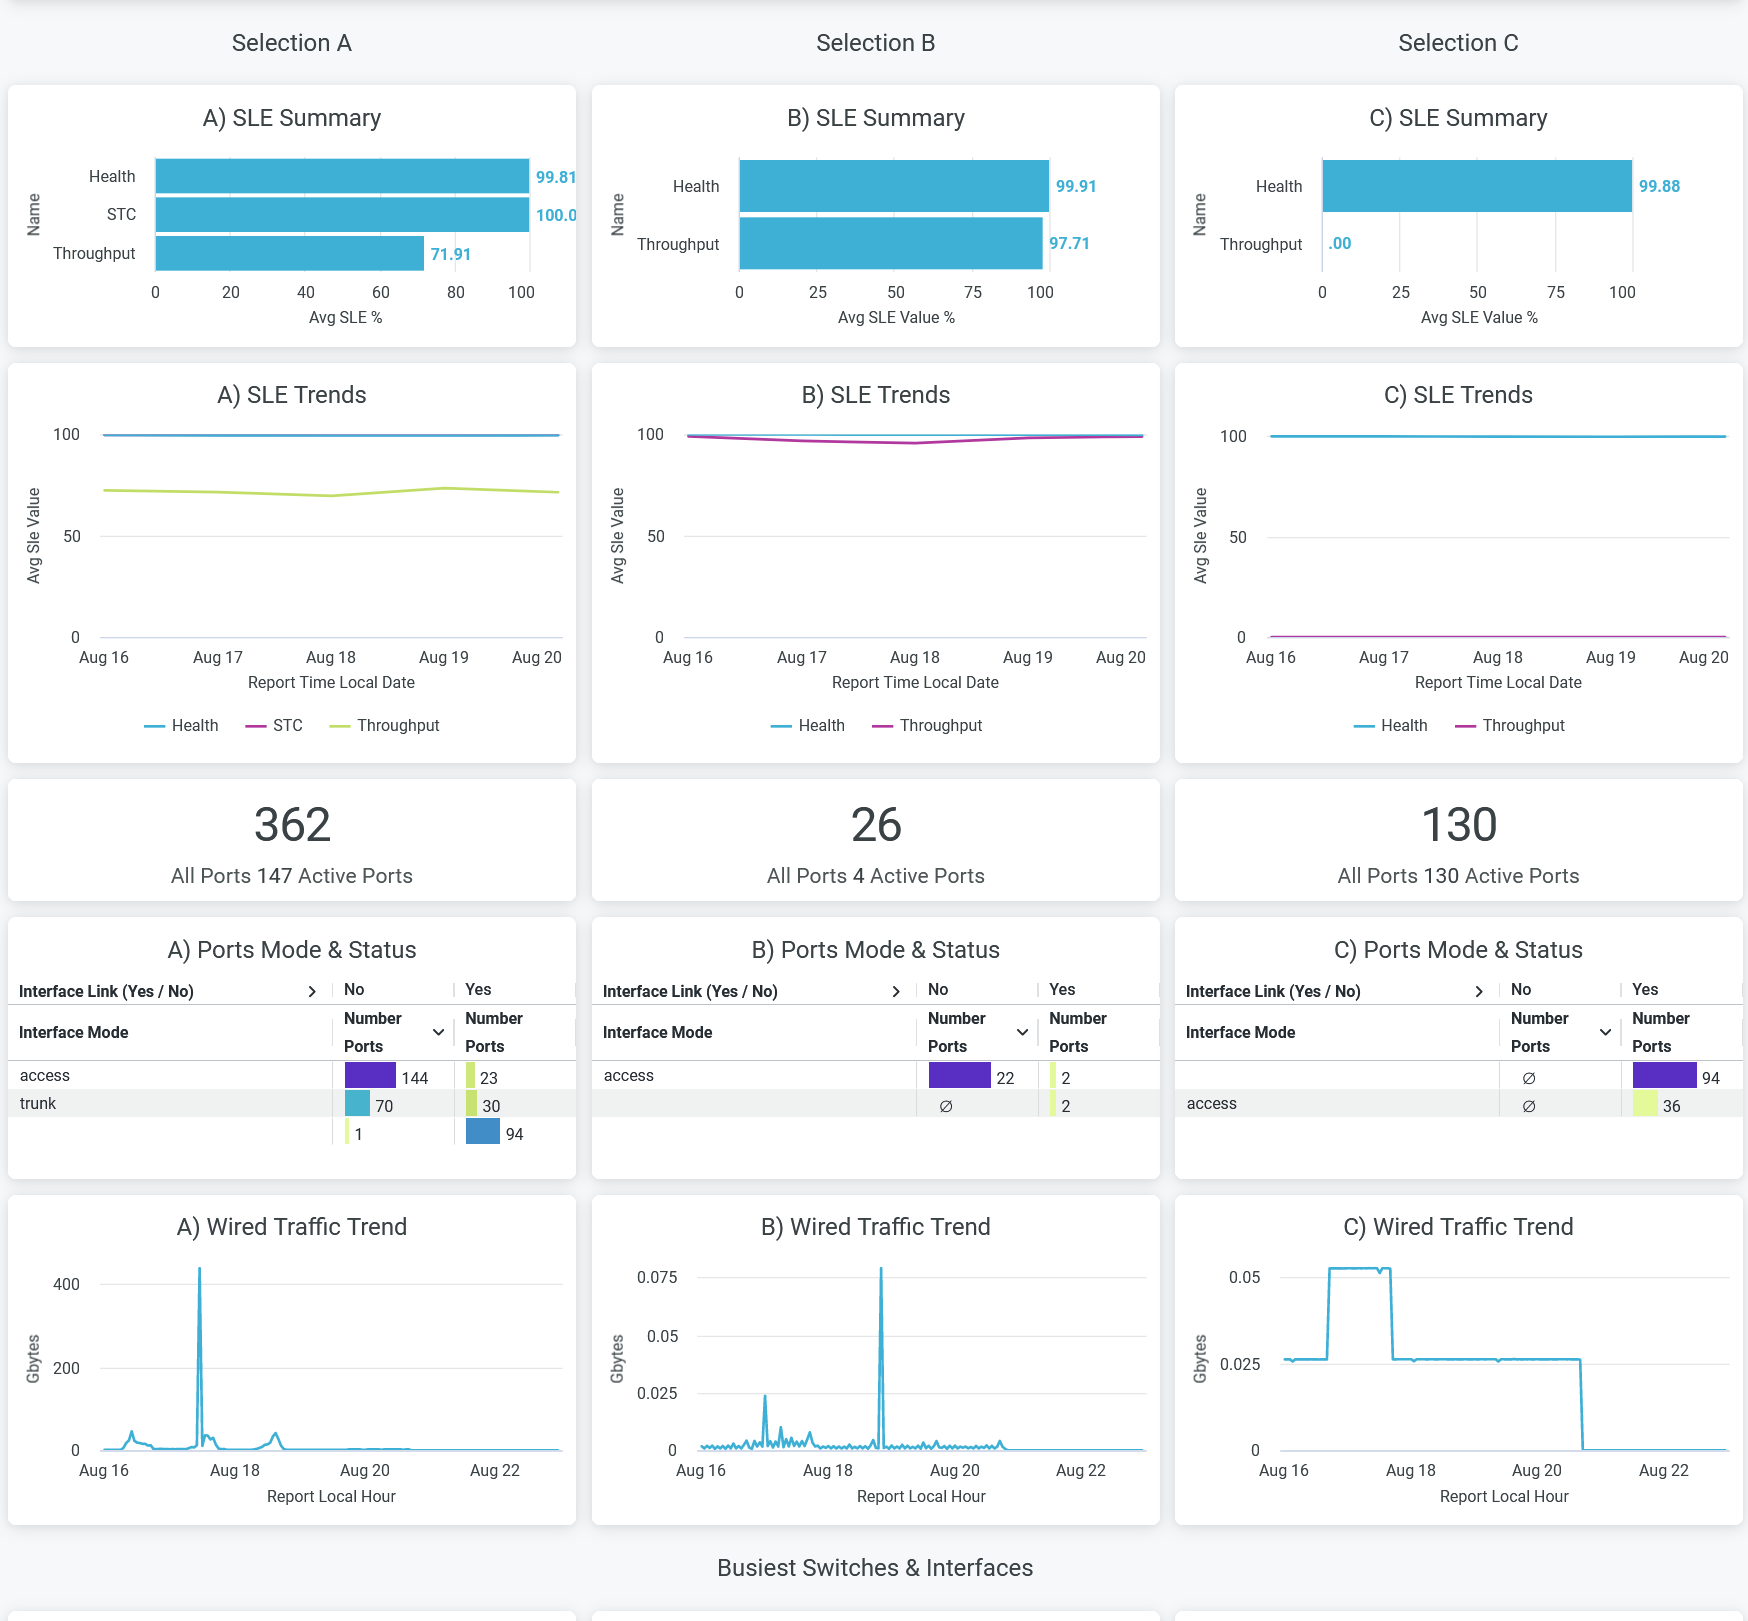
The Site Performance Comparison tile compares and displays site performance measures in terms of the following parameters:
- SLE Summary—Compares the performance of sites in terms of SLE parameters such as health, successful connects, and throughput details. In this tile, you see the success rate or success percentage of each SLE parameter in a bar graph.
- SLEs trends—Displays a graphical representation of trends related to the health and throughput SLE metrics for the selected sites.
- Ports in Use—Displays the number of active ports out of the total number of ports for each site. In the above sample, site A has 147 active ports out of a total of 362 ports.
- Ports Mode and Status—Displays the interface mode for the active ports. For site A, out of 147 active ports, 144 ports operate in trunk mode and 3 ports operate in access mode.
- Wired Traffic Trends—Displays analytics for wired traffic in each site for the selected period of time.
Busiest Switches and Interfaces
Figure 4 shows the busiest switches and interfaces in the wired network.
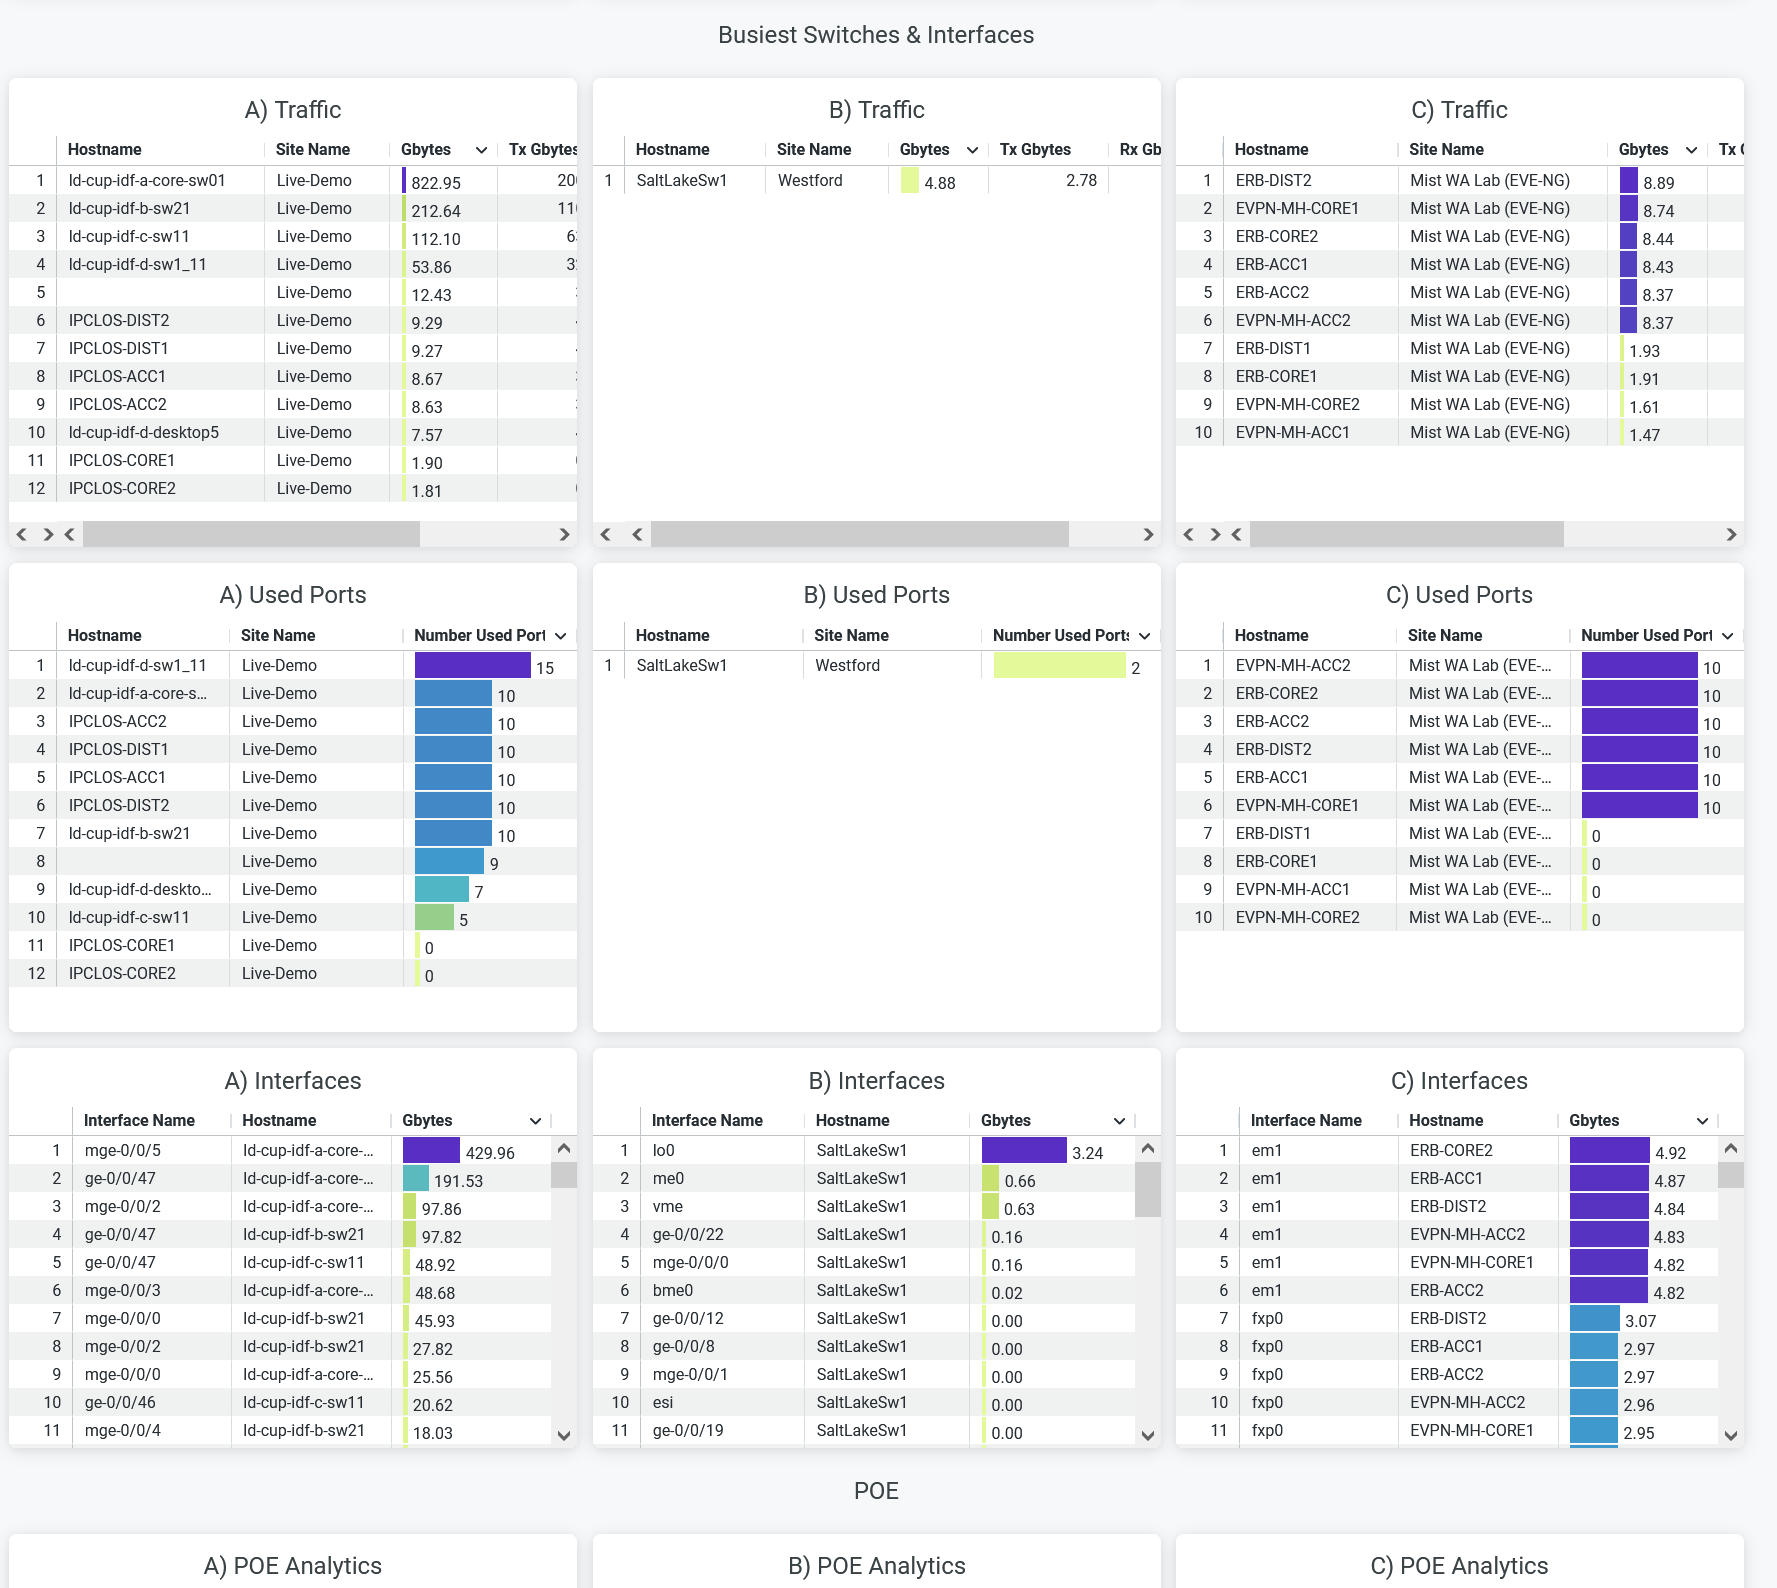
The Busiest Switches and Interfaces tile compares the usage of the ports and the interfaces that you've provisioned in the wired networks of the selected sites.
- Traffic—Displays the aggregate client traffic that Juniper Mist detects on the switches of the selected sites. The tile orders the switches by maximum usage. You can see the hostname of each switch next to the site name. The Tx column shows the volume of traffic that a switch transmits, and the Rx column shows the volume of traffic that a switch receives.
- Used Ports—Displays the number of ports that the switches use. The tile orders the switches by the maximum number of used ports.
- Interfaces—Displays the active interfaces on the switches. The tile orders the interfaces based on the traffic volume.
POE Analytics
Figure 5 shows the PoE Analytics tile.
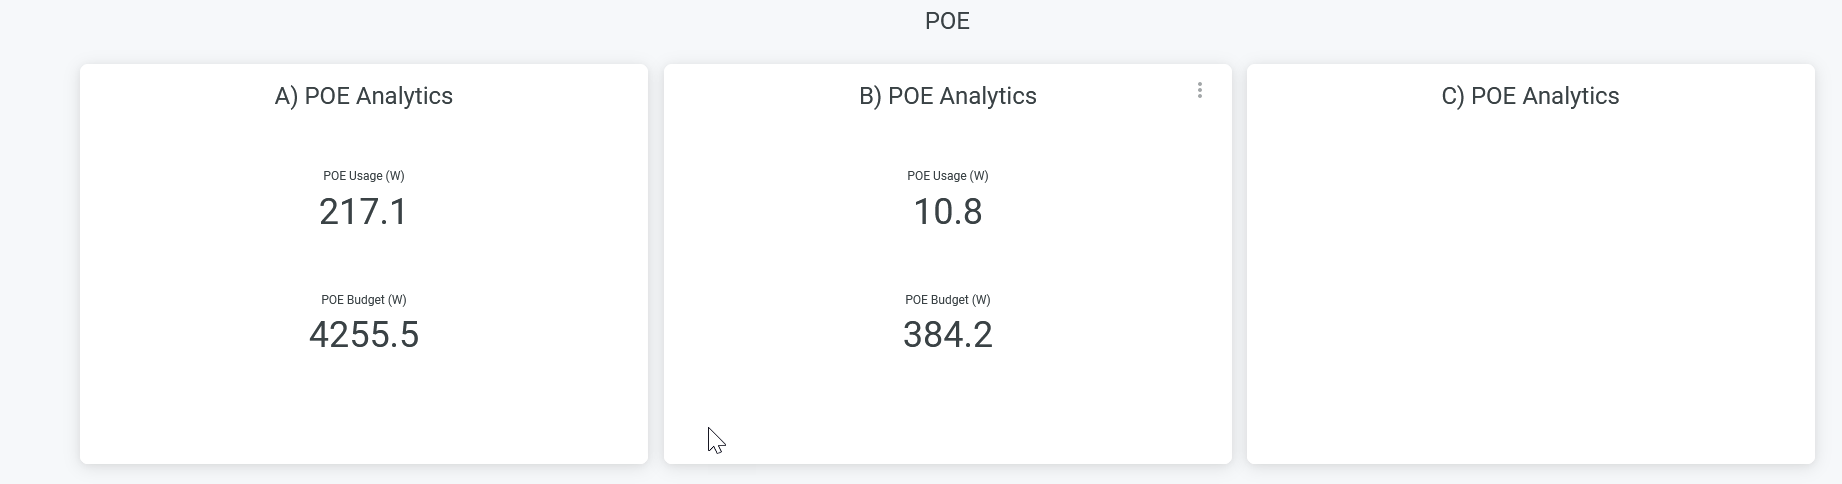
The tile displays the Power over Ethernet (PoE) usage details and the PoE budget details of the selected sites. By knowing the PoE budget and usage details, you can effectively manage the power distribution among the devices and plan network expansion or addition of new devices.