Sustainability Analytics
View insights about the power-over-ethernet (PoE) consumption of the wired switches.
You can also use PoE analytics details to plan initiatives that support sustainability and improve the overall resource efficiency. You can anticipate changes and future demands, so that you can plan for optimized usage of your switches and ports.
This dashboard provides:
- PoE usage insights at different levels—organization, site, floor, switch, and port
- Total number of PoE switches out of the currently deployed switches.
- PoE budget and consumption.
- Powered Device (PD) count by 802.af, 802.3at, and 802.3bt standards, and LAN.
Features and Benefits
- Monitors PoE consumption against allocated PoE budgets to determine which ports are drawing more power than anticipated.
- Identifies the switches and the clients that are experiencing PoE problems.
- Generates analytics about PoE usage at the site, floor, and switch level to help you efficiently plan your resources.
Before You Begin
-
Refer to the Juniper Mist Wired Configuration Guide for the wired configuration details.
-
See Mist Premium Analytics Trial License to know about license requirements for the Juniper Mist Premium Analytics dashboard.
- Become familiar with the options available on the Juniper Mist Premium Analytics dashboard. See Figure 3.
Access Sustainability Analytics Dashboard
-
In the Juniper Mist portal, click Analytics > Premium
Analytics .
Figure 1: Access Sustainability Analytics

Sustainability Analytics Tiles
The Sustainability Analytics dashboard includes various tiles that provide graphical representations of data. You can use the dashboard to easily understand the PoE utilization details.
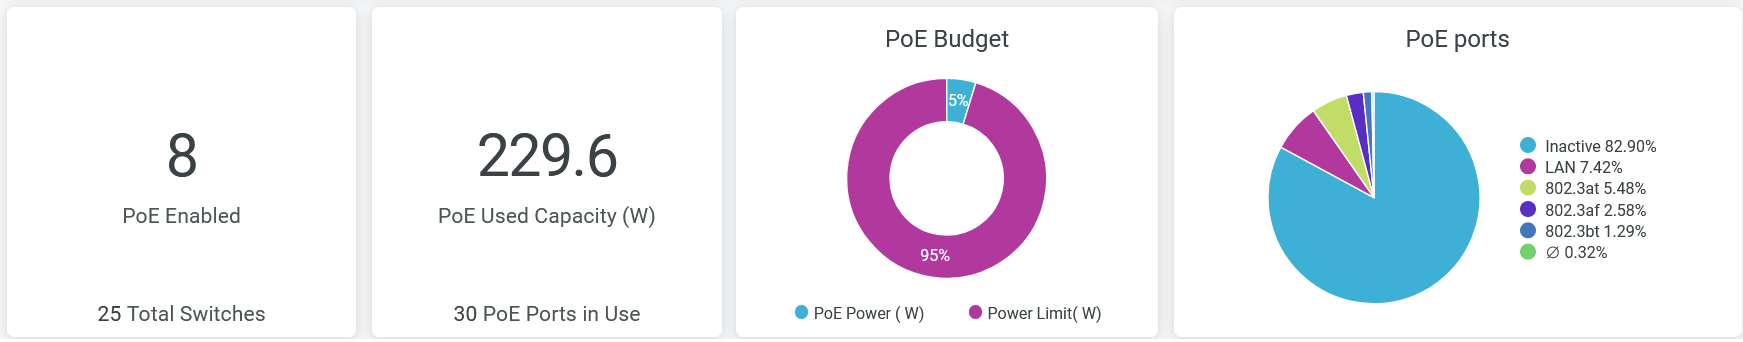
The Figure 2 tile displays:
-
Number of switches with PoE-enabled ports.
-
PoE capacity that the active PoE ports use.
-
Percentage of the power budget that the PoE ports use. A PoE power budget is the total amount of power output available to the PoE ports of the switch.
-
Percentage of active PoE ports in each site.
According to Figure 2:
-
The organization has eight PoE-enabled switches, out of a total of 25 switches.
-
Thirty PoE-enabled ports use 229.6-W PoE capacity.
-
PoE ports use 5 percent of the allocated PoE budget and 95 percent of the available PoE capacity is unused.
-
82.90 percent of the total available PoE ports are inactive.
- PoE Stats per Site
- PoE Stats per Floor
- PoE Types and Power Usage
- PoE Ports per Switch
- Top 10 PoE Ports
- PoE Usage Analytics
PoE Stats per Site
Figure 3 shows the PoE statistics for each site.
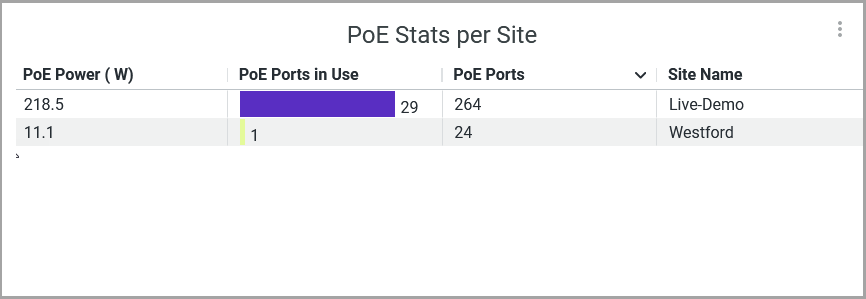
The tile displays the following details:
- PoE Power (W)—Total PoE power consumption by all the PoE-enabled ports in each site.
- PoE Ports in Use—Number of active PoE ports in each site.
- PoE Ports—Total number of PoE ports available in each site.
- Site Name—Name of the site.
PoE Stats per Floor
Figure 4 shows the PoE statistics per floor.
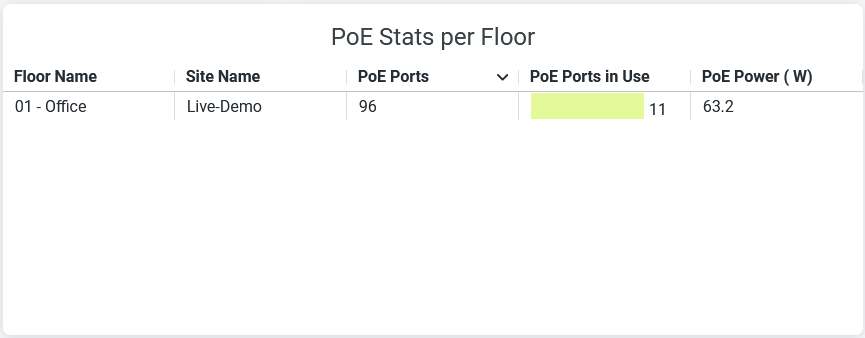
The tile displays the following details:
- Floor Name—Name of the floor in the site.
- Site Name—Name of the site.
- PoE Ports—Total PoE ports available in the floor.
- PoE Ports in Use—Number of active PoE ports in the floor.
- PoE Power (W)—Total PoE consumption by all the ports in the floor.
PoE Types and Power Usage
Figure 5 shows PoE types and power usage data.
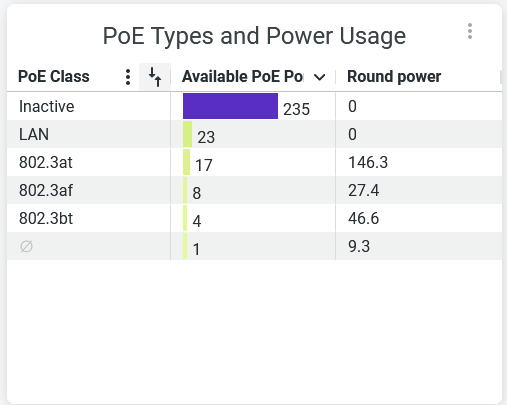
The tile displays the following details:
- PoE Class—PoE standards class and inactive PoE ports.
- Available PoE Ports—Number of active PoE ports in each PoE class and inactive PoE ports.
- Round power—PoE power utilization by all the ports in each PoE class.
PoE Ports per Switch
Figure 6 displays the PoE capacity utilization details on a switch. You can also see the power consumption by client devices connected to the PoE ports.
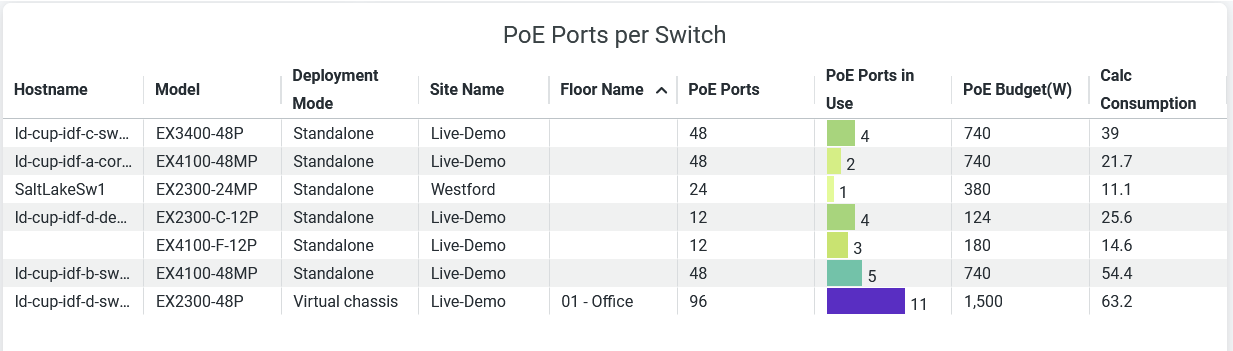
You can map the PoE capacity utilization and client device power consumption metrics to each port by using the following details on the tile:
-
Hostname—Hostname of the switch.
-
Model—Model of the switch.
-
Deployment Mode—Deployment type of the switch
-
Standalone
-
Virtual Chassis
-
-
Site Name—Site where the switch is located.
-
Floor Name—Floor where the switch is located.
-
PoE Ports—Number of PoE-enabled ports available on the switch.
-
PoE Ports in Use—Number of PoE-enabled ports currently active on the switch.
-
PoE Budget (W)—Power allocated for all the PoE ports in a switch.
-
Calc Consumption—Actual power consumption by active PoE ports in a switch.
Top 10 PoE Ports
The Figure 7 tile displays the top PoE ports based on the amount of allocated power that each PoE port uses. You can also see the power consumption of the client devices connected to the PoE ports.
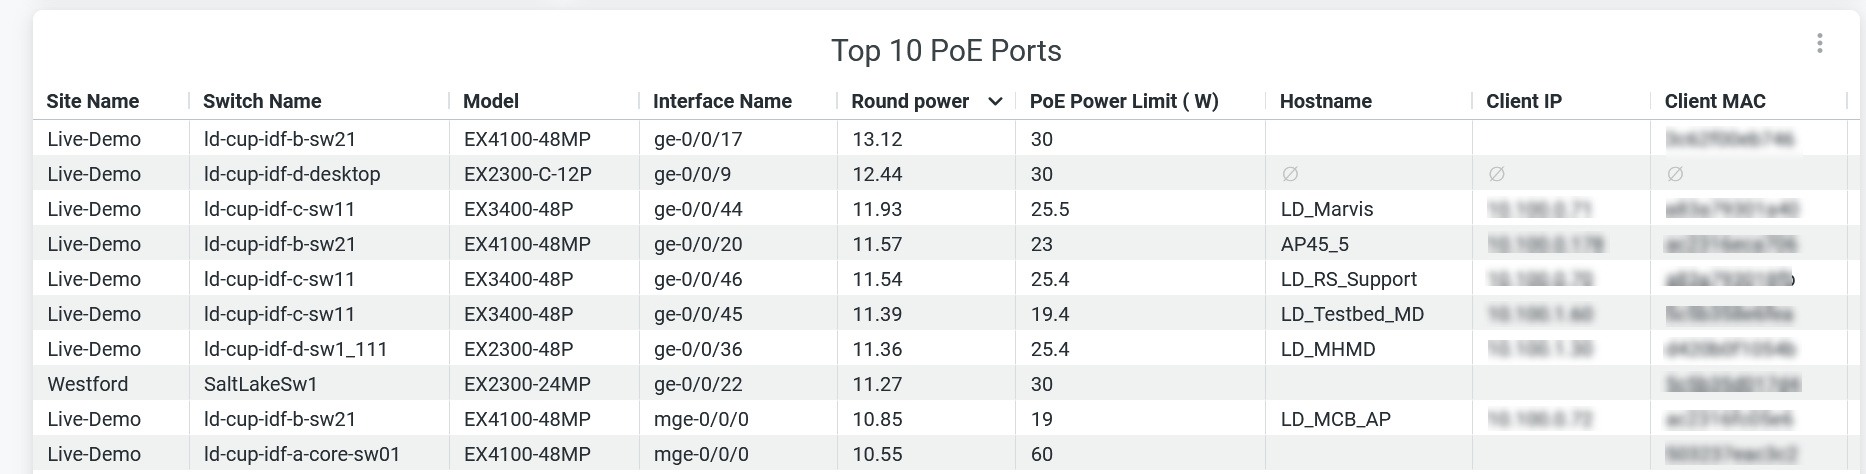
You can map the power consumption metrics to each PoE port by using the following details on the tile:
-
Site Name—Name of the site where the switch is located.
-
Switch Name—Name of the switch.
-
Model—Model of the switch.
-
Interface name—PoE interface configured on the switch.
-
Round Power (W)—Power consumption by the PoE port.
-
PoE Power Limit (W)—Power allocated for the PoE port.
-
Hostname—Hostname of the switch.
-
Client IP—IP address of the client device.
-
Client MAC—MAC address of the client device.
-
Interface Admin Status—The status that shows whether the interface is administratively up.
-
Full Duplex—The capability of the interface to operate in full-duplex mode.
-
Interface Mbps—Configured speed on the interface.
-
Interface Mode—Interface mode (trunk or access).
-
MTU—MTU value configured on the interface.
PoE Usage Analytics
The Figure 8 section includes the tiles displaying the total PoE usage in the wired network, PoE usage per switch, and PoE usage per interface.
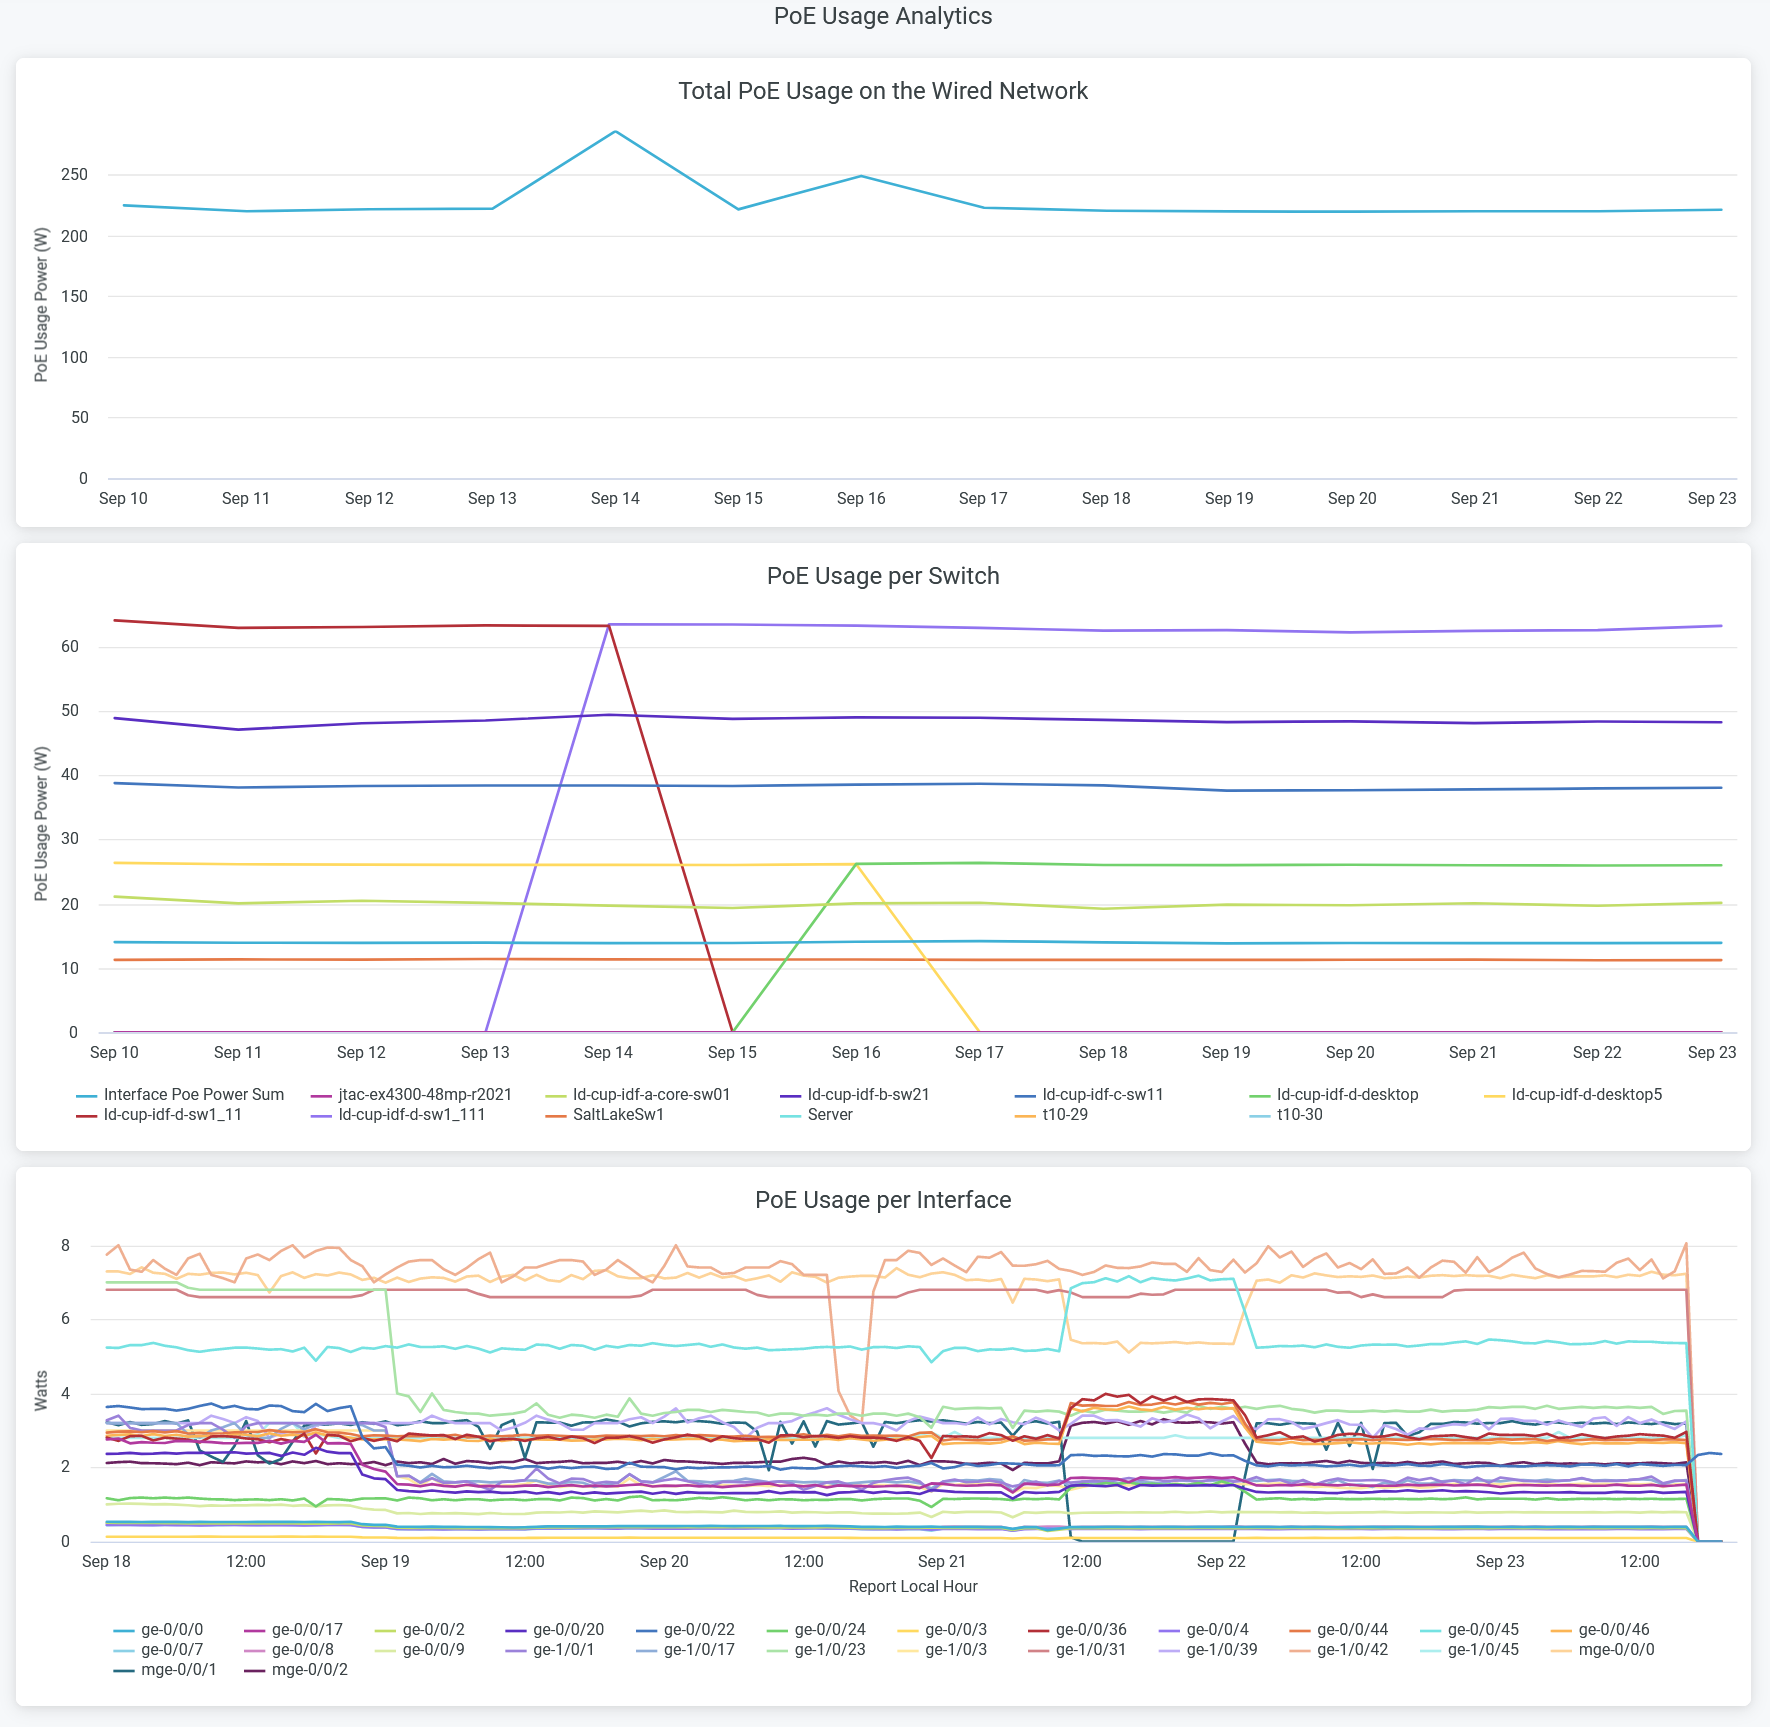
- Total PoE Usage on the Wired Network—Displays total PoE power consumption by the wired network over a period of 14 days. Hover over the chart to view the PoE power consumption at a given day.
- PoE Usage per Switch—Displays total PoE power consumption by different switches in the wired network. Lines in the graph represent switches. You can place the cursor on the line to see PoE power consumption by a particular switch. To hide data for a switch and see data for only the remaining switches, click the switch name in the legend.
- PoE Usage per Interface—Displays total PoE power consumption by different interfaces in the wired network. Lines in the graph represent interfaces. You can place the cursor on the line to see PoE power consumption by a particular interface. To hide data for a interface and see data for only the remaining interfaces, click the interface name in the legend.