PoE Switch Details
View the switch-specific insights for Power over Ethernet (PoE) ports, power draw, and consumption trends.
Features and Benefits
- Monitors PoE consumption against allocated PoE budgets to determine which ports are drawing more power than anticipated.
- Generates analytics about PoE usage at switch-level to help you efficiently plan usage of your switches.
Before You Begin
-
See Juniper Mist Wired Configuration Guide for the wired configuration details.
-
See Mist Premium Analytics Trial License to know about the license requirements for the Juniper Mist Premium Analytics dashboard.
- Become familiar with the options available on the Juniper Mist Premium Analytics dashboard. See Figure 3.
Access PoE Switch Details Dashboard
PoE Switch Details Tiles
The PoE Switch Details dashboard includes various tiles that provide graphical representations of data. You can use the dashboard to easily understand the PoE utilization details per switch.

The Figure 2 tile displays:
-
Number of PoE-enabled ports in use.
-
PoE capacity that the active PoE ports are using.
-
Percentage of PoE ports classified by the activity status and PoE class.
-
PoE statistics in each PoE class. The details include:
- PoE Class—PoE standards class and inactive PoE ports.
- Available PoE Ports—Number of active PoE ports in each PoE class and inactive PoE ports.
- Round power—PoE power utilization by all the ports in each PoE class.
According to Figure 2:
-
27 PoE ports are in use, out of a total of 372 PoE ports.
-
207 watt of PoE power consumed out of available 9324-watt capacity.
-
89.84 percent of the total available PoE ports are inactive.
-
320 PoE ports are inactive and 27 active PoE ports are consuming approximately 207 watt of PoE power.
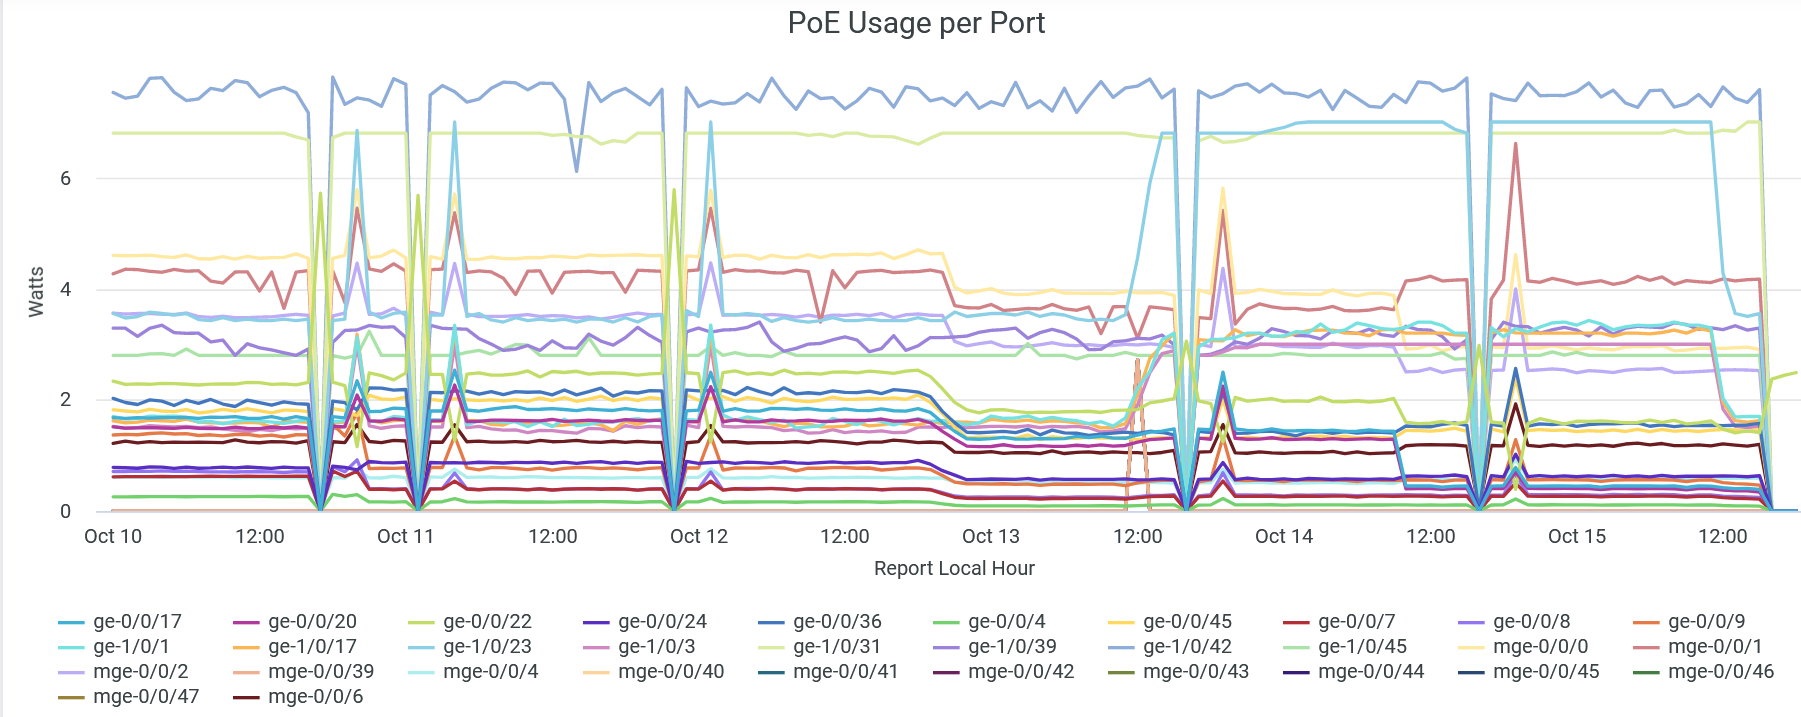
PoE Usage Per Port
The tile displays the PoE usage per port for a selected period of time.

You can view the total PoE power consumption by different interfaces in the wired network. Lines in the graph represent interfaces. You can place the cursor on a line to see the PoE power consumption by a particular interface.
To hide data for an interface and see data for only the remaining interfaces, click the interface name in the legend.
Interface Details
The tile displays the details of the switches with PoE ports and PoE utilization on a switch.

You can see the following details on the tile:
-
Switch Name—Name of the switch.
-
Model—Model of the switch.
-
Interface Name—PoE interface configured on the switch.
-
Client IP—IP address of the client device.
-
Client Info MAC—MAC address of the client device.
-
VLAN Name—Name of the associated VLAN.
-
Link—Interface mode (trunk or access).
-
PoE Mode—PoE standards class.
-
PoE (W)—Power consumption by the PoE port.

