- play_arrow Working With Network Director
- play_arrow About Network Director
- play_arrow Installing Network Director
- play_arrow Accessing Network Director
- play_arrow Understanding Network Director System Administration and Preferences
- play_arrow Getting Started with Network Director
-
- play_arrow Working with the Dashboard
- play_arrow About the Dashboard
- play_arrow Using the Dashboard
- play_arrow Dashboard Widget Reference
-
- play_arrow Working in Build Mode
- play_arrow About Build Mode
- play_arrow Discovering Devices
- play_arrow Setting Up Sites and Locations Using the Location View
- Understanding the Location View
- Setting Up the Location View
- Creating a Site
- Configuring Buildings
- Configuring Floors
- Setting Up Closets
- Assigning and Unassigning Devices to a Location
- Changing the Location of a Device
- Deleting Sites, Buildings, Floors, Wiring Closets, and Devices
- Configuring Outdoor Areas
- play_arrow Building a Topology View of the Network
- play_arrow Creating Custom Device Groups
- play_arrow Configuring Quick Templates
- play_arrow Configuring Device Settings
- play_arrow Configuring Authentication, Authorization, and Access for Your Network
- play_arrow Configuring Interfaces and VLANs
- Understanding Port Profiles
- Creating and Managing Port Profiles
- Assigning and Unassigning Port Profiles from Interfaces
- Managing Auto Assignment Policies
- Creating Auto Assignments
- Configuring Easy Config Setup
- Understanding Port Groups
- Creating and Managing Port Groups
- Understanding VLAN Profiles
- Creating and Managing VLAN Profiles
- Assigning a VLAN Profile to Devices or Ports
- play_arrow Configuring Firewall Filters (ACLs)
- play_arrow Configuring Class of Service (CoS)
- play_arrow Configuring Media Access Control Security (MACsec)
- play_arrow Configuring Link Aggregation Groups (LAGs)
- play_arrow Creating and Managing Fabrics
- Understanding Junos Fusion
- Understanding Junos Fusion Enterprise
- Software Requirements for Junos Fusion
- Creating and Managing Fusion Configuration Templates
- Managing Fusion Fabrics
- Creating and Managing Satellite Software Upgrade Groups
- Understanding Layer 3 Fabrics
- User Privileges Required for the DHCP and File Server While Using Zero Touch Provisioning
- Managing Layer 3 Fabrics
- Creating Layer 3 Fabrics
- Editing Layer 3 Fabrics
- Viewing Layer 3 Fabric Connectivity
- Performing Layer 3 Fabric Connectivity Checks
- play_arrow Configuring VRRP Profiles
- play_arrow Managing Network Devices
- Viewing the Device Inventory Page
- Physical Topology
- Viewing Profiles Assigned to a Device
- Viewing the Physical Inventory of Devices
- Viewing Licenses With Network Director
- Viewing a Device's Current Configuration from Network Director
- Assigning Devices to Logical Category
- Accessing a Device’s CLI from Network Director
- Accessing a Device’s Web-Based Interface from Network Director
- Deleting Devices
- Rebooting Devices
- Viewing Virtual Machines
-
- play_arrow Working in Deploy Mode
- play_arrow About Deploy Mode
- play_arrow Deploying and Managing Device Configurations
- Deploying Configuration to Devices
- Managing Configuration Deployment Jobs
- Deploy Configuration Window
- Importing Configuration Data from Junos OS Configuration Groups
- Enabling High-Frequency Traffic Statistics Monitoring on Devices
- Configuring Network Traffic Analysis
- Approving Change Requests
- Enabling SNMP Categories and Setting Trap Destinations
- Understanding Resynchronization of Device Configuration
- Resynchronizing Device Configuration
- Managing Device Configuration Files
- Creating and Managing Baseline of Device Configuration Files
- play_arrow Deploying and Managing Software Images
- play_arrow Managing Devices
- play_arrow Setting Up Zero Touch Provisioning for Devices
-
- play_arrow Monitoring Devices and Traffic
- play_arrow About Monitor Mode
- play_arrow Monitoring Traffic
- play_arrow Monitoring Client Sessions
- play_arrow Monitoring Devices
- play_arrow Monitoring and Analyzing Fabrics
- play_arrow Monitoring Virtual Networks
- play_arrow General Monitoring
- play_arrow Monitor Reference
- 802.11 Packet Errors Monitor
- Access vs. Uplink Port Utilization Trend Monitor
- Current Sessions Monitor
- Current Sessions by Type Monitor
- Error Trend Monitor
- Equipment Summary By Type Monitor
- Node Device Summary Monitor
- Port Status Monitor
- Port Status for IP Fabric Monitor
- Port Utilization Monitor
- Power Supply and Fan Status Monitor
- Resource Utilization Monitor for Switches, Routers, and Virtual Chassis
- Top Users Monitor
- Top Sessions by MAC Address Monitor
- Session Trends Monitor
- Status Monitor for Junos Fusion Systems
- Status Monitor for Layer 3 Fabrics
- Status Monitor for Switches and Routers
- Status Monitor for Virtual Chassis
- Status Monitor for Virtual Chassis Members
- Top Talker - Wired Devices Monitor
- Traffic Trend Monitor
- Unicast vs Broadcast/Multicast Monitor
- Unicast vs Broadcast/Multicast Trend Monitor
- User Session Details Window
- Virtual Chassis Topology Monitor
- VC Equipment Summary By Type Monitor
-
- play_arrow Using Fault Mode
- play_arrow About Fault Mode
- play_arrow Using Fault Mode
- play_arrow Fault Reference
-
- play_arrow Working with Network Director Mobile
- play_arrow About Network Director Mobile
- play_arrow Getting Started with Network Director Mobile
- play_arrow Working in the Network Director Mobile Dashboard Mode
- play_arrow Working in the Network Director Mobile Devices Mode
-
Understanding Report Mode in Network Director
In Report mode in Junos Space Network Director, you can create standardized reports from the monitoring and fault data collected by Network Director. An essential part of the network management lifecycle, reporting provides administrators and management insight into the network for maintenance, troubleshooting, trend and capacity analysis, and provides records that can be archived for compliance requirements.
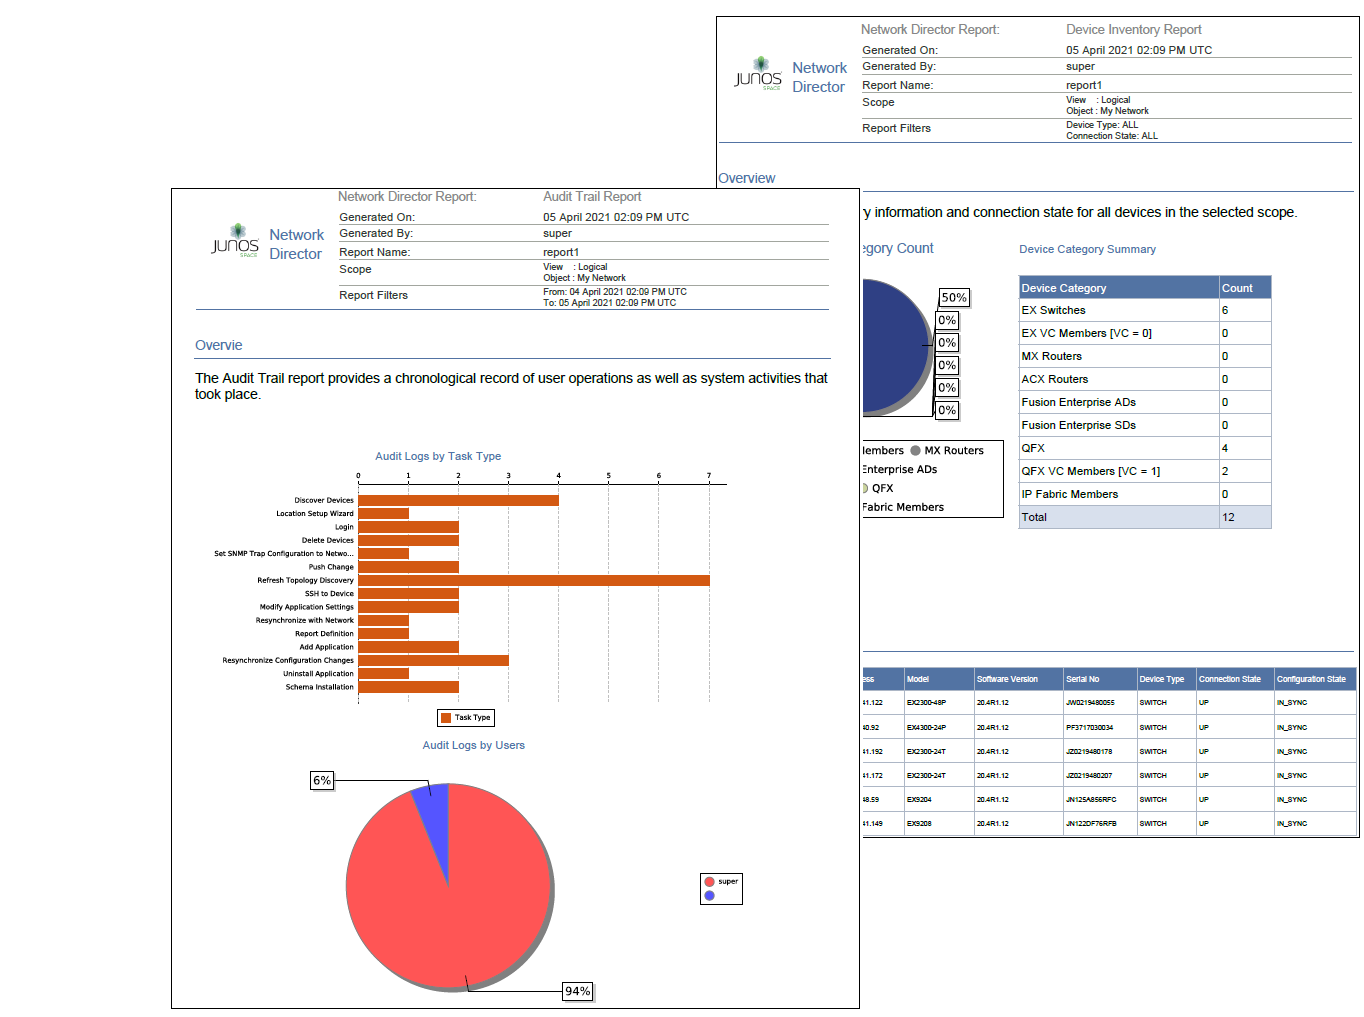
Network Director provides reports in PDF and HTML formats that use graphs and tables to clearly convey data. Reports are also available in CSV format for importing into spreadsheets. Figure 1 shows some examples of PDF reports.

In addition to choosing the formats for your reports, you can:
Run reports on-demand or schedule them to run at a specific time or on a recurring schedule.
Select the portion of network you want the report to cover by selecting a scope in the View pane when you create a report definition. For example, you can run a Device Inventory report on your entire network, on all devices in a wiring closet, or on all EX2300 switches.
Select the report options—for example, the historical time frame you want an Audit Trail report to cover or the type of devices you want to include in a Device Inventory report.
Have reports sent to an e-mail address or automatically archived on a file server.
The process for generating reports is simple. Select a scope in the View pane and then create a report definition by using the Create Report Definition wizard. When you complete the report definition, the reports are immediately scheduled to run according to the scheduling choices you have made.