Help us improve your experience.

Let us know what you think.

Do you have time for a two-minute survey?


Managing the Topology View

Viewing the Network Topology

Topology View enables you to view all the discovered devices in your network, overlaid on a map. You can create sites, buildings, floors, outdoor areas, closets, and racks by using the Location wizard in Topology View. You can use the Topology View to zoom in or zoom out of a site or a building. You can also see the connectivity between a device and its immediate neighbors, alarms details, port details, and so on. An example of how the topology map looks like after you have added the location details is shown in Figure 1.
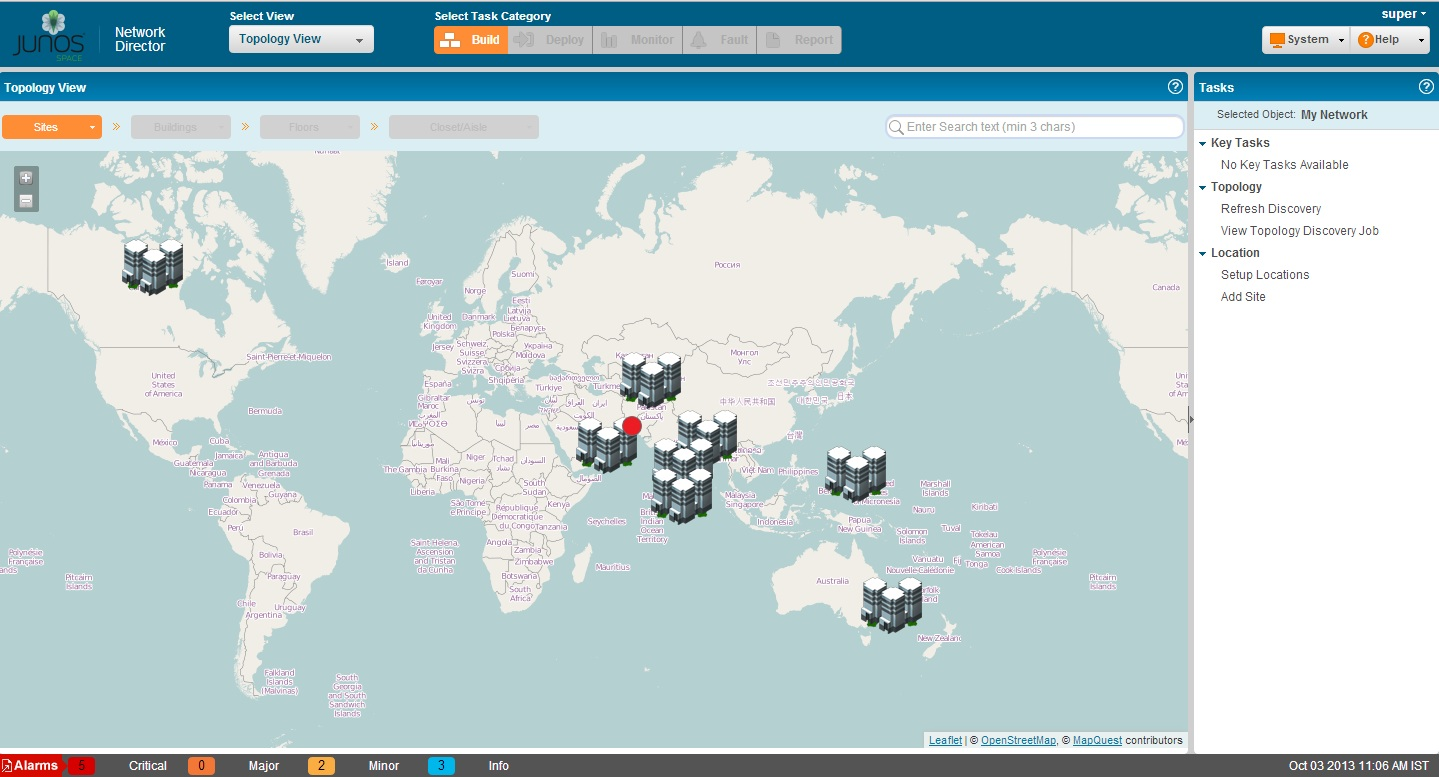
Figure 1: Main Topology WindowMain Topology Window

The topology display is created by layering the device images on top of the imported floor plan images.

In addition to the tasks outlined in the Topology View Tasks, you can perform the following tasks from the Topology View pane:

  • Zoom In and Zoom Out—You can use the zoom in () or zoom out() buttons to get a detailed or high-level view. Network Director enables you to zoom in and view details up to the rack level, if you have defined racks and assigned devices to the rack.

  • Pan—Network Director enables you to pan the topolog. You can move the devices to different parts on the topology by holding the mouse button down and dragging to a specific part of the map.

    Network Director displays the sites, buildings, and geographical coordinates on the topology map based on the address specified while setting up the locations. However, you can move the devices around to another location by selecting, dragging, and dropping the device to the correct location. For example, you can move a site from a US site to a Bengaluru site on the topology by using the Pan feature. This helps to determine the correct location of a site because while setting up the location details, it is not mandatory to provide the address information.

  • Search and Locate—You can search for all nodes such as sites, building, floors, specific devices, all devices in a floor, and so on by entering a search keyword or the complete name of the device in the Search field. On entering the search criteria, you might see the list of nodes or just one node based on the search criteria. When you select the node, Network Director locates the node and Topology View is panned to ensure the selected node is centered on the page. In cases where a device is at the edge of the map the corner is aligned accordingly to bring device in view.

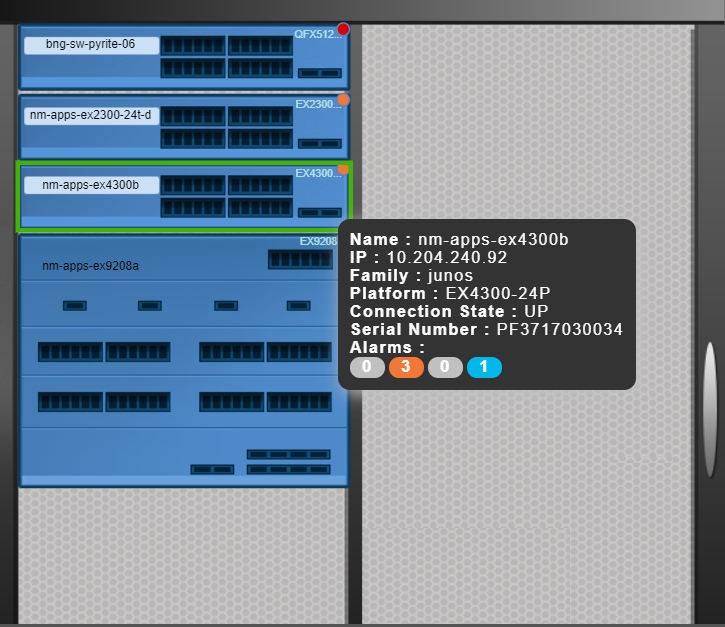
  • View details—If you mouse over a entity (site, building, device), the entity gets highlighted and Network Director displays details such as the building name or IP address and the number of active alarms on that entity. A colored dot that appears on the upper right corner of the entity identifies whether there are alarms on the entity and the color of the dot indicates the severity level of the alarm. See Table 1 to know more about the alarm severity indicator for each alarm severity.

    Table 1: Alarm Severity Indicator

    Alarm severity

    Indicator

    Critical

    Major

    Minor

    Informational

    Note:

    Each of these entities might have alarms of different severities. Network Director displays the indicator based on the most severe alarm on an entity. For example, if a device has 3 informational alarms and one major alarm, Network Director displays the indicator for the major alarm  ().

  • Highlight and select View Device Connectivity—Select a device and click View Device Connectivity, View VC Connectivity, or View Virtual Network Connectivity to view the selected device’s connectivity with other devices. Each of these tasks, except the View Device Connectivity, are visible only when you select a device that is part of a Virtual Chassis, or a Virtual network. The device images are displayed along with details such as name, IP address, and the connectivity link between the devices.

  • Navigation—Use the navigation breadcrumbs at the top of the page to navigate through sites, buildings, floors, closets, or aisles. For there are more than one entities at any give level, you can use the Down arrow in the breadcrumb to navigate to that entity. For example, if you want to navigate from floor-1 in building-1 to floor-3 in building-2, you can use the down arrow in the building breadcrumb to select building-2 and the down arrow in the floor breadcrumb to select floor-3.

  • Host Information—You can use the button to expand the members to view the host details. You can also view the virtual machines if the host is a hypervisor and managed by Network Director.

Refreshing the Topology

You can refresh the devices discovered and managed by Network Director from the Tasks pane in the Topology View. You can add the Refresh Topology task to the Key tasks in both the views if you will use this task frequently.

To refresh the device discovery process:

  1. Click Refresh Topology from Key Tasks or the Topology View pane.

    The Refresh Discovery window is displayed along with the SNMP details that you specified in the discovery options in the Device Discovery task page.

    If you have not specified the SNMP details while discovering the devices, proceed to Step 3.

  2. Select the SNMP version from the SNMP version table and click Discover. The Refresh Topology window appears displaying the progress of the topology discovery.
  3. If SNMP version details are not displayed in the SNMP version table, click Add on the Refresh Discovery window.

    The Add SNMP Settings dialog box is displayed.

    Select either SNMP V1/V2C or SNMP V3. Based on the selection, you need to enter the details as follows:

    • If you selected SNMP V1/V2C, specify a community string, which can be public, private, or a predefined string.

      Click Add in the Add SNMP Settings dialog box or click Add More to add more strings to the community. If you click Add More, when you are done adding all the strings, click Add to save the SNMP settings for V1/V2C.

    • If you selected SNMP V3, specify the following:

      • Enter a username.

      • Select the privacy type (AES 128, DES, or None).

      • Enter the privacy password (if AES 128 or DES). If you specify none for the privacy type, the privacy function is disabled.

      • Select the authentication type (MD5, SHA, or none).

      • Enter the authentication password (if MD5 or SHA). If you specify none for the authentication type, the authentication function is disabled.

      • Click Add to save the SNMP settings and close the dialog box, or click Add More to add additional configurations. If you clicked Add More, click Add to save the settings and close the dialog box.

      The specified details are displayed in the SNMP version table.

  4. Click Discover.

    The Refresh Topology window is displayed, showing details of the device discovery.

Viewing Topology

The Refresh Topology window displays the refresh device discovery job details as described in Table 2.

Table 2: Refresh Topology Job Details

Field

Description

Job Name

The Refresh topology job name along with the Job ID.

Start Time

The time at which the refresh discovery job is initiated.

End Time

The time at which the refresh discovery job is completed.

Percentage Progress

Displays the progress of the job in percentage. When the job is completed, displays 100 percentage.

Status

The status of the job. The status is In Progress until the job is completed.

Target Devices Count

The total number of targets for the discovery of devices.

Discovered Devices Count

The total number of discovered devices for which the SNMP parameters are specified.

Note:

In the Topology View, you can view the network connections of only those discovered devices for which LLDP, SNMP, and STP parameters are set.

Discovered Subnets Count

The total number of subnets discovered.

Targets

The Targets table displays the Management IP addresses of the devices discovered along with the status of the discovery process.

Use the right and left arrows to navigate through the discovered pages. You can specify the details to be displayed in a page by selecting the show items list box and specifying the number of items to be displayed in one page.

Click Close to close the Refresh Topology page and return to the main Topology page.

Viewing Topology Discovery Job

To view the discovery jobs in the Topology View, click View Topology Discovery Job. The Topology Discovery Jobs window opens displaying details of the topology related jobs as described in Table 3. To view any hidden column, mouse over column heading, select the down arrow, and then click Columns. Select the check box to display the hidden columns.

Table 3: Job Details for Topology Discovery

Field

Description

Job ID

For each job-based task, the audit log includes a job ID.

Job Name

The name of the job.

Percent

The percentage of completion of the job.

State

The status of the job:

  • Success—Job completed successfully

  • Failure—Job failed and was terminated

  • Job Scheduled—Job is scheduled but has not yet started

  • In progress—Job is has started, but not completed

  • Cancelled—Job is cancelled

Summary

Summary of the job scheduled and executed with status.

Scheduled Start Time

The UTC time on the client computer when the job is scheduled to start.

Actual Start Time

The actual time when the job started.

End Time

The time when the job was completed.

User

The login ID of the user that initiated the task.

Recurrence

The recurrent time when the job will be restarted.

To view the details of a topology discovery job, select a row and click Show Details. To cancel a scheduled job, select a job that is scheduled for a later time or a job that is in progress and click Cancel.

Setting Up Locations

You can set up locations and assign devices to these locations by setting up the Location View. To set up Location View, see Setting Up the Location View.

Viewing the Alarm Details

You can view the alarm details at site, building, floor, closet, aisle and rack levels. Based on the location node, the alarms are aggregated and displayed. That is, all the alarms for a particular building is aggregated and displayed at the building level. The alarms display as red, orange, yellow, and blue dots indicating critical, major, minor, and info alarms. Network Director updates and displays the alarm status changes in real time in the Topology view. To view the Alarm details for a device, navigate to the device level, select a device, and click one of the following options from Alarm in the Tasks pane:

Discovering the Linux Hosts

Based on the LLDP discovery method, you can discover the hosts for various Linux platforms such as Ubuntu, CentOS, and Red Hat by clicking Refresh Topology. You can also view the additional information in the tool tip that appears when you mouse over a host. These hosts also show icons that identify if a server is based on its respective platform. For example, if a server is a generic Linux server, a Linux icon is shown in the topology.

Note:

You must enable LLDP both on the switch and on the host.

Displaying Device Connectivity

At the device level, you can view the connectivity details of a device and the details of all the devices that are connected to the specified device by using Topology View in Network Director. The Device Connectivity View also displays various details about the selected device and the immediate neighbors. The level of detail that Network Director displays in the Device Connectivity View differs based on the type of device that you select.

To view the connectivity details of a device:

  1. Do one of the following:
    • While in the Logical, Location, Device, or Custom View, select the device for which you want to view connectivity from the View pane and click Connectivity > View Device Connectivity from the Tasks pane.

    • In the Topology View, navigate to a device in a building, floor, outdoor area, closet or rack and select the device for which you want to view the connectivity details and click Connectivity > View Device Connectivity from the Topology Tasks pane.

      Note:

      The Connectivity task container is available only after you select a device.

    The Device Connectivity page opens. You can view the device connectivity details either in graphical view or in grid view. The default view is the graphical view.

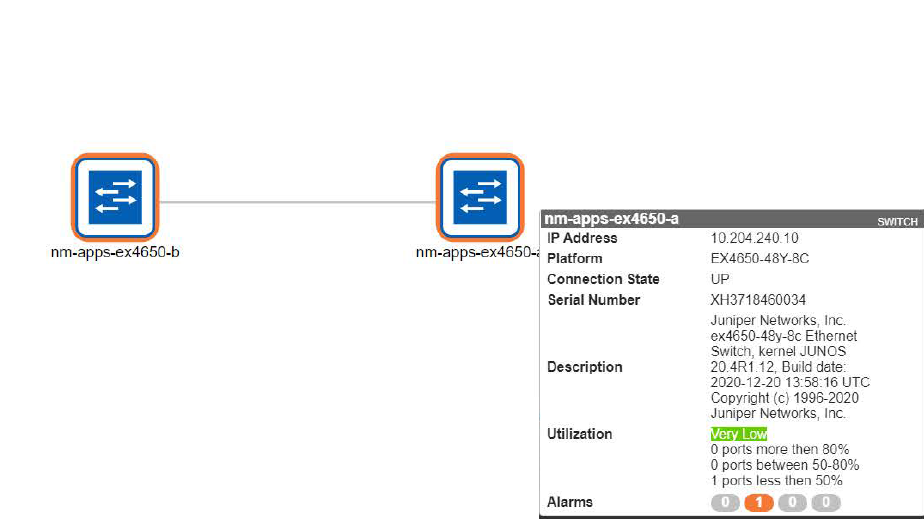
    In the graphical view, the device is displayed in the center and its network connectivity to all the connected devices are displayed as in Figure 2. Mouse over a device to view details of the highlighted device.

    Note:

    If the selected device is connected to a device that is not a Juniper Networks device, the latter appears dimmed in the Device Connectivity page indicating that the device is not managed by Network Director.

    Figure 2: Displaying the Connection Details in Graphical ViewDisplaying the Connection Details in Graphical View

    If the selected device is connected to more than sixty devices, then all the connected devices are highlighted in a circular form or a grid form. If the selected device is connected to less than 60 devices, then the links between the interconnected devices are displayed.

    The device images are displayed along with details such as name, IP address, and alarm state information in colored labels that provide health and reachability information. You can also view the details of the hosts or virtual machines that are connected to the switches.

    You can view the following details in the Device Connectivity - Graphical view:

    • Name—The name of the device provided while configuring the device. The device name is displayed as a label.

    • IP—The IP address of the device.

    • Family—The family or platform to which the device belongs to. Family can be an JUNOS-EX, JUNOS-QFX, JUNOS-QF, and MSSOS.

    • Serial Number—Serial number of the device.

    • Alarms—The alarm details displaying the number of critical, major, minor alarms, or info for the device. Alarms details are color coded to indicate their severity level as shown in Figure 3. Network Director updates and displays the alarm status changes in real time in the Topology view.

      Figure 3: Alarm IndicatorAlarm Indicator
    • Connection State—Connection status of the device. Connection state can be UP, DOWN or N/A. Network Director updates and displays the connection state changes in real time in the Topology view.

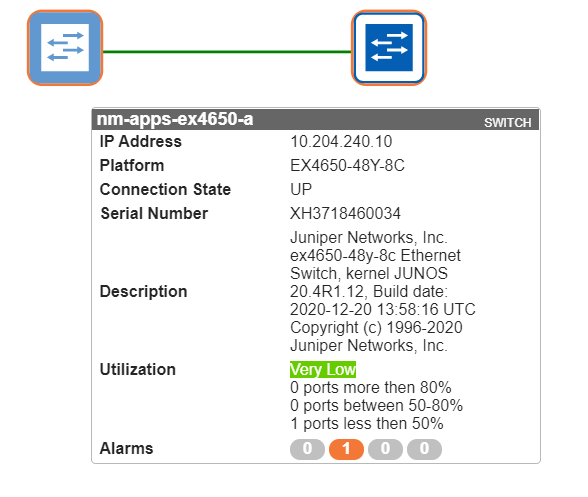
    • Link status—Indicates whether the link between two devices is UP or DOWN as shown in Figure 4. Network Director updates and displays the link status changes in real time in the Topology view.

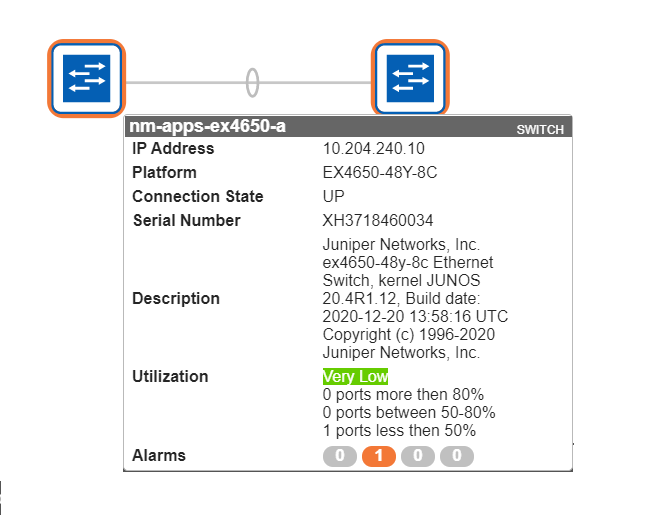
    • LAG—Identifies connections that are configured as LAGs as shown in Figure 5.

      Figure 5: LAGs in the Device Connectivity viewLAGs in the Device Connectivity view

    You can view the following details of the virtual machine that are connected to hosts:

    • Virtual Machine—Name of the virtual machine.

    • Host Name—Name of the host to which the virtual machine is connected to.

    • VNetwork—Name of the virtual network.

    • OS—Name of the operating system on which the virtual machine is running.

    • Connection State—Connection status of the virtual machine. Connection state can be UP, DOWN or N/A.

    • Power State—State of the power supply: Powered On or Powered Off.

  2. Click Show Grid View to view the device connectivity details in a tabular format as displayed in Figure 6.
    Figure 6: Displaying the Connection Details in Grid ViewDisplaying the Connection Details in Grid View

    The following details are displayed in the table:

    • Source Node—Name of the device specified while configuring the device.

    • Source Port—Source port of the device.

    • Source Port Bandwidth %—Realtime percentage of bandwidth utilized at the source port.

    • Destination Node—Name of the device or devices the device is connected to.

    • Destination port—The port number on the destination device to which the source device is connected to.

    • Destination Port Bandwidth %—Realtime percentage of bandwidth utilized at the destination port.

    • Link Status—Indicates if the link to the device is UP or DOWN.

    You can sort the details in the table in the ascending order or descending order for each column. You can also use filters to display only the desired device connectivity details.

Displaying Virtual Chassis Connectivity

You can view the connectivity between the components of Virtual Chassis using the View VC Connectivity task. You can access this tasks from all views except Dashboard View.

To view the connectivity details for a Virtual Chassis:

  1. Do one of the following:
    • While in the Logical, Location, Device, or Custom View, select the device for which you want to view the Virtual Chassis connectivity from the View pane and click Connectivity > View VC Connectivity from the Tasks pane.

    • In the Topology View, navigate to a device in a building, floor, outdoor area, closet or rack and select the device for which you want to view the Virtual Chassis connectivity details and click Connectivity > View VC Connectivity from the Topology Tasks pane.

      Note:

      The Connectivity task container is available only after you select a device.

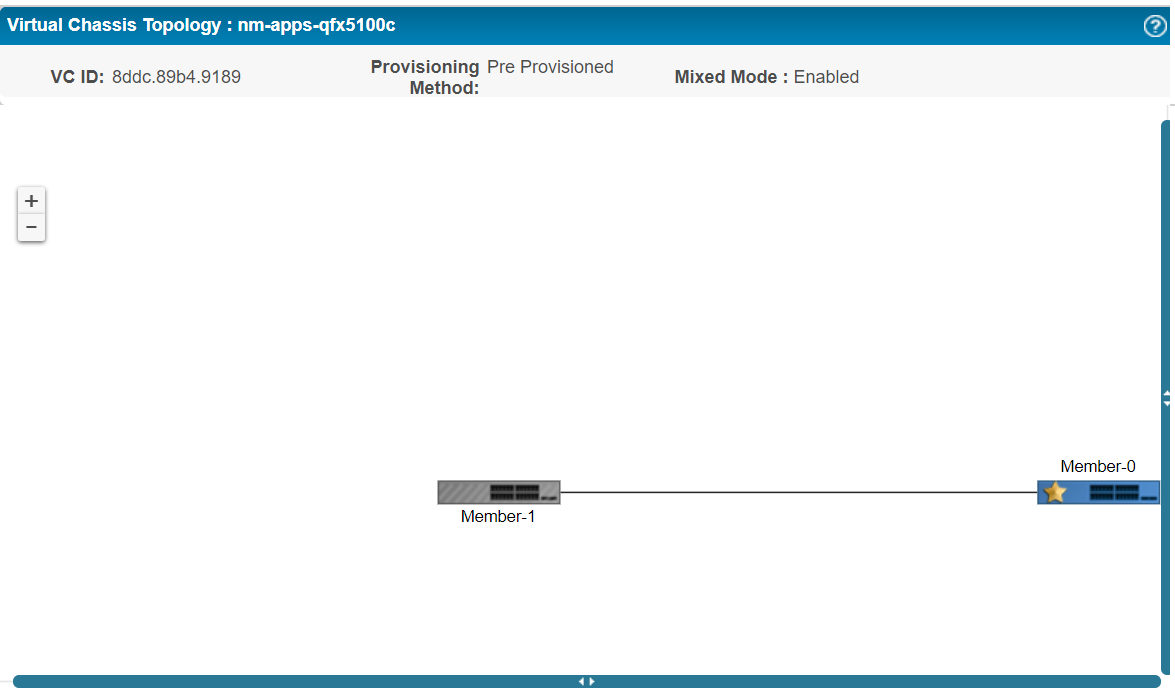
  2. Click Connectivity > View VC Connectivity from the Tasks pane. Network Director displays the connectivity between the members of the selected Virtual Chassis as shown in Figure 7. The inactive members and any members having alarms in down state are shown as grey icons in the topology identifying the state of the member. Mouse over a member to view details of that member.
    Figure 7: Displaying the Connectivity for a Virtual Chassis Displaying the Connectivity for a Virtual Chassis

    In the Figure 7, the connection details are represented by green, yellow, and red lines.

    • The green line indicates that the node is connected to all the Interconnects properly and all functions are normal.

    • The yellow line indicates that the node is only partially connected to the Interconnect. That is, the node may be connected to one Interconnect, but not all the Interconnects.

    • The red line indicates that the node is not connected to any of the interconnects.

    The following details are displayed in the top panel of the Virtual Chassis Topology View as shown in Table 4.

    Table 4: Common Details for the Virtual Chassis

    Details

    Desciption

    VC ID

    All members of a Virtual Chassis configuration share one Virtual Chassis identifier (VCID). This identifier is derived from internal parameters.

    Provisioning Method

    The provisioning mode of the member. Provision mode can be autoprovisioned, preprovisioned or not preprovisioned.

    In a configuration that is not preprovisioned, the selection of the primary and backup is determined by the primary-role priority value and secondary factors in the primary-role election algorithm.

    VC Mode

    Indicates whether the Virtual Chassis is mixed or not.

    The following details are displayed in the Virtual Chassis Topology view for each member depending on the role of the member as shown in Table 5.

    Table 5: Details of VC Members

    Details

    Description

    Role

    Name

    Name of the member switch provided while configuring the device. The device name is displayed as a label.

    PrimaryBackupLine Card

    Serial Number

    Serial number of the member switch.

    Primary Backup Line Card

    Platform

    Platform of the device. Platform can be QFX5100, QFX5110, or QFX10002.

    Primary Backup Line Card

    Priority

    The primary-role priority value. This is the most important factor in determining the role of the member switch within the Virtual Chassis configuration.

    Primary Backup Line Card

    Operational Role

    Operational role of the device. A device might be configured for a particular role, but can operate in the same or a different role. For example, a spine device configured with a Routing Engine role might operate as a line card. Therefore, the operational role of this device is Line Card.

    Operational role can be Routing Engine or Line Card.

    Primary Backup Line Card

    Config Role

    The configured role of the device. This can be Routing Engine or Line card.

    Primary Backup Line Card

    Member Status

    Displays the status of each member device:

    • Present—The device is connected and working fine.

    • Not Present—The device is not connected to the VC.

    • Inactive—The device is connected, but not running.

    • Non Provisioned—A configuration in which the roles of the members are assigned automatically; not configured statically (preprovisioned).

    • Pre Provisioned—A configuration that allows you to deterministically control the member ID and role assigned to a member by associating the member with its serial number.

    Primary Backup Line Card

    In addition to the above details, when you expand the host details, you can also view the details of the member and the link connected to the virtual machine.

Uploading Floor Plans

You can upload the floor plan from the Topology View if you already have a floor plan for a specified building in a site.

To upload the floor plan:

  1. Select a Site > Building > Floor. Alternatively, create a site, building, and floor. Click the Upload Floor Plan task from the Location task in the Tasks pane.

    The Upload Floor Plan dialog box is displayed.

  2. Click Browse next to Image File to choose a floor plan file.
  3. Navigate to the folder where you have saved the floor plan on your system and click Open.
  4. Click Upload to upload the floor plan image.
  5. Click Cancel if you do not want to upload the floor plan and quit the Upload Floor Plan dialog box.

Uploading Topology Map

You can upload a topology map for an outdoor area from the Topology View.

To upload the map:

  1. Select a Site > Outdoor area. Alternatively, create an outdoor area within a site. Click the Upload map task from the Location task in the Tasks pane.

    The Upload Map dialog box is displayed.

  2. Click Browse next to Image File to choose a map file.
  3. Navigate to the folder where you have saved the topology map for an outdoor area on your system and click Open.
  4. Click Upload to upload the topology map image.
  5. Click Cancel if you do not want to upload the map and quit the Upload Map dialog box.