Monitoring Nodes in the Fabric
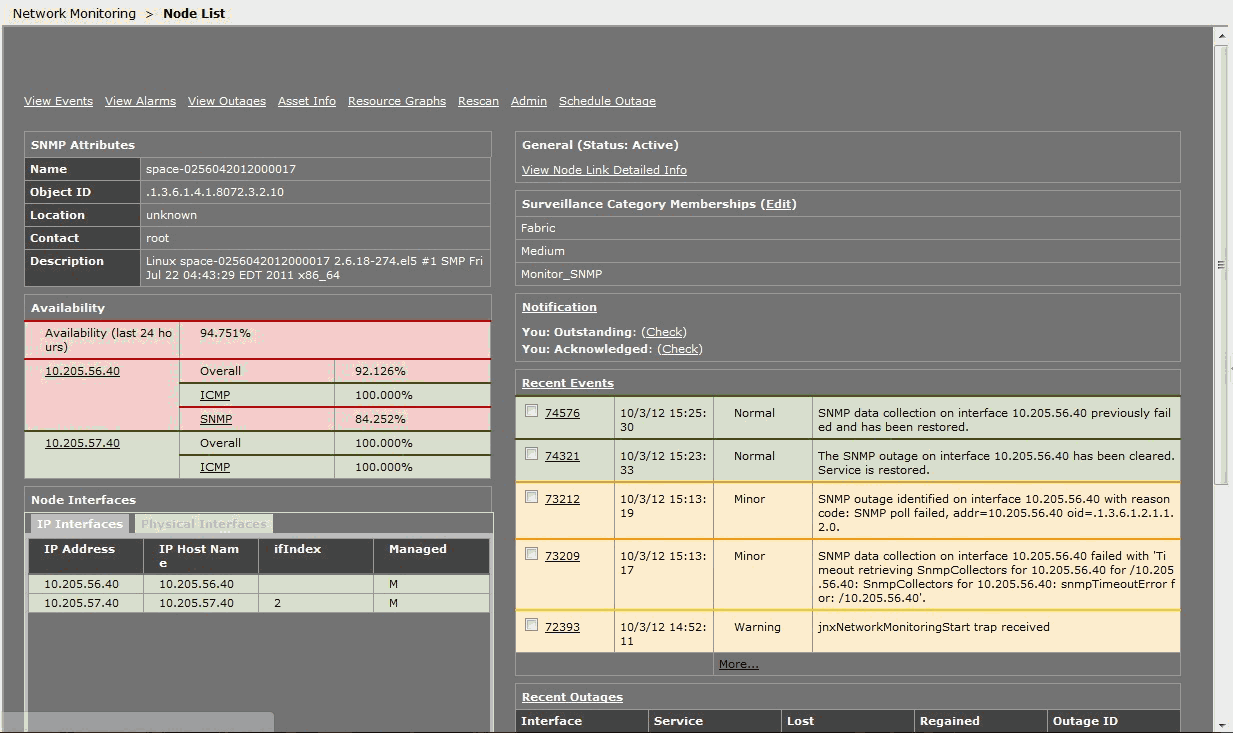
As an administrator or operator, you can use Junos Space to track the status of physical and logical components of deployed nodes in a fabric.
Junos Space Network Management Platform supports SNMP Monitoring by an SNMP Manager for SNMP v1, v2c, and v3.
The SNMP manager polls Junos Space to obtain information about the logical components of the nodes using an object identifier (OID) in SNMP v1 and v2, or v3 as a user. The response is provided by the Junos Space SNMP agent and the polled data is displayed in the Network Monitoring workspace.
This topic contains the following sections:
Viewing and Modifying the SNMP Configuration for a Fabric Node
To view and edit the Junos Space SNMP configuration for self-monitoring:
Table 2 shows the configuration parameters for monitoring disk usage.
|
Monitoring Disk Usage |
|---|
|
Parameter: Disk Usage (%) Default: 5% When the free disk space is greater than the configured threshold, the trap shown in Figure 1 is generated. Figure 1: Disk Usage Threshold Is Normal

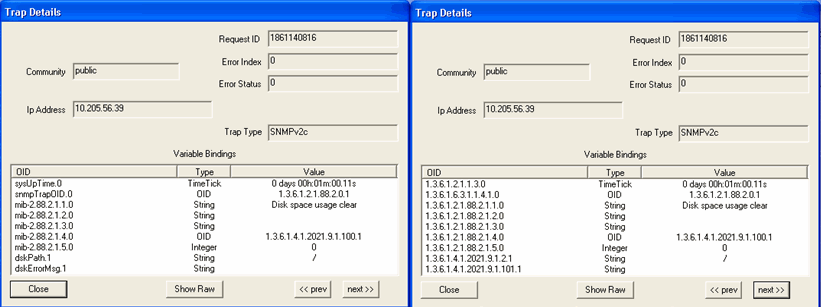
Figure 2 shows the OID details for the trap generated when disk usage is normal. Figure 2: Trap Details When Disk Usage
Normal
When the free disk space is less than the configured threshold, the trap shown in Figure 3 is generated. Figure 3: Disk Usage Threshold Exceeds
Configured Threshold

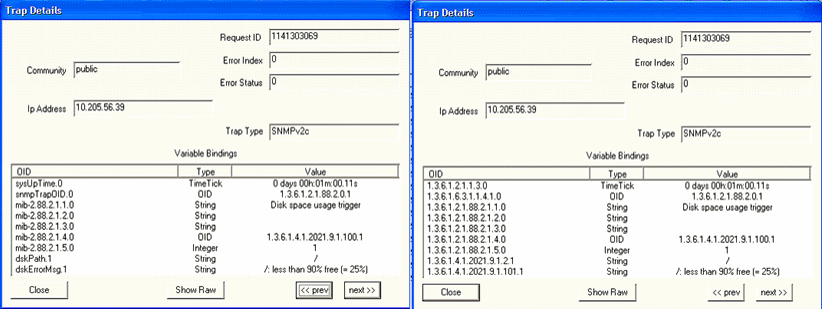
Figure 4 shows the OID details for the trap generated when disk usage exceeds the configured threshold. Figure 4: Trap Details When DIsk Usage
Exceeds Configured Threshold
|
Table 3 shows the configuration parameters for monitoring the CPU load average.
|
Monitoring the CPU Load Average (System Load) |
|---|
|
Parameter: CPU Load (1 min, 5 min, 15 min) Default Threshold Value: 4 When the CPU Load Average threshold is less than or equal to the configured threshold limit, the trap shown in Figure 5 is generated: Figure 5: CPU Load Average Threshold Is
Normal

Figure 6 shows the OID details for the trap generated when the CPU load is normal. Figure 6: Trap Details When CPU Load
Average Threshold Is Normal
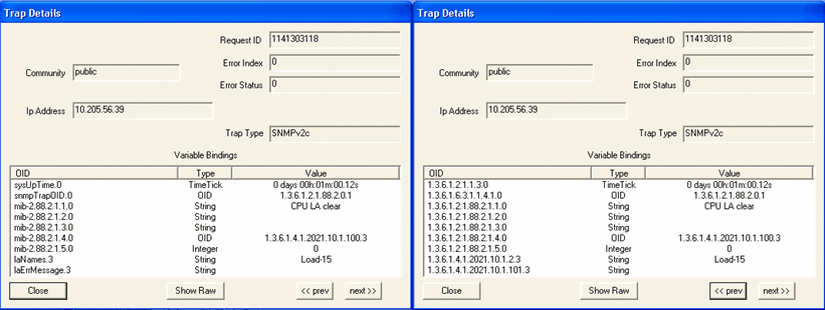
Figure 7 shows the traps generated when the 15 minute, 5 minute, or 1 minute CPU Load Average threshold is exceeded. Figure 7: CPU Load Average Threshold –
Upper Limit Exceeded

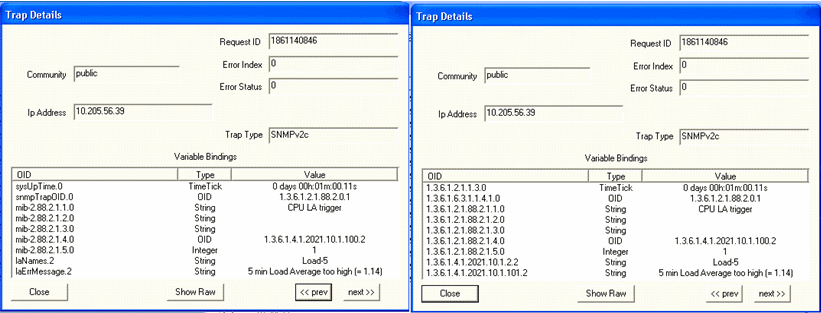
Figure 8 shows the OID details for the trap generated when the CPU load 5 minute average exceeds the threshold. Figure 8: Trap Details When CPU Load 5
Minute Average Exceeds Threshold
|
Table 4 shows monitoring processes for the Junos Space Network Management Platform.
|
Monitoring Processes |
|---|
|
Parameter: Node Management Agent (NMA) When the NMA process is up, the trap shown in Figure 9 is generated: Figure 9: NMA Is Up

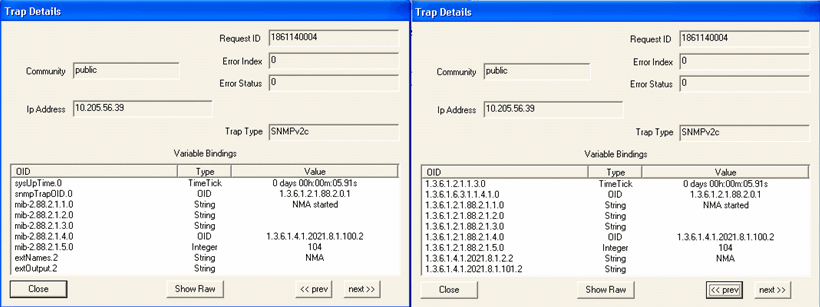
Figure 10 shows the OID details for the trap generated when the NMA process is up. Figure 10: Trap Details When NMA Is Up
When the NMA process is down, the trap shown in Figure 11 is generated: Figure 11: NMA is Down

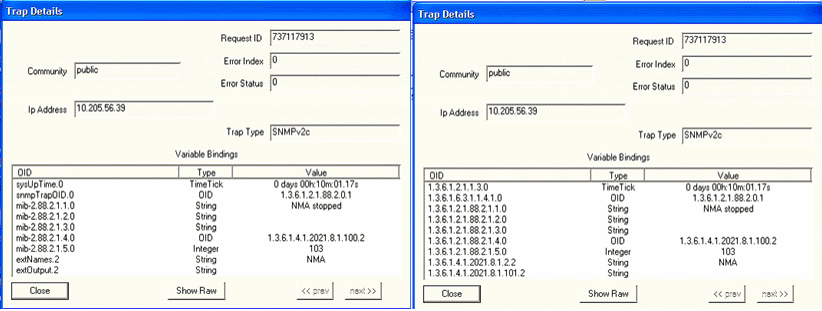
Figure 12 shows the OID details for the trap generated when the NMA process is down. Figure 12: Trap Details When NMA is Down
|
|
Parameter: Webproxy When the WebProxy process is up, the trap shown in Figure 13 is generated: Figure 13: WebProxy Is Up

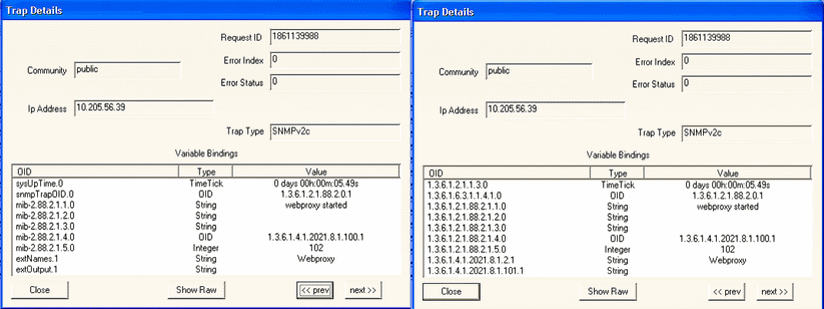
Figure 14 shows the OID details for the trap generated when the WebProxy process is up. Figure 14: Trap Details When WebProxy Is
Up
When the WebProxy process is down, the trap shown in Figure 15 is generated: Figure 15: WebProxy Is Down

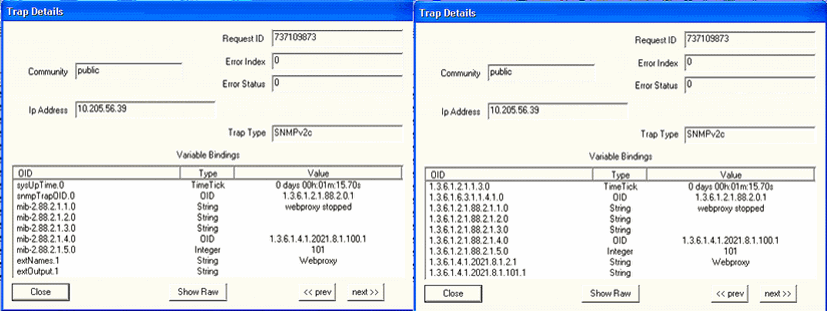
Figure 16 shows the OID details for the trap generated when the WebProxy is down. Figure 16: Trap Details When WebProxy
Is Down
|
|
Parameter: JBoss When the JBoss process is up, the trap shown in Figure 17 is generated: Figure 17: JBoss Is Up

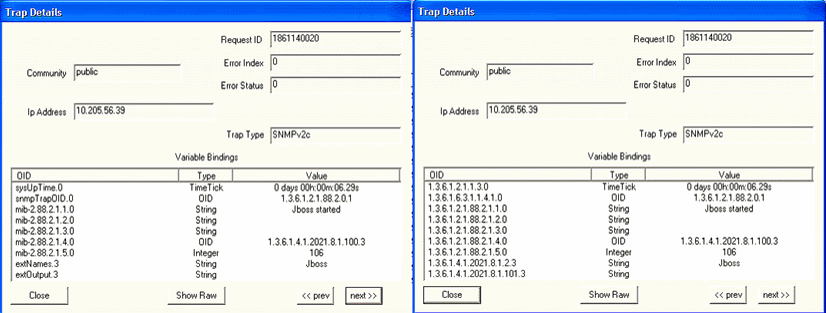
Figure 18 shows the OID details for the trap generated when the JBoss process is up. Figure 18: Trap Details When JBoss Is Up
When the JBoss process is down, the trap shown in Figure 19 is generated: Figure 19: JBoss Is Down

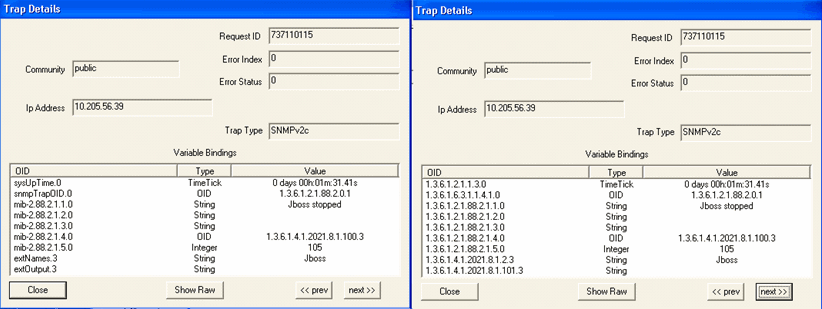
Figure 20 shows the OID details for the trap generated when JBoss is down. Figure 20: Trap Details When JBoss Is Down
|
|
Parameter: Mysql When the Mysql process is up, the trap shown in Figure 21 is generated: Figure 21: Mysql Is Up

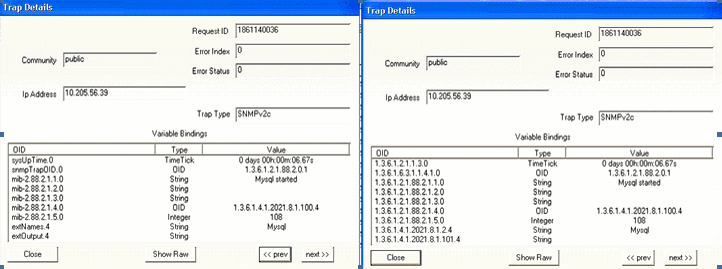
Figure 22 shows the OID details for the trap generated when the Mysql process is up. Figure 22: Trap Details When Mysql Is Up
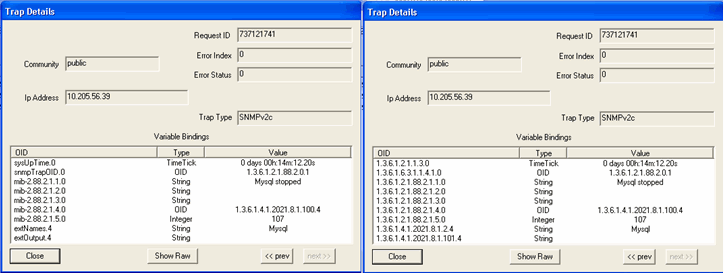
When the Mysql process is down, the trap shown in Figure 23 is generated: Figure 23: Mysql Is Down

Figure 24 shows the OID details for the trap generated when the Mysql process is down. Figure 24: Trap Details When Mysql Is Down
|
|
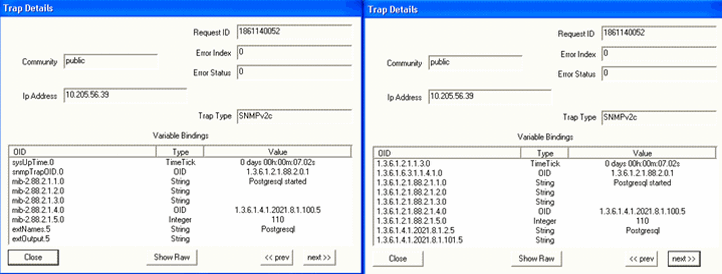
Parameter: Postgresql When the Postgresql process is up, the trap shown in Figure 25 is generated: Figure 25: Postgresql Is Up

Figure 26 shows the OID details for the trap generated when the Postgresql process is up. Figure 26: Trap Details When Postgresql
Is Up
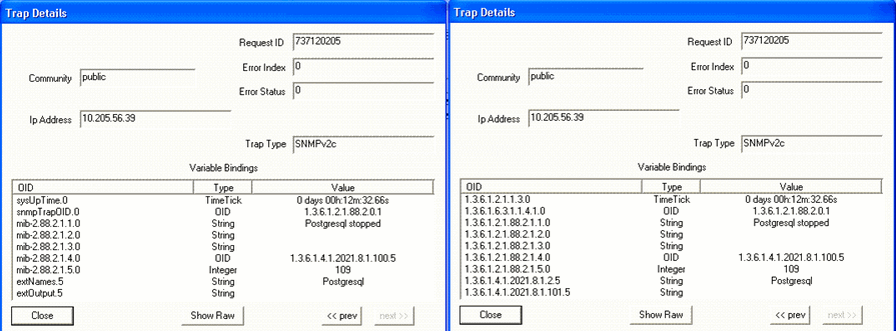
When the Postgresql process is down, the trap shown in Figure 27 is generated: Figure 27: Postgresql Is Down

Figure 28 shows the OID details for the trap generated when the Postgresql process is up. Figure 28: Trap Details When Postgresql
Is Down
|
|
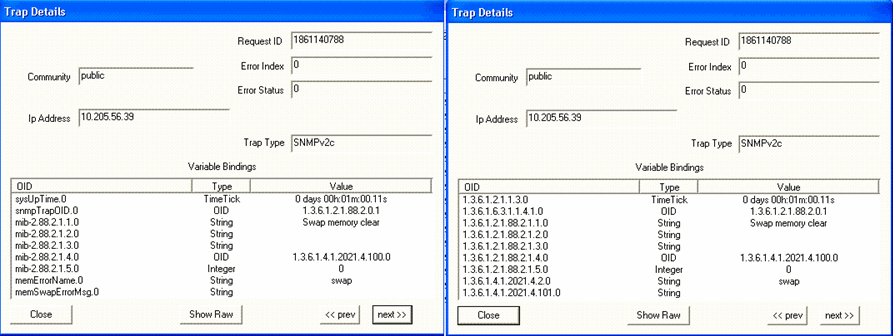
Parameter: Free swap memory When the free swap memory is greater than the upper threshold limit, the trap shown in Figure 29 is generated: Figure 29: Swap Memory Usage Is Normal

Figure 30 shows the OID details for the trap generated when swap memory usage is normal. Figure 30: Trap Details When Swap
Memory Is Normal
When the free swap memory is less than the upper threshold limit, the trap shown in Figure 31 is generated: Figure 31: Swap Memory Usage Threshold Exceeds
Upper Limit

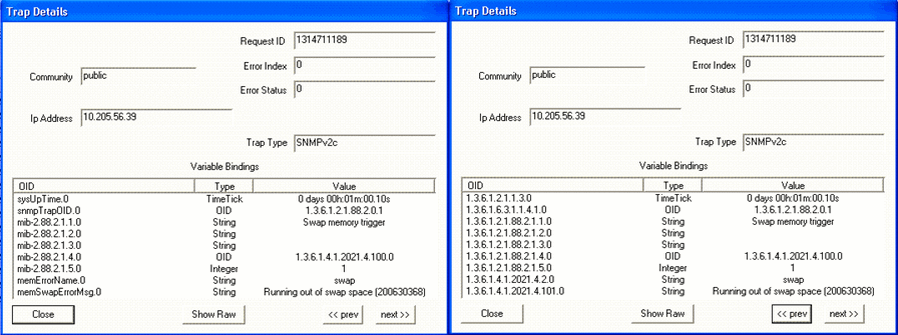
Figure 32 shows the OID details for the trap generated when swap memory usage is exceeds upper limit. Figure 32: Trap Details When Swap
Memory Usage Exceeds Upper Limit
|
Table 5 shows the configuration parameters for monitoring Junos Space Network Management Platform hardware.
|
Monitoring Linux Hardware |
|---|
|
Note:
LM-SENSORS-MIB is not supported by the Junos Space Virtual Appliance, but only by the Junos Space Appliance. Therefore the threshold settings of CPU Max Temp (mC), CPU Min Fan (RPM) and CPU Min Voltage (mV) will not trigger any traps in the virtual appliance. |
|
Parameter: CPU min FAN (rpm) Default Threshold Value: 1500 When the CPU fan speed is greater than the configured threshold (minimum fan speed), the trap shown in Figure 33 is generated: Figure 33: CPU Fan Speed Normal

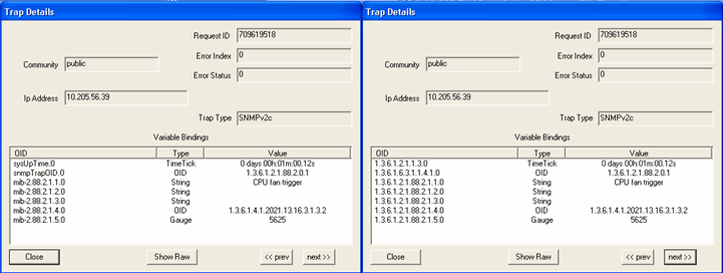
Figure 34 shows the OID details for the trap generated when CPU fan speed is normal. Figure 34: Trap Details When CPU Fan Speed
Is Normal
When the CPU fan speed is less than the configured threshold (minimum fan speed), the trap shown in Figure 35 is generated: Figure 35: CPU Fan Speed Is Below the Configured
Threshold

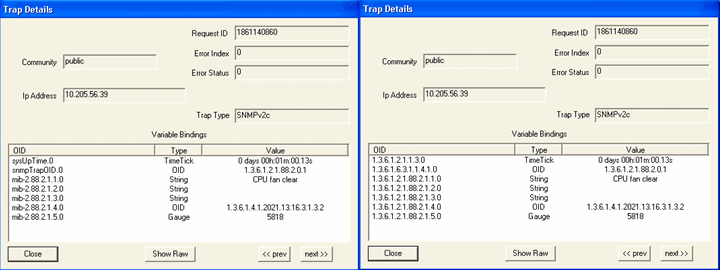
Figure 36 shows the OID details for the trap generated when CPU fan speed lower than the configured threshold. Figure 36: Trap Details When CPU Fan Speed
Is Below the Configured Threshold
|
|
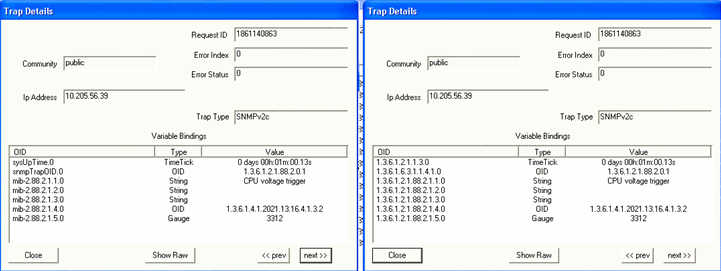
Parameter: CPU min Voltage (mV) When the CPU voltage is greater than the configured value, the trap shown in Figure 37 is generated: Figure 37: CPU Voltage Normal

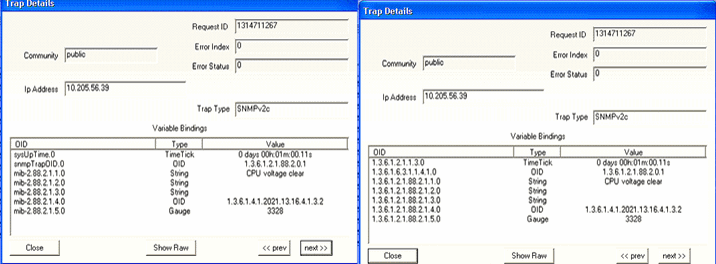
Figure 38 shows the OID details for the trap generated when CPU voltage is normal. Figure 38: Trap Details When CPU Voltage
Is Normal
Default Threshold Value: 1000 When the CPU voltage is lower than the configured value, the trap shown in Figure 39 is generated: Figure 39: CPU Voltage Is Lower Than Configured
Threshold

Figure 40 shows the OID details for the trap generated when CPU voltage is lower than the configured threshold. Figure 40: Trap Details When CPU Voltage
Is Lower Than Configured Threshold
|
|
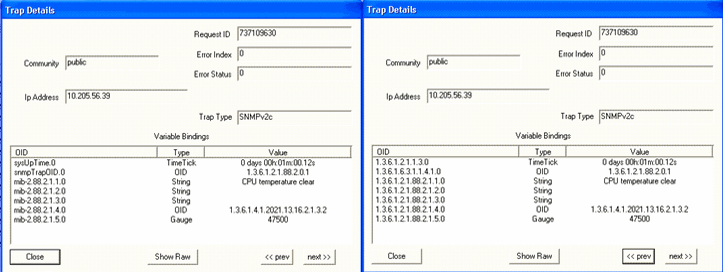
Parameter: CPU Temperature When the CPU temperature is lower than the configured threshold, the trap shown in Figure 41 is generated: Figure 41: CPU Temperature Normal

Figure 42 shows the OID details for the trap generated when CPU temperature is normal. Figure 42: Trap Details When CPU Temperature
Is Normal
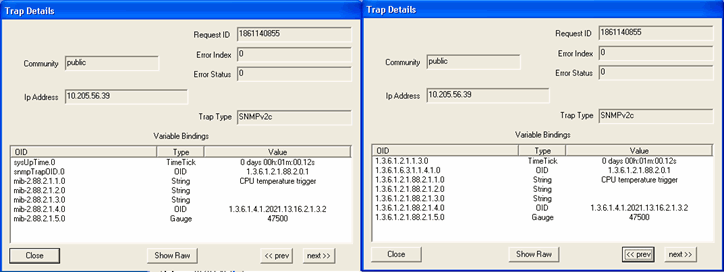
When the CPU temperature exceeds the configured threshold, the trap shown in Figure 43 is generated: Figure 43: CPU Temperature Exceeds The Configured
Threshold

Figure 44 shows the OID details for the trap generated when CPU temperature is higher than the configured threshold. Figure 44: Trap Details When CPU Temperature
Exceeds The Configured Threshold
|
Table 6 shows the configuration parameters for monitoring fabric health.
| Monitoring Fabric Health |
|
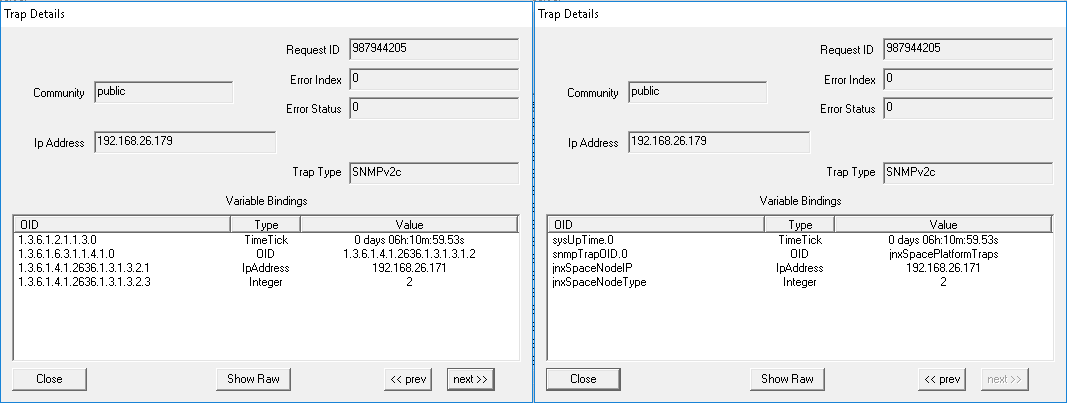
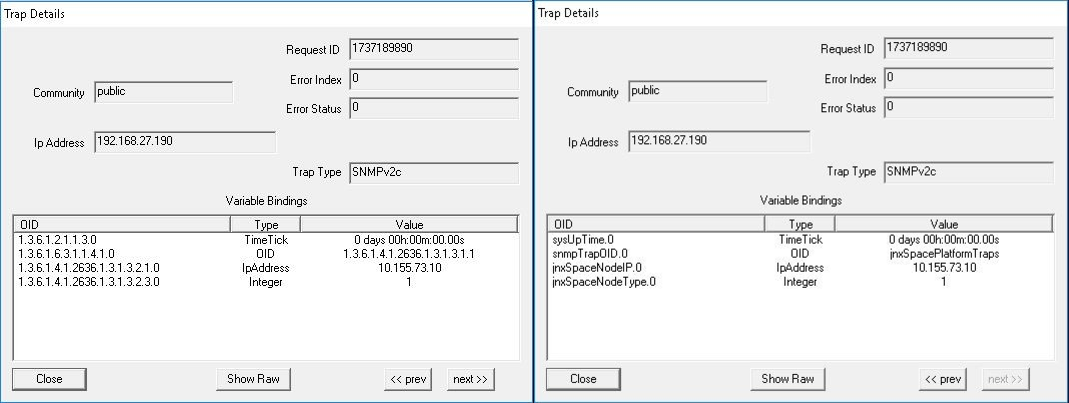
Parameter: Junos Space Node When a Junos Space node is up, the trap shown in Figure 45 is generated: Figure 45: Junos Space Node is Up

Figure 46 shows the OID details for the trap generated when a Junos Space node is up. Figure 46: Trap Details When Junos Space
Node Is Up
When a Junos Space node is down, the trap shown in Figure 47 is generated: Figure 47: Junos Space Node is Down

Figure 48 shows the OID details for the trap generated when a Junos Space node is down. Figure 48: Trap Details When Junos
Space Node is Down
|
|
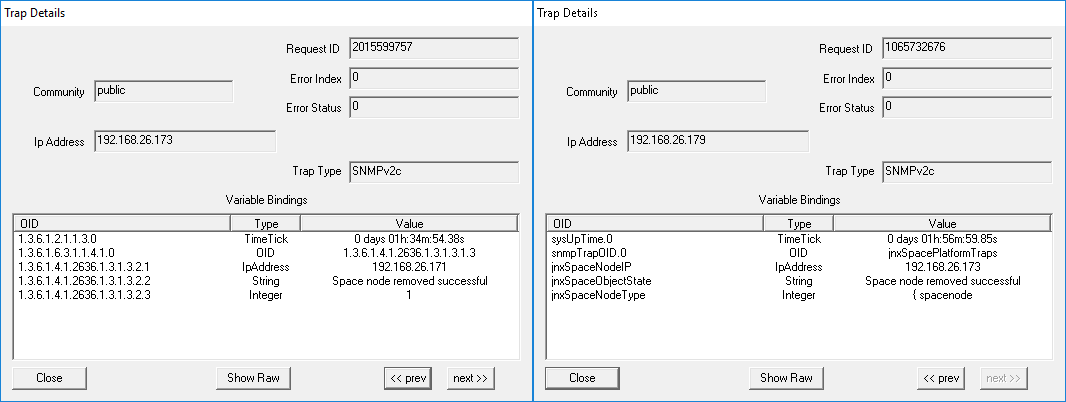
Parameter: Junos Space Node Removal When a Junos Space node is removed from the fabric, the trap shown in Figure 49 is generated: Figure 49: Junos Space Node Is Removed

Figure 50 shows the OID details for the trap generated when a Junos Space node is removed.. Figure 50: Trap Details When Junos
Space Node Is Removed
|
|
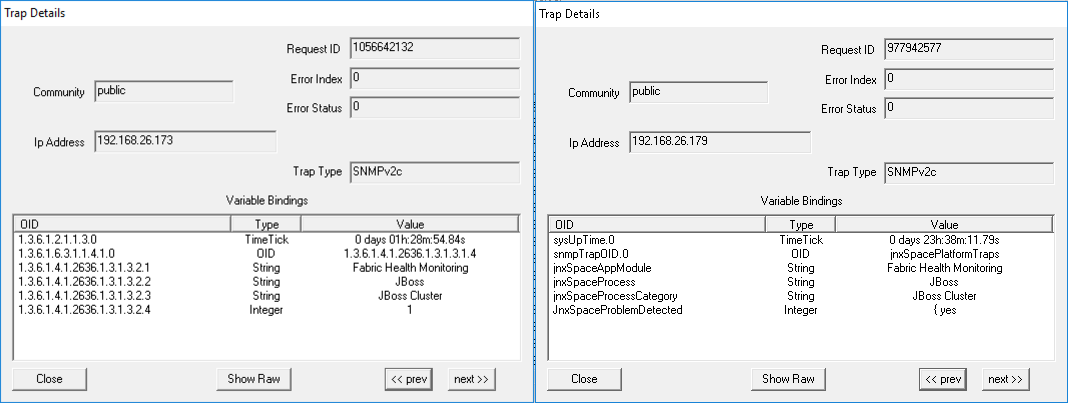
Parameter: JBoss Multi-Primary Detected When there is more than one JBoss AppLogic primary node detected in the cluster, the trap shown in Figure 51 is generated: Figure 51: JBoss Multi-Primary Detected

Figure 52 shows the OID details for the trap generated when there is more than one JBoss AppLogic primary node detected in the cluster. Figure 52: Trap
Details When JBoss Multi-Primary Is Detected
|
|
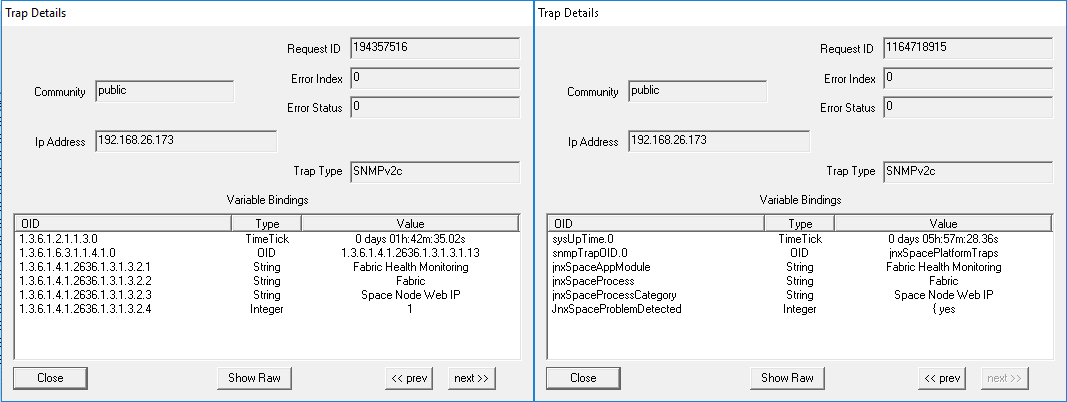
Parameter: VIP Bind Issue Detected in JBoss Node(s) When VIP Bind issue is detected in JBoss node(s), the trap shown in Figure 53 is generated: Figure 53: VIP Bind Issue Detected In
JBoss Node(s)

Figure 54 shows the OID details for the trap generated when VIP Bind issue is detected in JBoss node(s). Figure 54: Trap Details When VIP Bind Issue
Is Detected In JBoss Node(s)
|
|
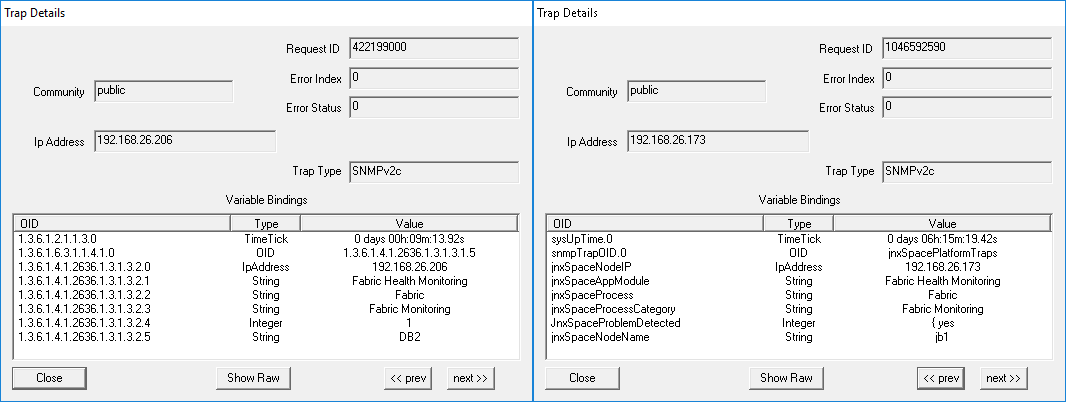
Parameter: Fabric Monitoring Process Inactive When fabric monitoring process is inactive, the trap shown in Figure 55 is generated: Figure 55: Fabric Monitoring Process Inactive

Figure 56 shows the OID details for the trap generated when fabric monitoring process is inactive. Figure 56: Trap Details When Fabric
Monitoring Process Is Inactive
|
|
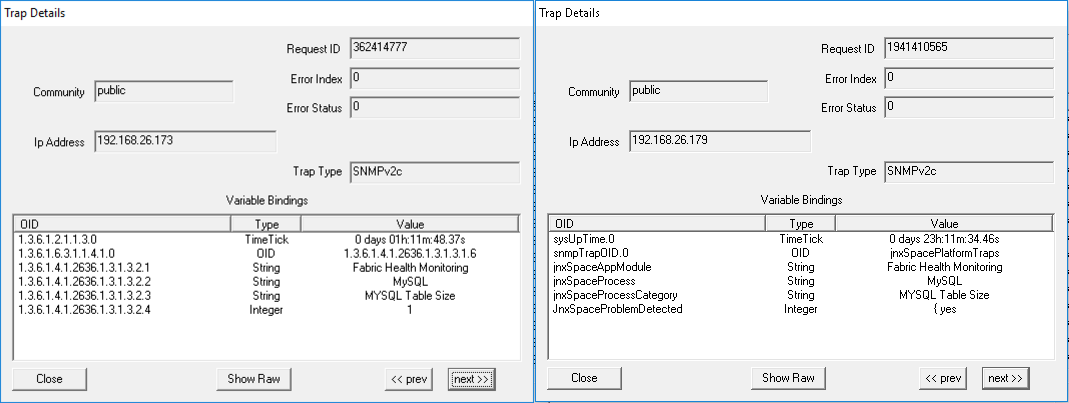
Parameter: Tables Exceed Size Limit When one or more tables in the MySQL database exceed the size limit of 10 GB, the trap shown in Figure 57 is generated: Figure 57: Tables Exceed Size Limit

Figure 58 shows the OID details for the trap generated when one or more tables in the MySQL database exceed the size limit of 10 GB. Figure 58: Trap Details When Tables Exceed
Size Limit
|
|
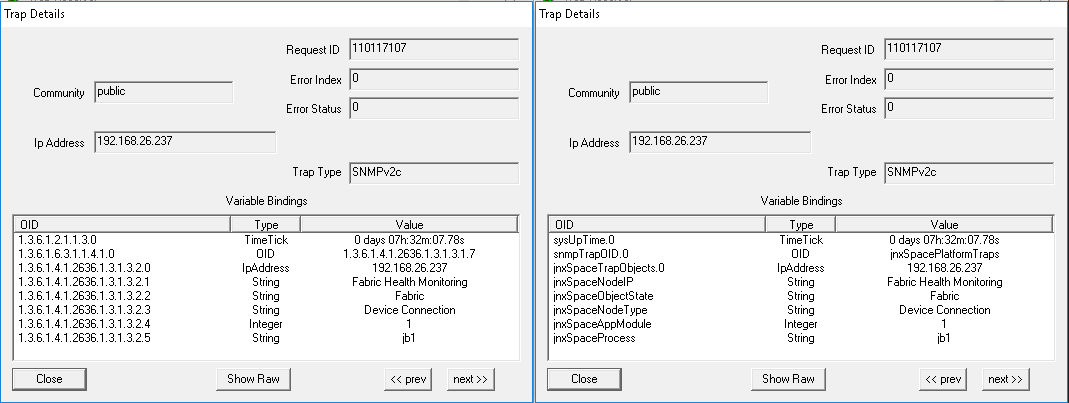
Parameter: Device Session Count Exceeds Threshold Limit When the device session count exceeds the threshold limit, the trap shown in Figure 59 is generated: Figure 59: Device Session Count Exceeds Threshold
Limit

Figure 60 shows the OID details for the trap generated when the device session count exceeds the threshold limit. Figure 60: Trap Details When Device Session
Count Exceeds Threshold Limit
|
|
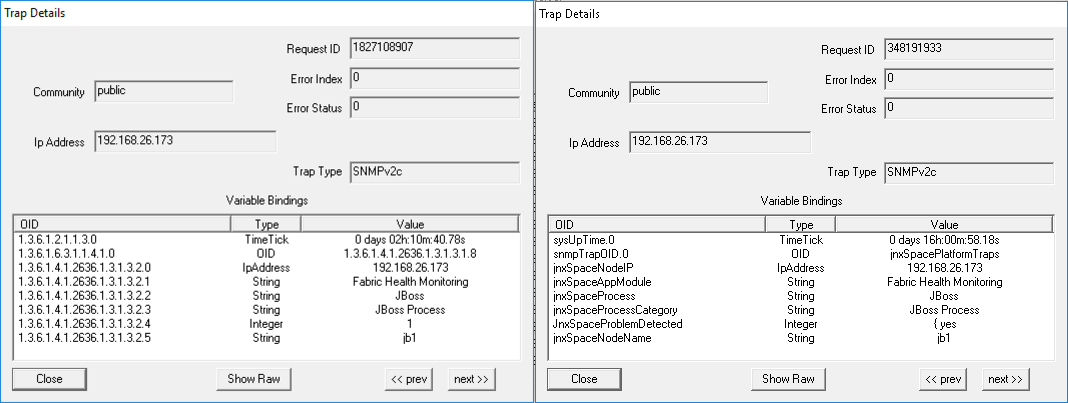
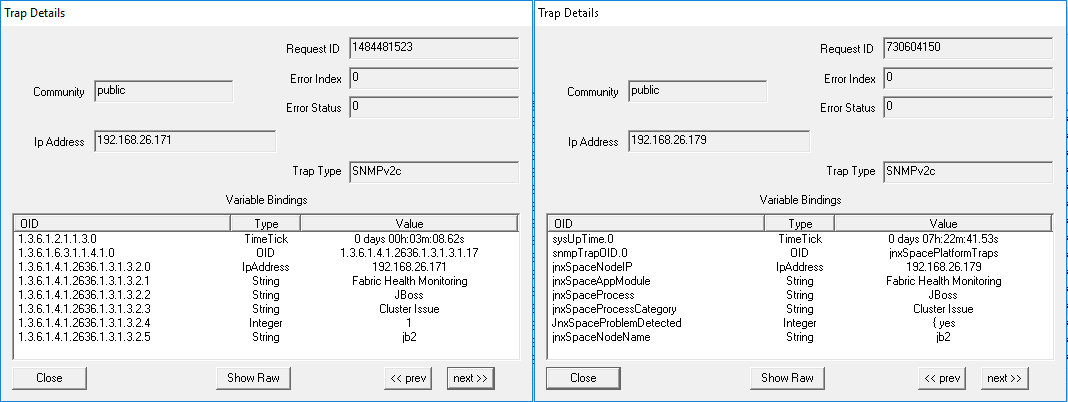
Parameter: HPROF Availability When Heap and CPU Profiling Agent (HPROF) files are detected on a Junos Space node, the trap shown in Figure 61 is generated: Figure 61: HPROF Availability

Figure 62 shows the OID details for the trap generated when HPROF files are detected on a Junos Space node. Figure 62: Trap Details When HPROF Files Are Available
|
|
Parameter: JGroup Membership Issue Detected When the removal of a JBoss node from JGroup is detected in the cluster, the trap shown in Figure 63 is generated: Figure 63: JGroup Membership Issue Detected

Figure 64 shows the OID details for the trap generated when the removal of a JBoss node from JGroup is detected in the cluster. Figure 64: Trap Details When JGroup Membership
Issue Detected
|
|
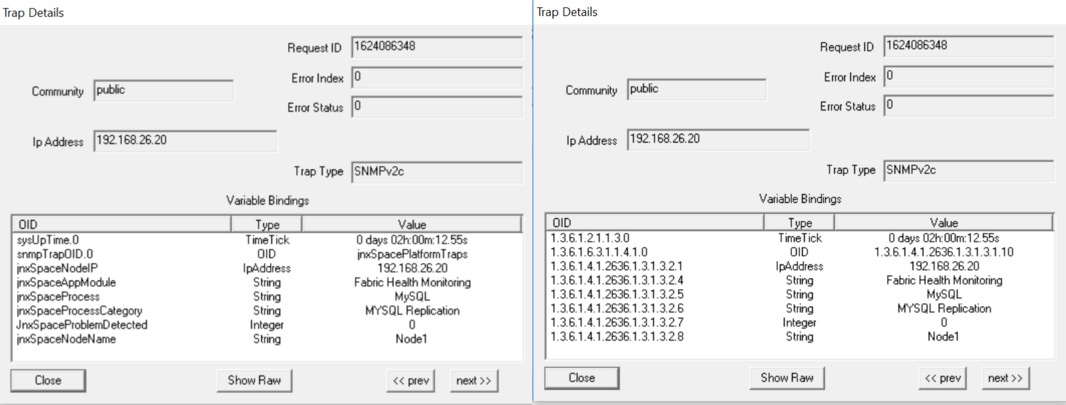
Parameter: MySQL In Out Of Sync State When a MySQL database synchronization issue is detected between nodes running the MySQL database, the trap shown in Figure 65 is generated: Figure 65: MySQL In Out Of Sync State

Figure 66 shows the OID details for the trap generated when a MySQL database synchronization issue is detected between nodes running the MySQL database. Figure 66: Trap Details When MySQL Is In
Out Of Sync State
|
|
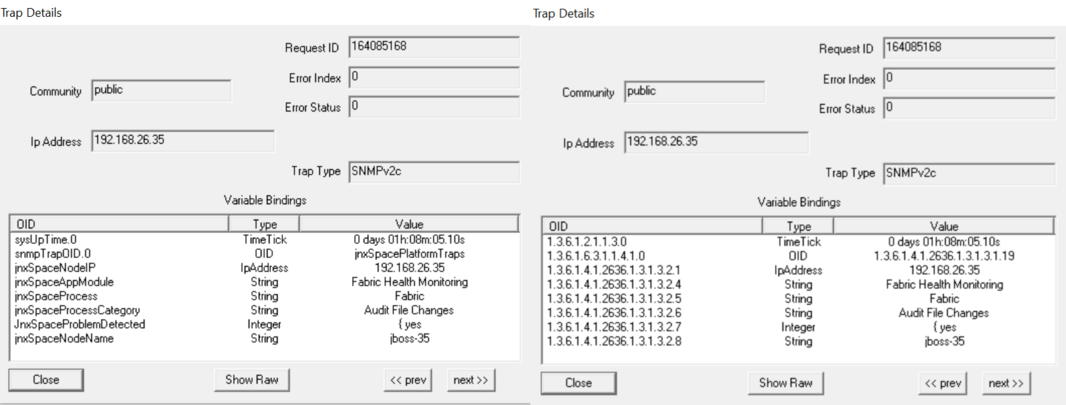
Parameter: File Intrusion Detection Monitoring When changes in files or file permissions are detected, the trap shown in Figure 67 is generated. Figure 67: File Intrusion Detection Monitoring

Figure 68 shows the OID details for the trap generated when file or file permission changes are detected in the system. Figure 68: Trap Details for File Intrusion
Detection Monitoring
|
|
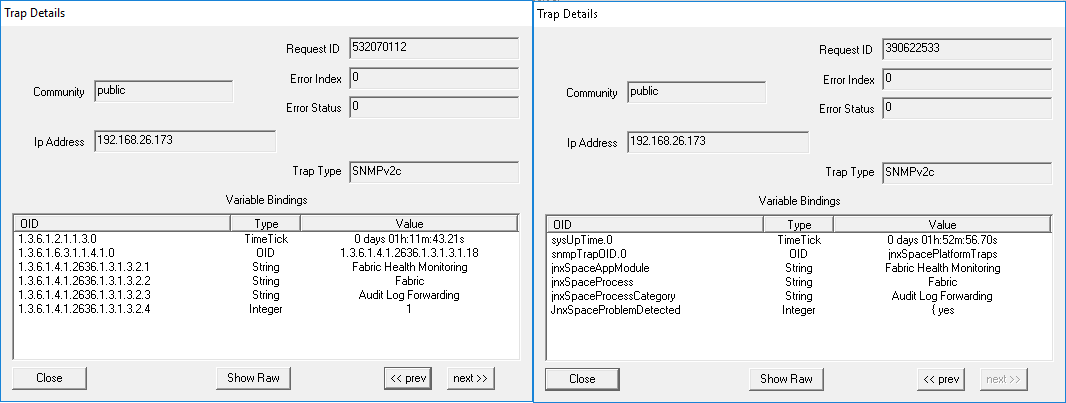
Parameter: Audit Logs Forwarding Failed When the system fails to forward audit logs to the configured system log server, the trap shown in Figure 69 is generated: Figure 69: Audit Logs Forwarding Failed

Figure 70 shows the OID details for the trap generated when the system fails to forward audit logs to the configured system log server. Figure 70: Trap Details When Audit Logs
Forwarding Fails
|
|
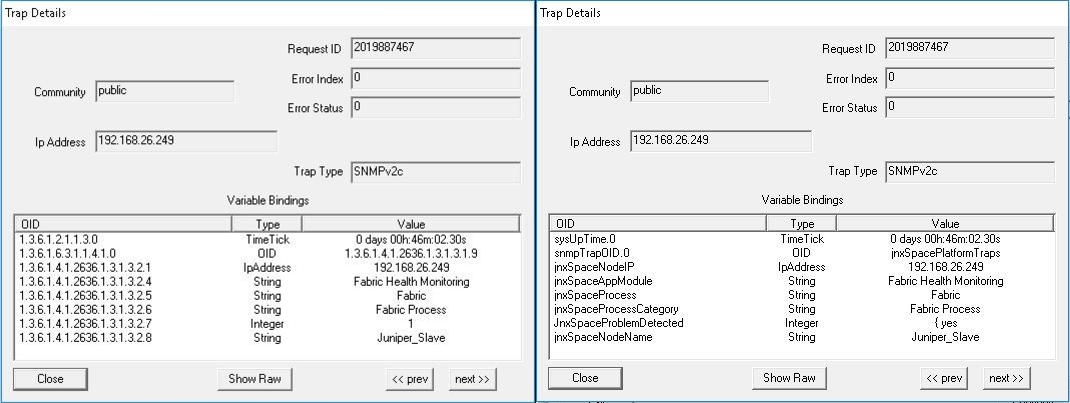
Parameter: One Or More Expected Process Are Inactive Junos Space monitors critical process like JBoss. If any of these expected processes are inactive, the trap shown in Figure 71 is generated: Figure 71: One or More Expected Processes Are Inactive

Figure 72 shows the OID details for the trap generated when one or more expected processes are inactive. Figure 72: Trap Details When One or More Expected
Processes Are Inactive
|
LM-SENSORS-MIB is not supported by the Junos Space virtual appliance, but only by the Junos Space Appliance. Therefore the threshold settings of CPU Max Temp (mC), CPU Min Fan (RPM) and CPU Min Voltage (mV) will not trigger any traps in the virtual appliance.
Junos Space supports RAID-related traps on a Junos Space appliance. The following is a sample trap:
40948 	Normal [+] [-] 	2/4/13 09:54:14 [<] [>] 	space-node 	10.205.56.38 [+] [-]
uei.opennms.org/generic/traps/EnterpriseDefault [+] [-] Edit notifications for event
Received unformatted enterprise event (enterprise:.1.3.6.1.4.1.8072.4 generic:6 specific:1001). 1 args: .1.3.6.1.4.1.795.14.1.9000.1="One or more logical devices contain a bad stripe: controller 1."
Starting SNMP Monitoring on Fabric Nodes
To start SNMP monitoring on one or more fabric nodes:
Stopping SNMP Monitoring on Fabric Nodes
To stop SNMP monitoring on one or more fabric nodes:
Restarting SNMP Monitoring on Fabric Nodes
To restart SNMP monitoring on one or more fabric nodes:
Adding a Third-Party SNMP V1 or V2c Manager on a Fabric Node
To add a third-party SNMP V1 or V2c manager on a fabric node:
Adding a Third-Party SNMP V3 Manager on a Fabric Node
To add a third-party SNMP V3 manager on a fabric node:
The trap settings for the SNMPv3 manager are not automatically updated in Network Monitoring. Therefore, to ensure that the Network Monitoring receives the traps from Junos Space, you must add the same settings manually in the /opt/opennms/etc/trapd-configuration.xml file. Table 7 displays the mapping between the parameters in the /opt/opennms/etc/trapd-configuration.xml file and the fields in the Add 3rd Party SNMP Manager page.
The following is a sample configuration in the /opt/opennms/etc/trapd-configuration.xml file.
<?xml version="1.0"?>
<trapd-configuration snmp-trap-port="162" new-suspect-on-trap="false">
 <snmpv3-user security-name="JunosSpace" auth-passphrase="auth-password" auth-protocol="MD5"/>
  <snmpv3-user security-name="JunosSpace" auth-passphrase="auth-password" auth-protocol="MD5"
      privacy-passphrase="privacy-password" privacy-protocol="DES"/>
</trapd-configuration>|
Parameter in trapd-configuration.xml File |
Field in Add 3rd Party SNMP Manager Page |
|---|---|
|
|
User Name |
|
|
Authentication Password |
|
|
Privacy Password |
|
|
Privacy Type |
Deleting a Third-Party SNMP Manager from a Fabric Node
To delete a third-party SNMP manager configuration from a fabric node:
Installing StorMan RPM for Monitor RAID Functionality
To install StorMan RPM:
# rpm –ivh StorMan-7.31-18856.x86_64.rpm

