Help us improve your experience.
Let us know what you think.
Do you have time for a two-minute survey?
Help us improve your experience.
Let us know what you think.
Do you have time for a two-minute survey?
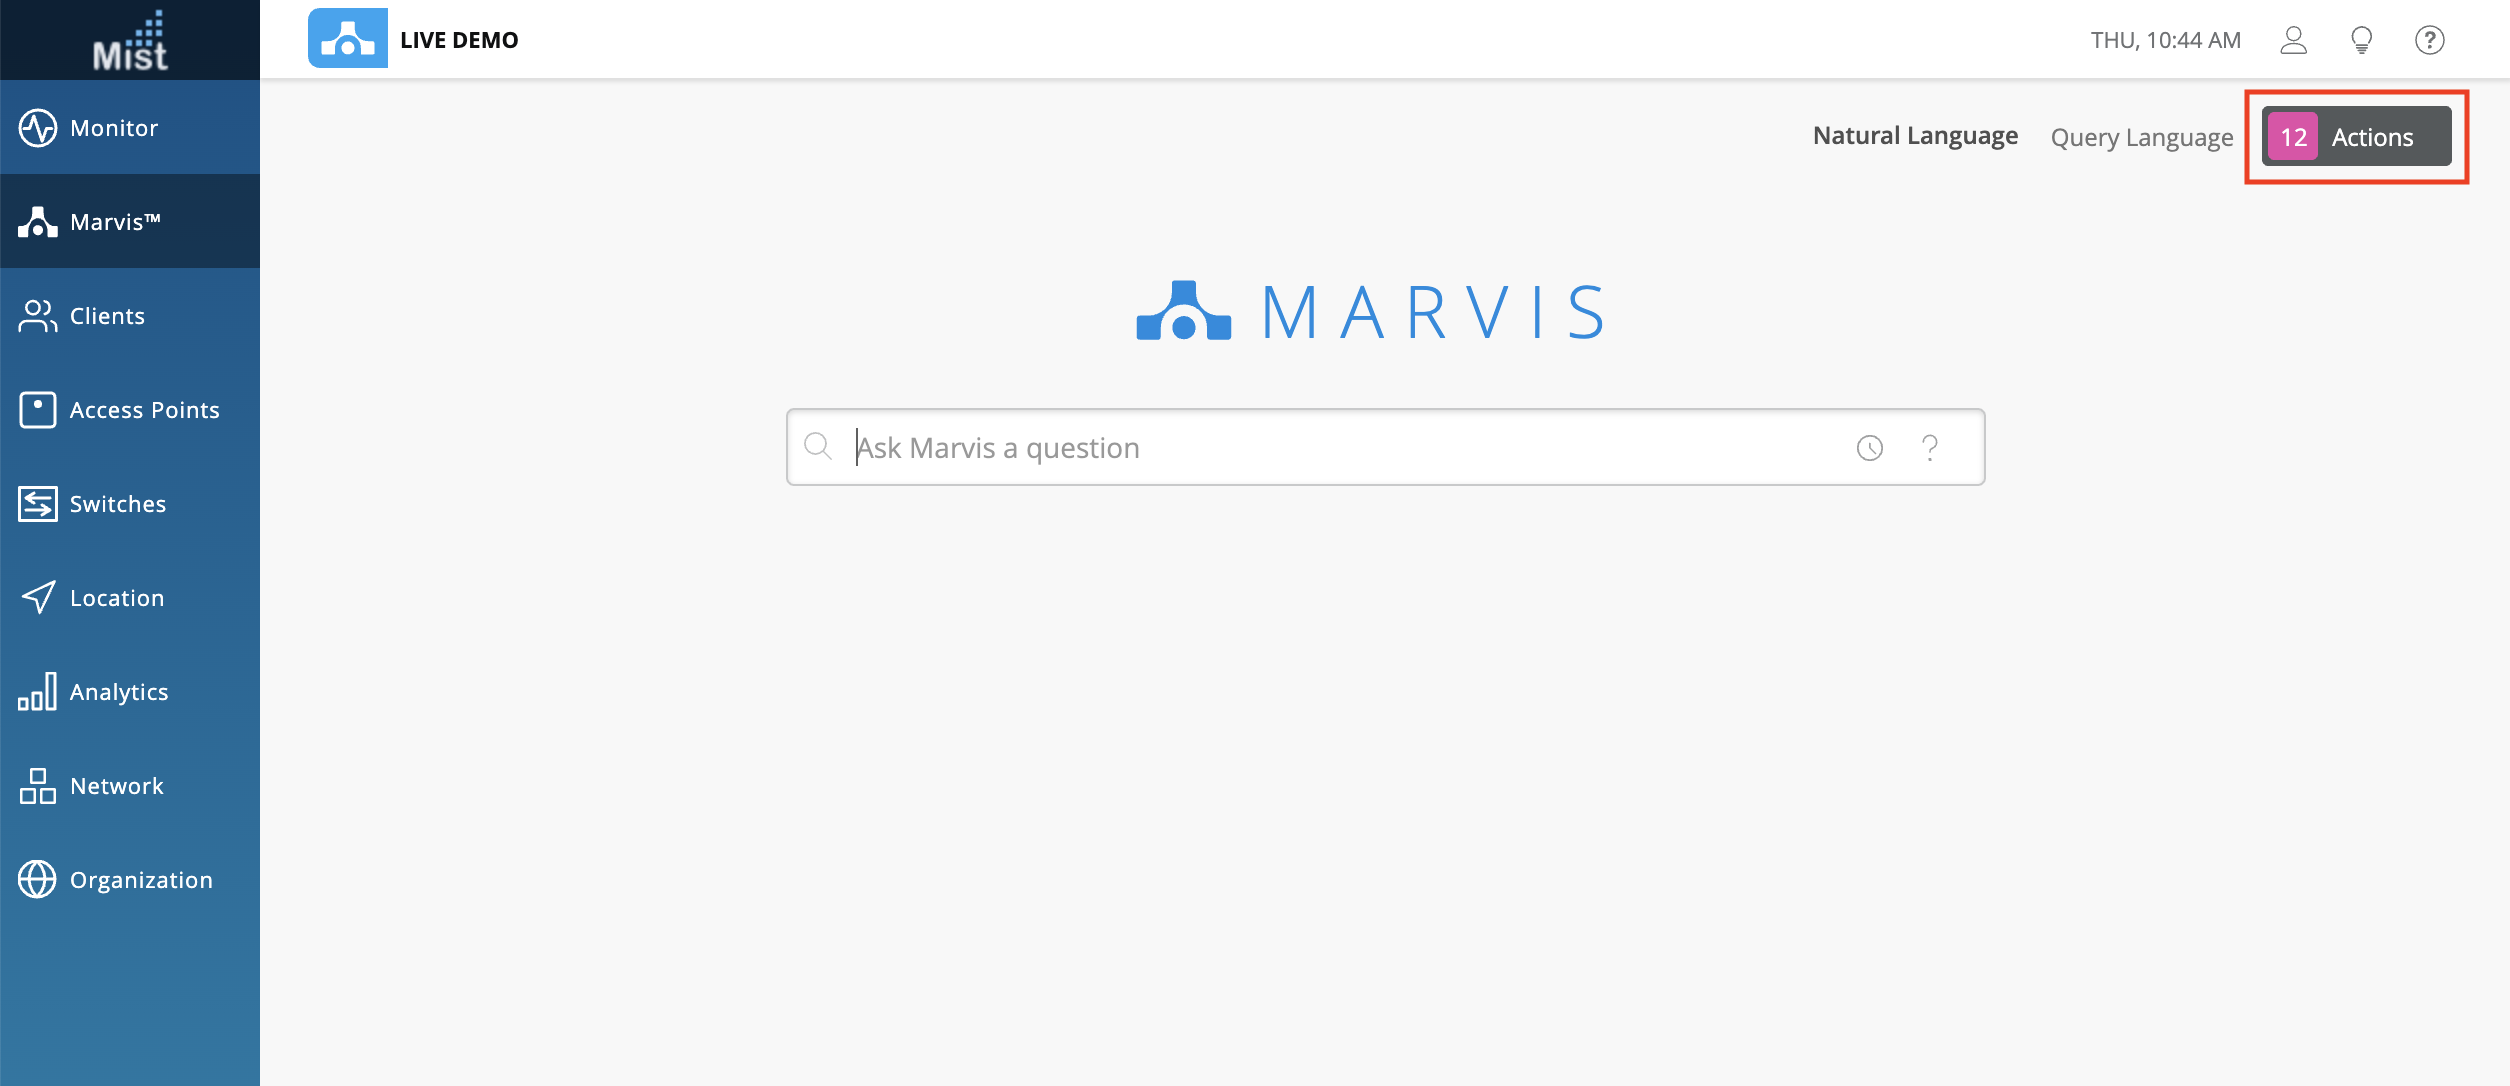
This week we are launching a new and improved UI for the Marvis page! When going to Marvis, the default view is now purely focused on the Marvis Questions bar which you are familiar with. We want to assist you in solving your network issues as quickly as possible so this is a distraction-free page for just that. The functionality remains the same, and you can still view your historical queries, or switch between Natural Language mode or Query Language Mode on the top right corner.
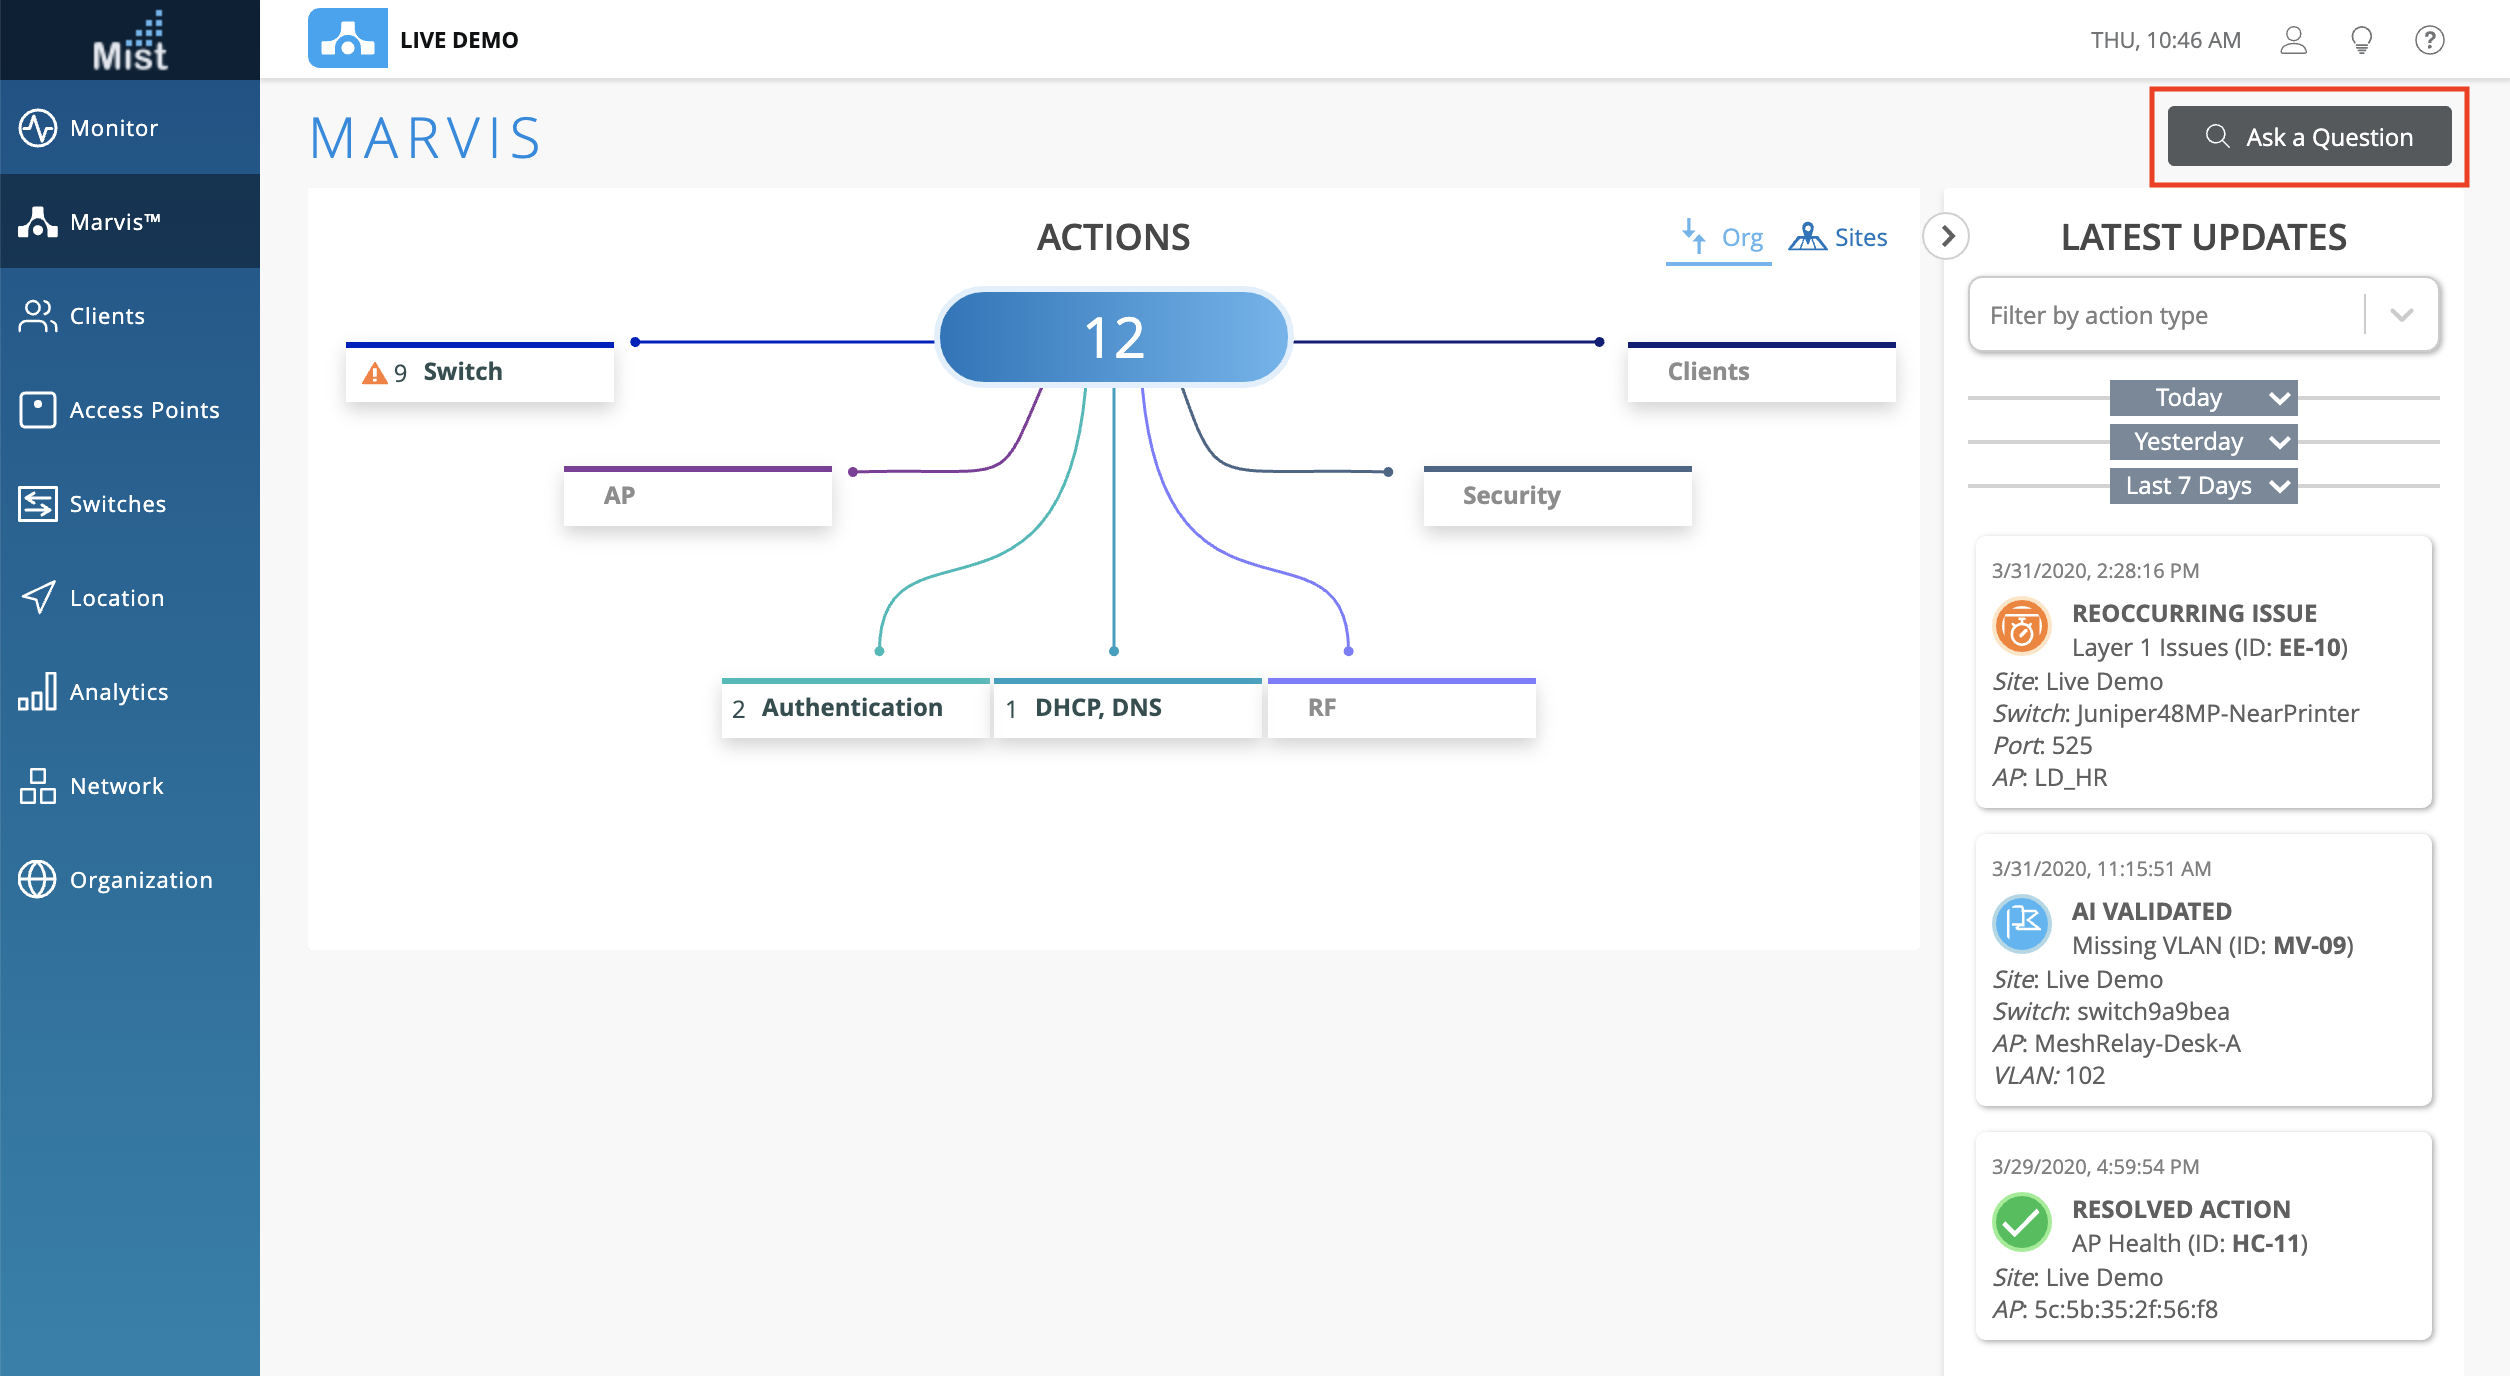
If you do not have any questions for Marvis at the moment and would just like to access the Actions Dashboard to get a quick glance at the health of your organization, simply select the Actions button on the top right to switch your view to the Action Dashboard. There will be an indicator on this button showing you how many suggested actions are currently present. Here, we see that our site has 12 of those.
While on the Marvis Actions page, if you ever need to go back to Questions, just select the Ask a Question button on the top right to go back to the main page.
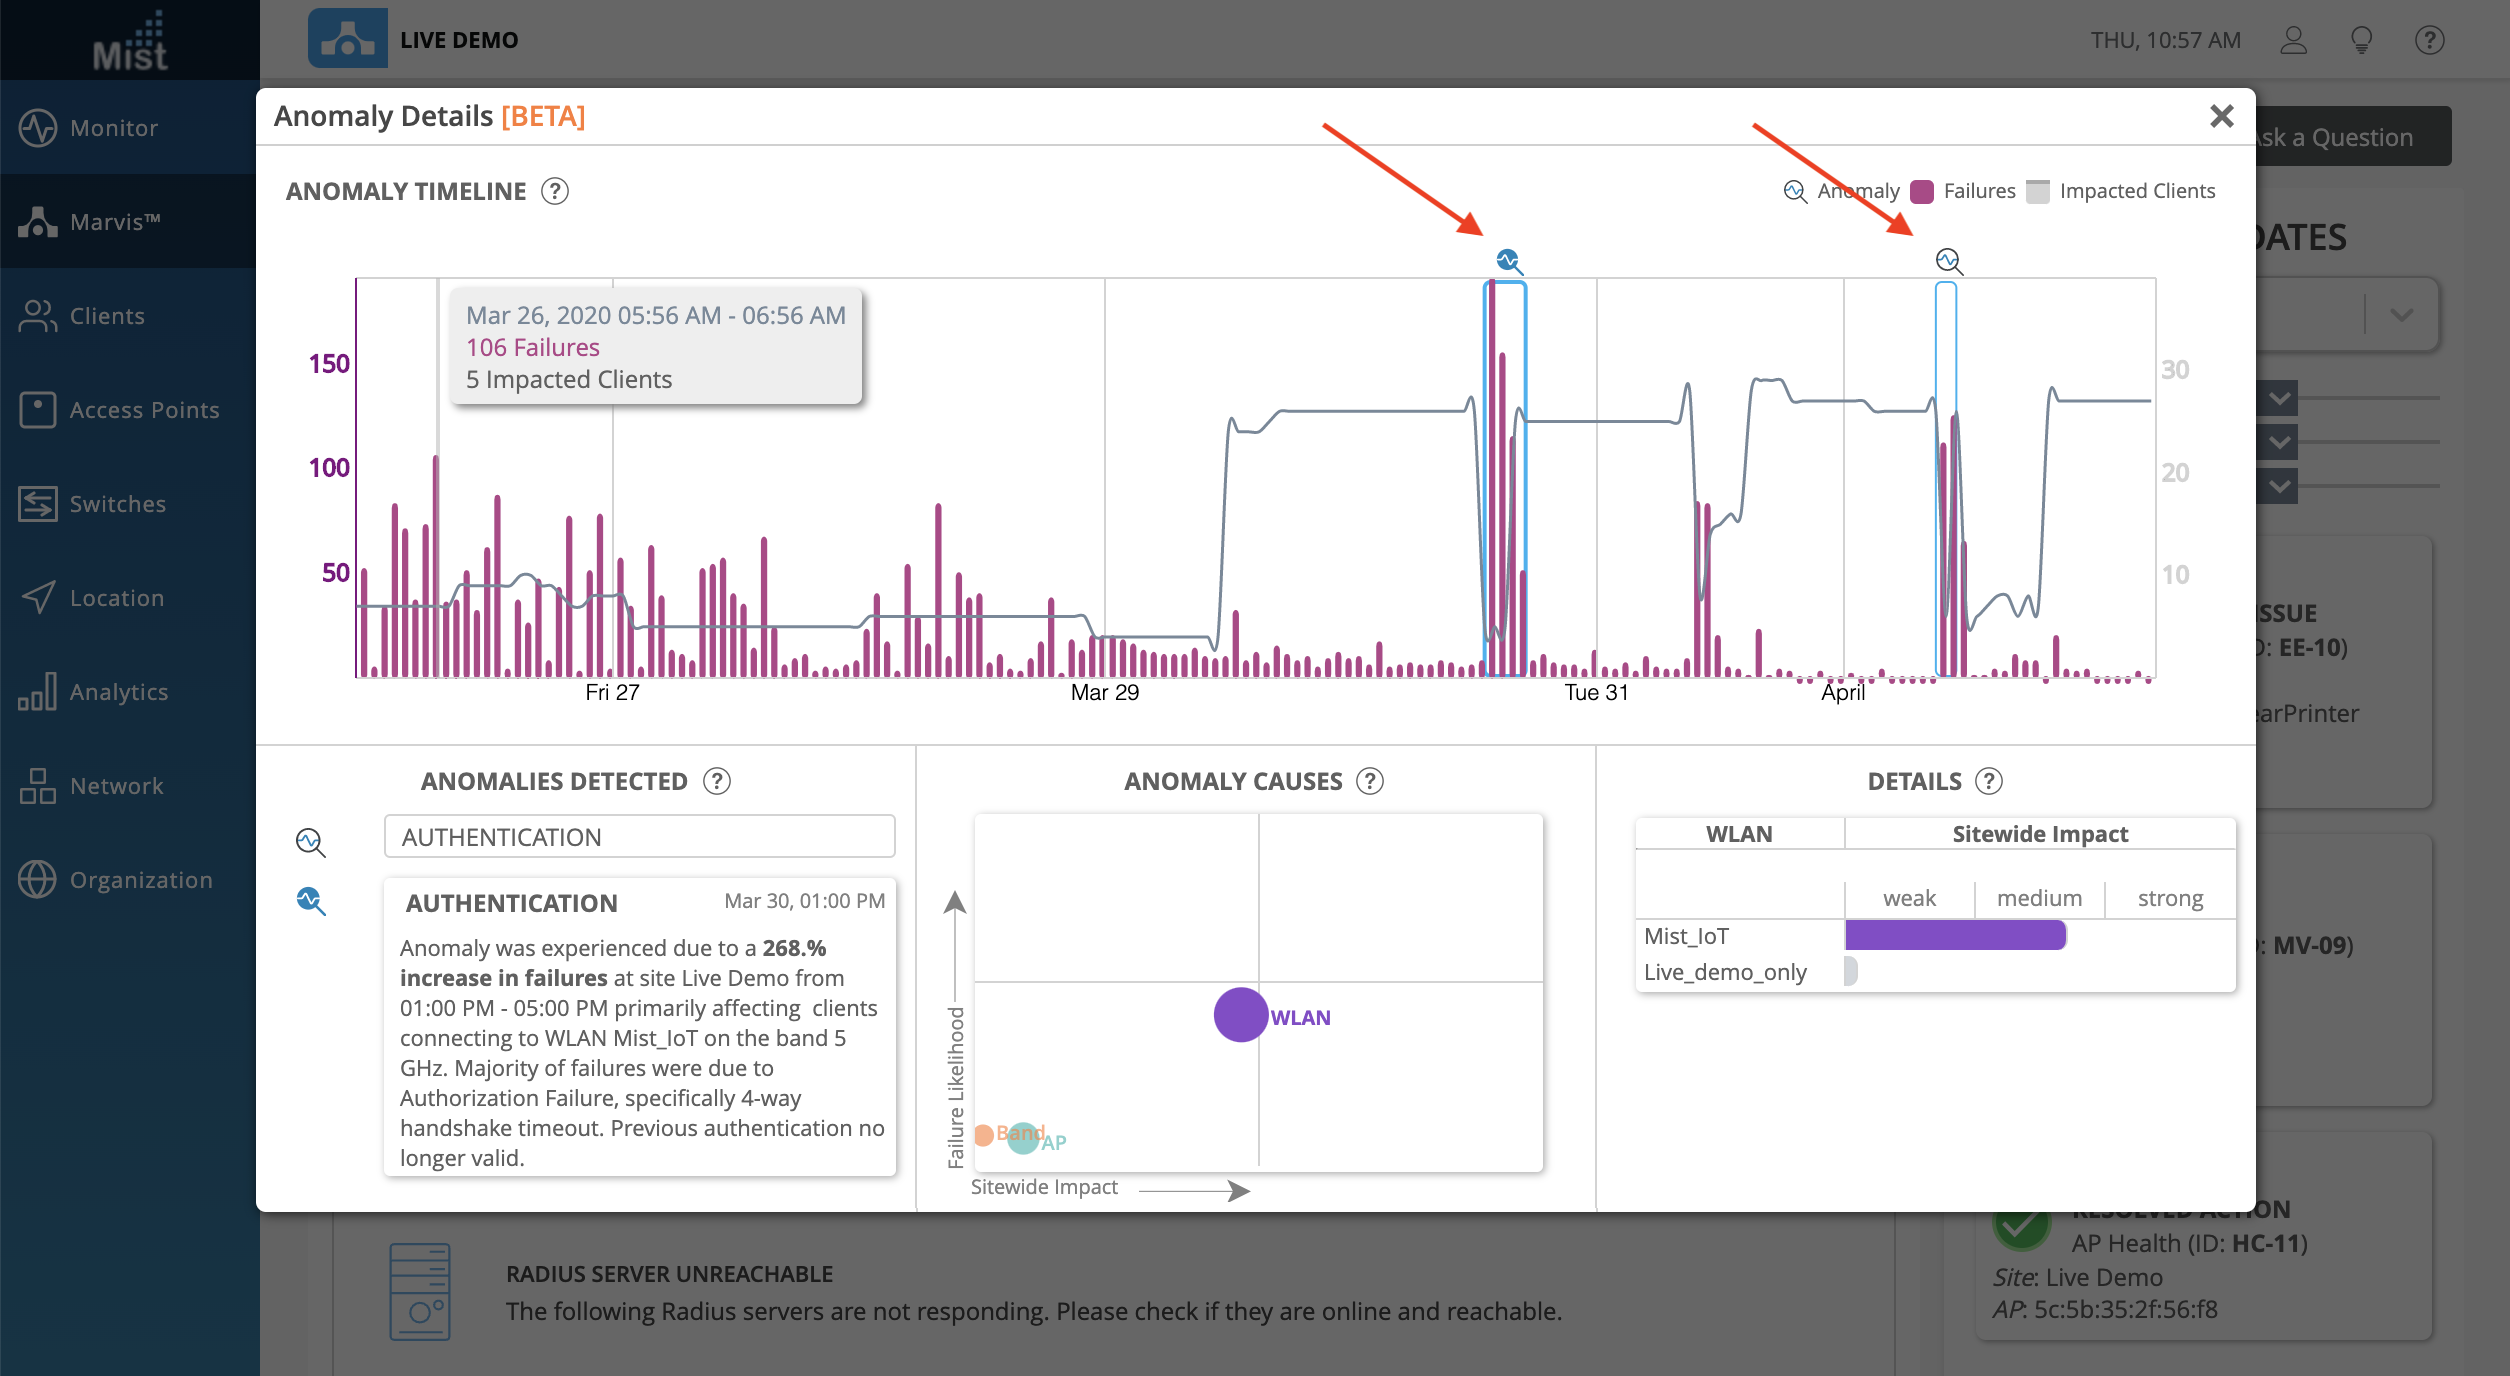
We are always looking to improve upon our Marvis pages, and this week we have an exciting new feature for you! The new Event Card, as a part of Marvis Actions will show you a more detailed diagnosis on the anomalies of some of your Suggested Actions. The Event Card is available on Authentication (Both EAP/802.1X and PSK) and DHCP Failure events. To open an Event Card, go to one of these suggestions and select View Anomaly.
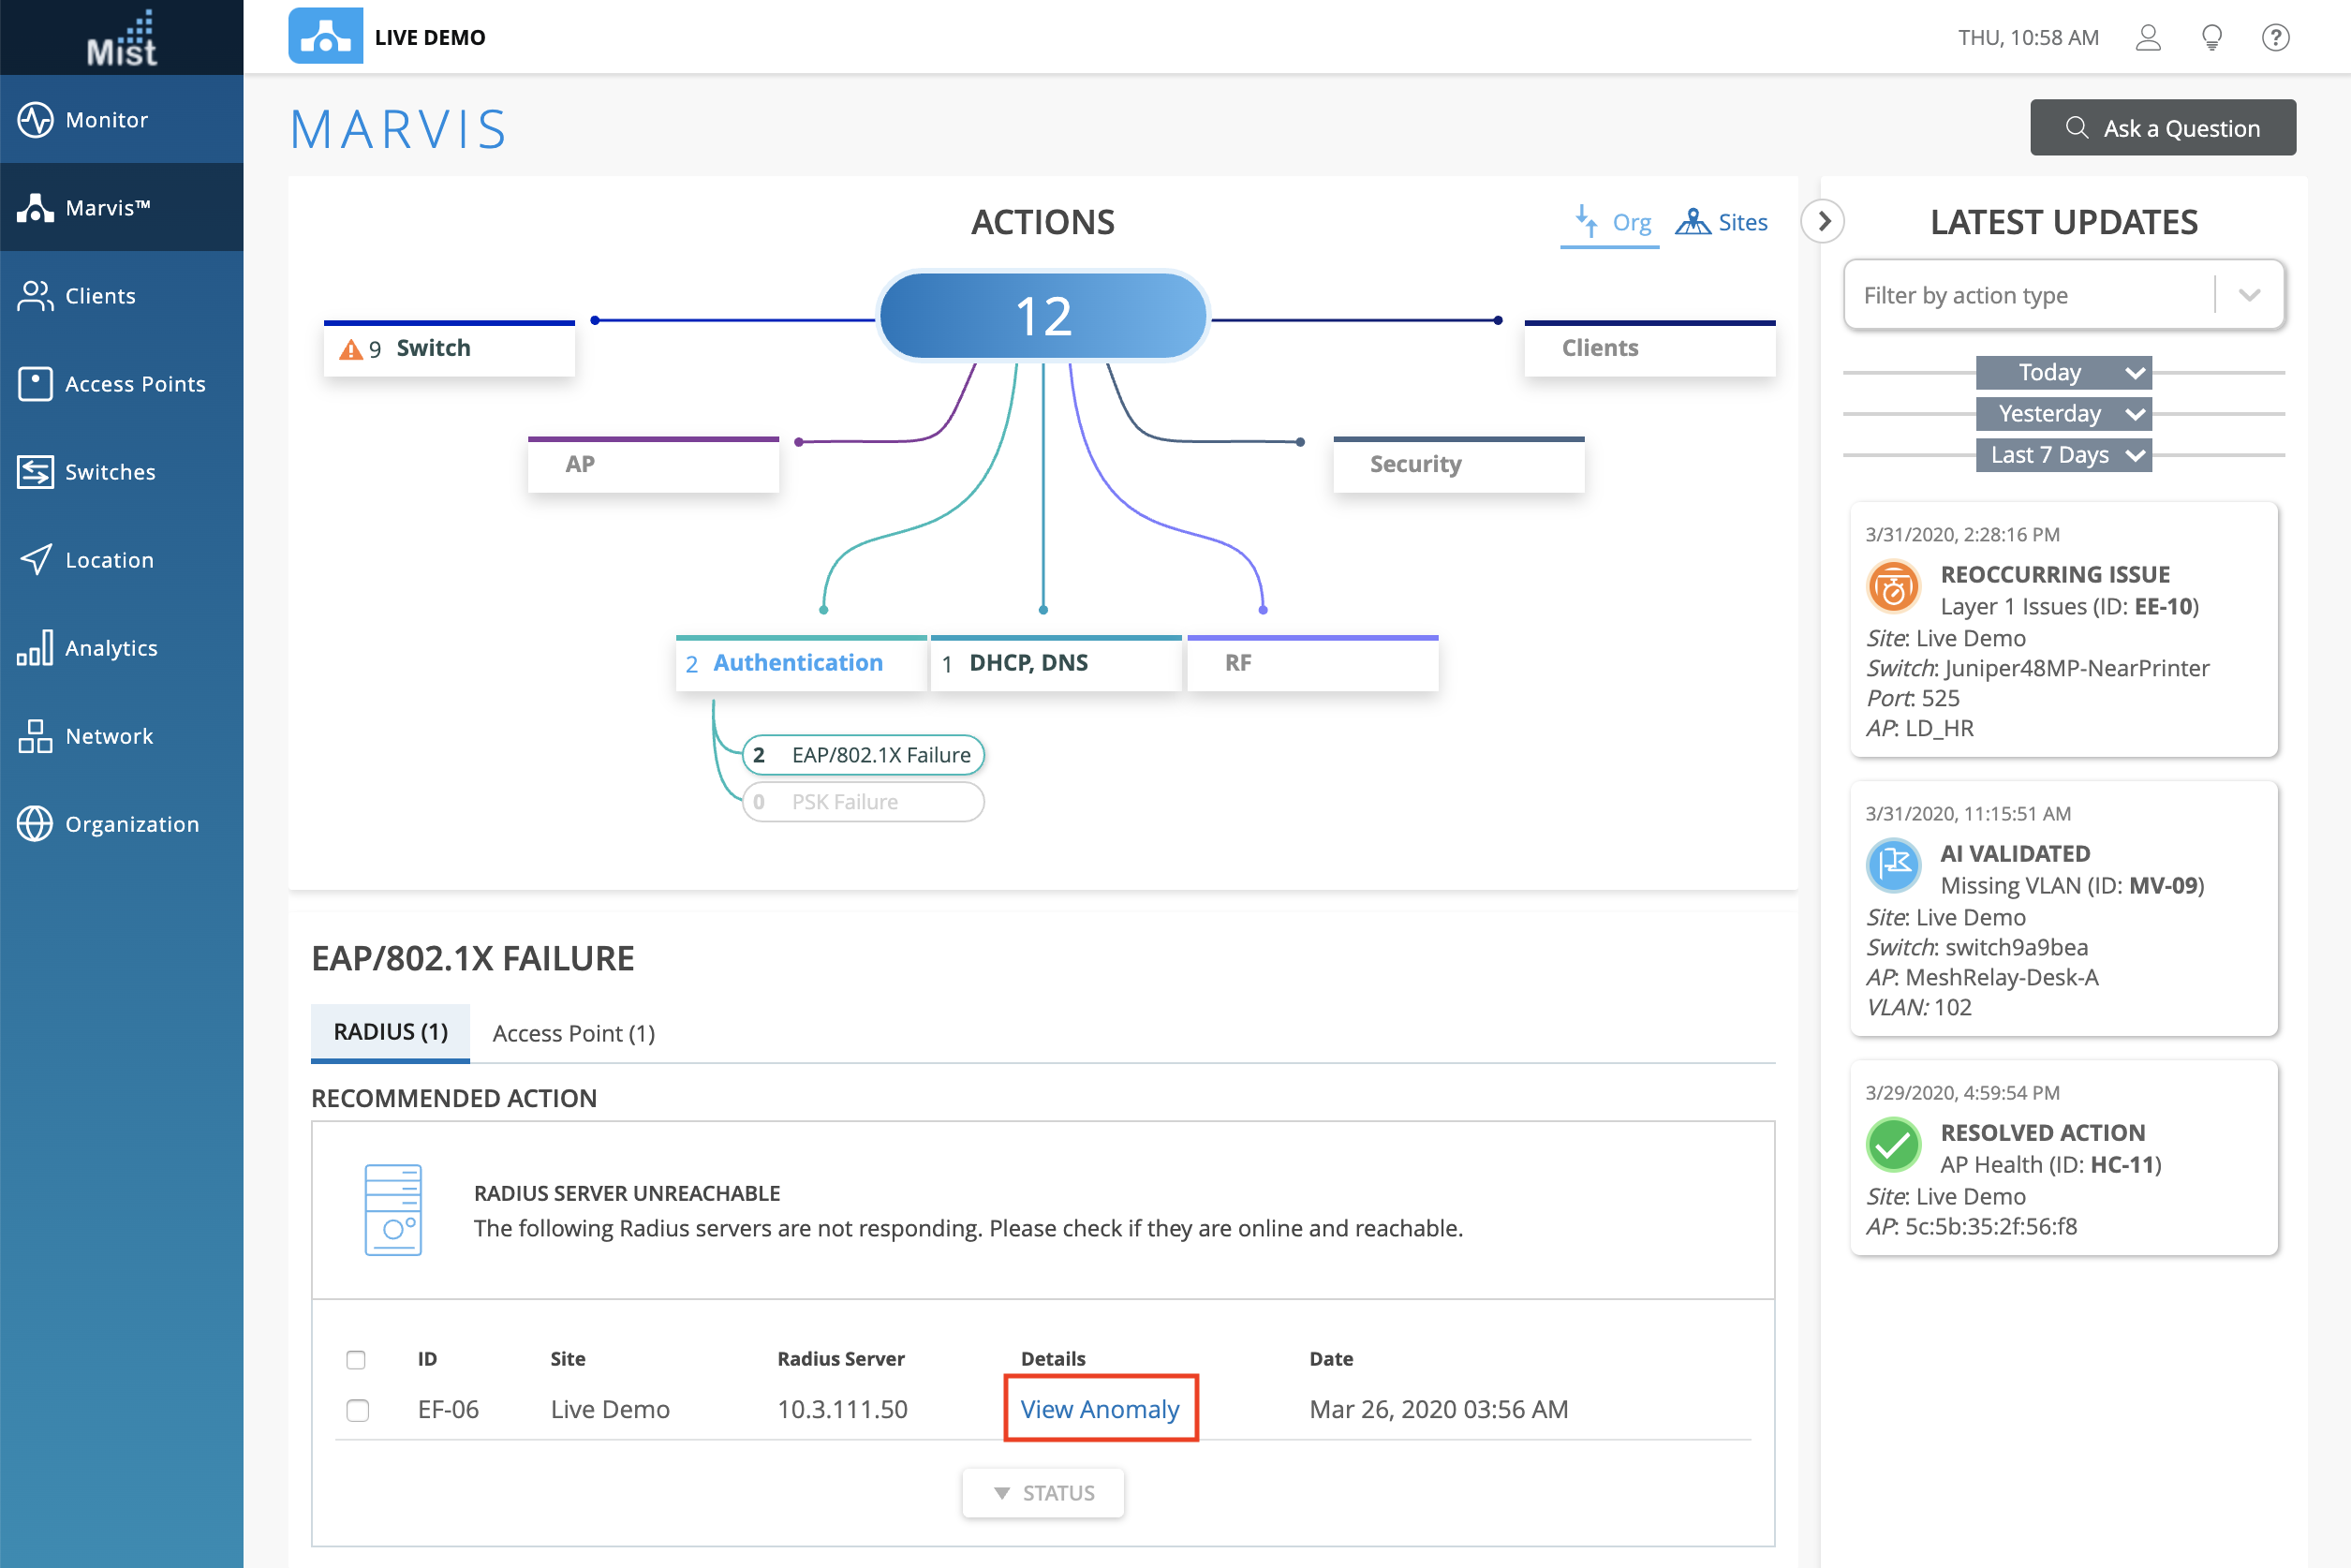
This will open the Event card, which has four parts:
The Anomaly Timeline shows a timeline view of the number of failure events corresponding with the number of impacted clients during this time. Detected anomalies are indicated with the magnifying glass icon, and you may click on these to select an anomaly to view. In this timeline we have 2 detected anomalies.
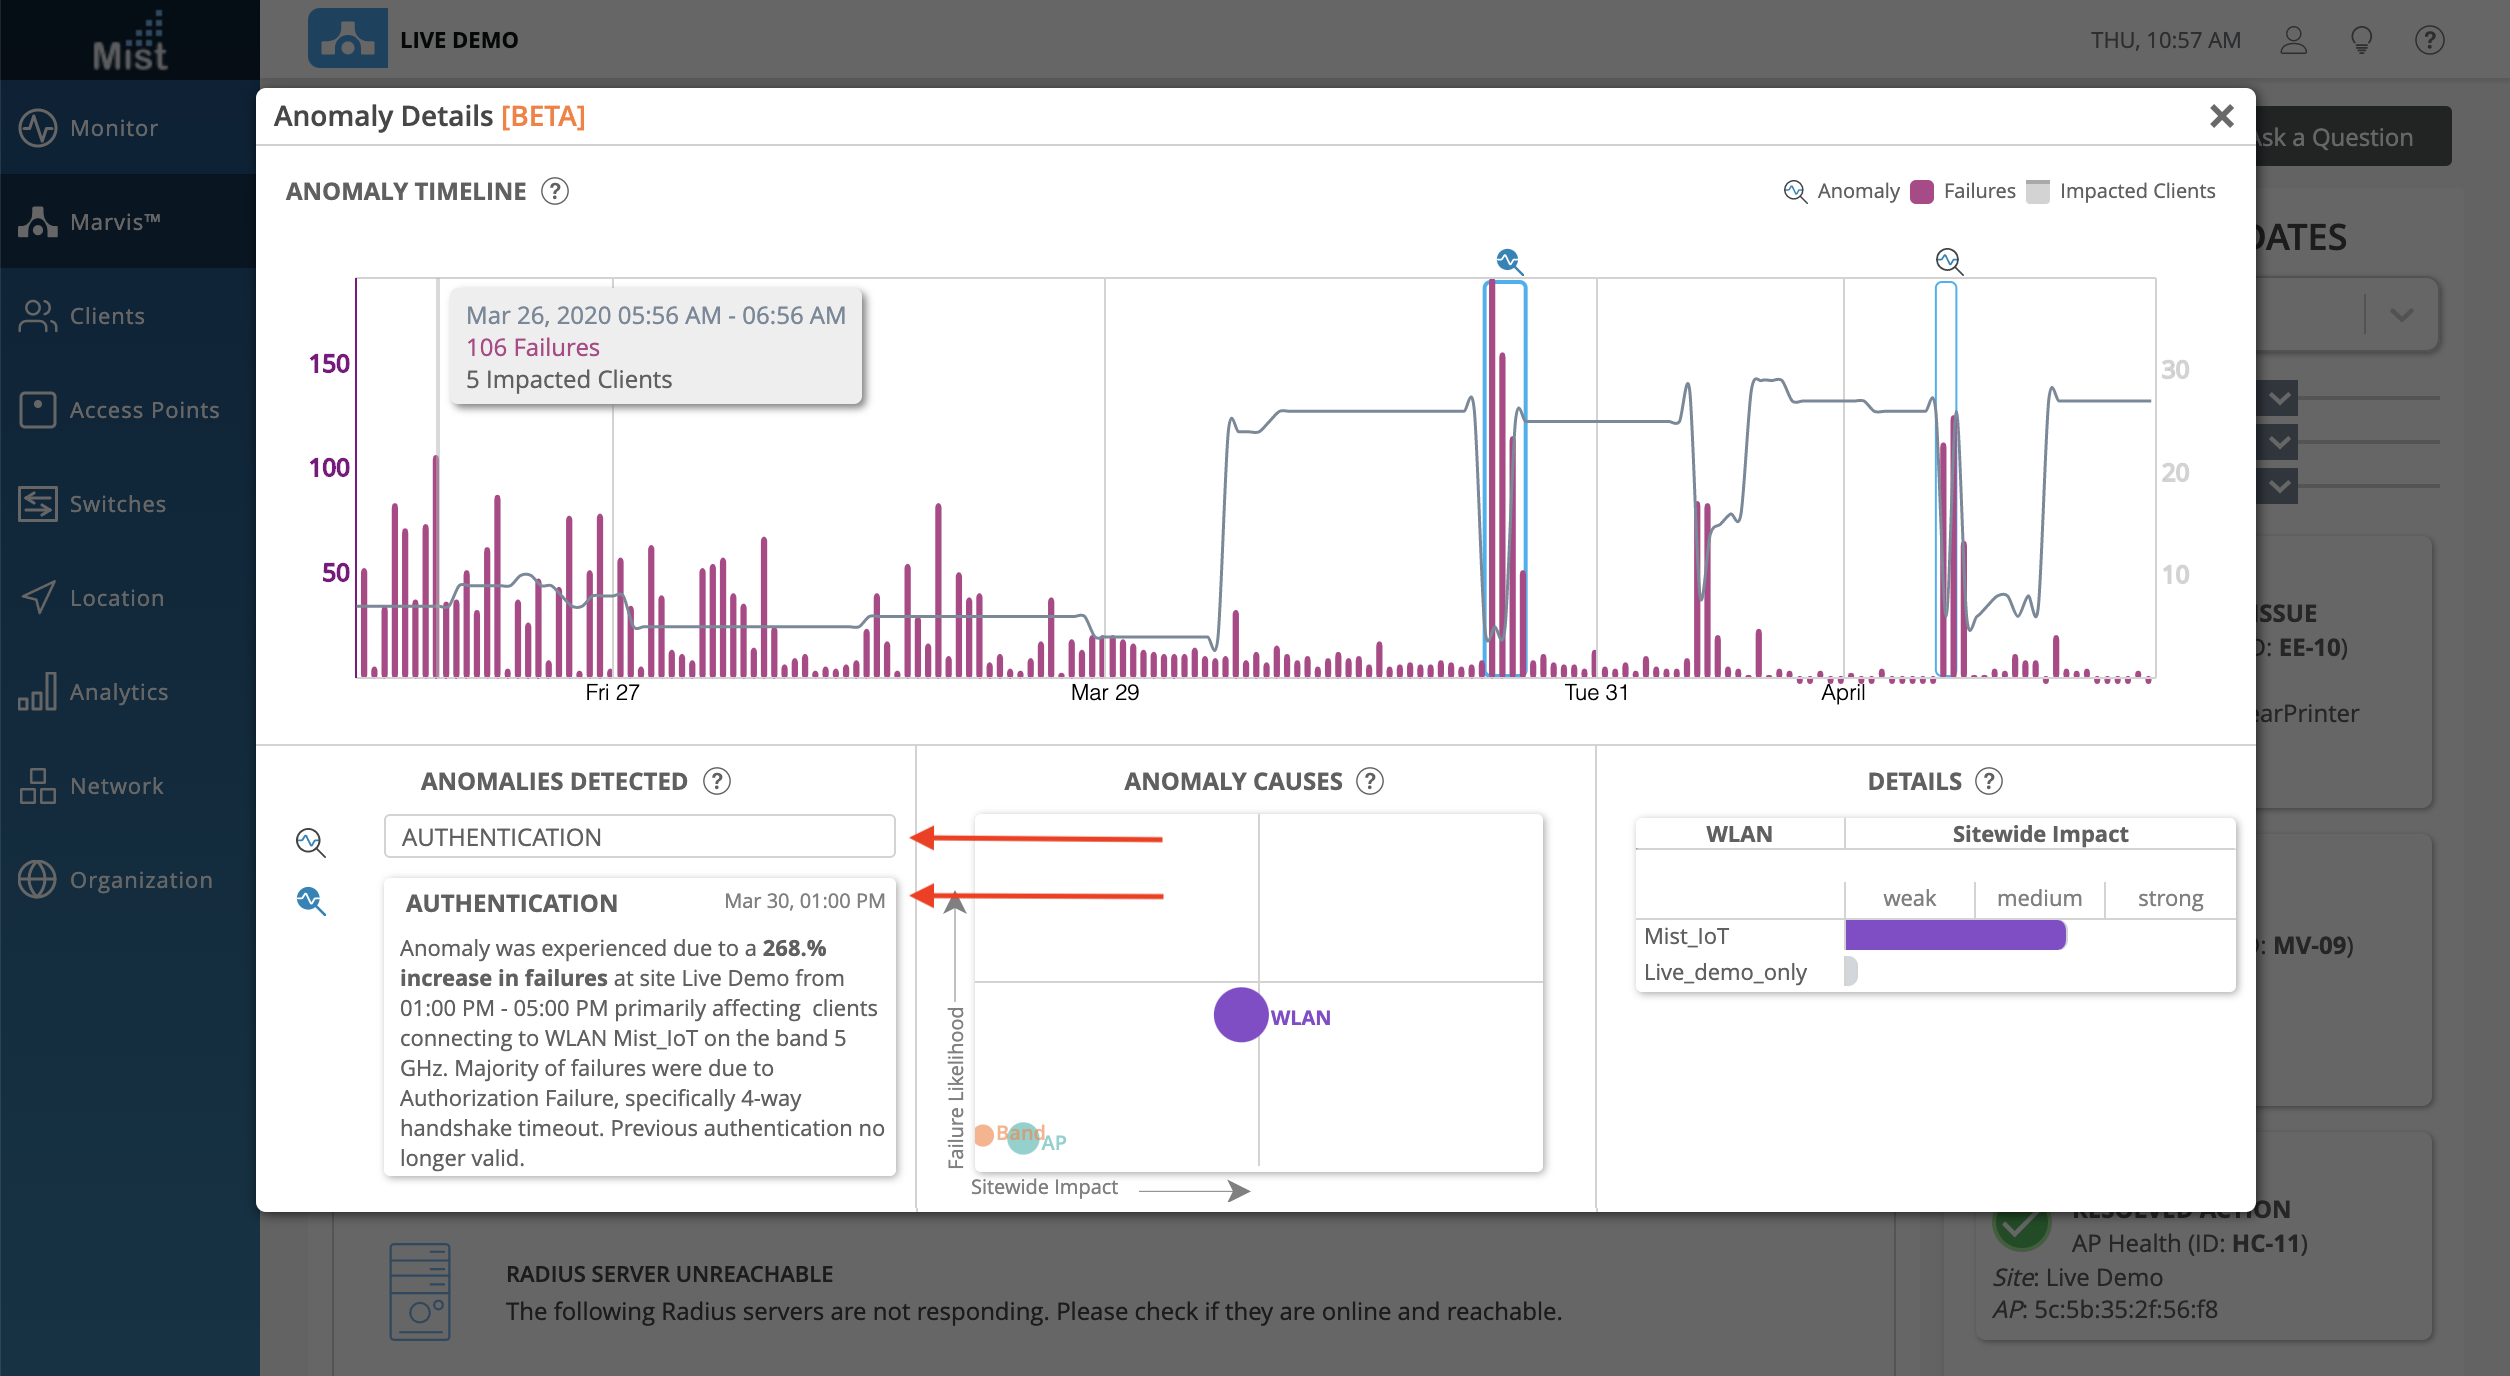
The Anomalies Detected section gives you a description of each anomaly, explaining what the increase in failures were at the time, what the most likely cause was, and if the clients mostly failed on a certain Band, AP, or WLAN. Select between different anomalies by clicking their Title. Here, we have 2 different Authentication anomalies.
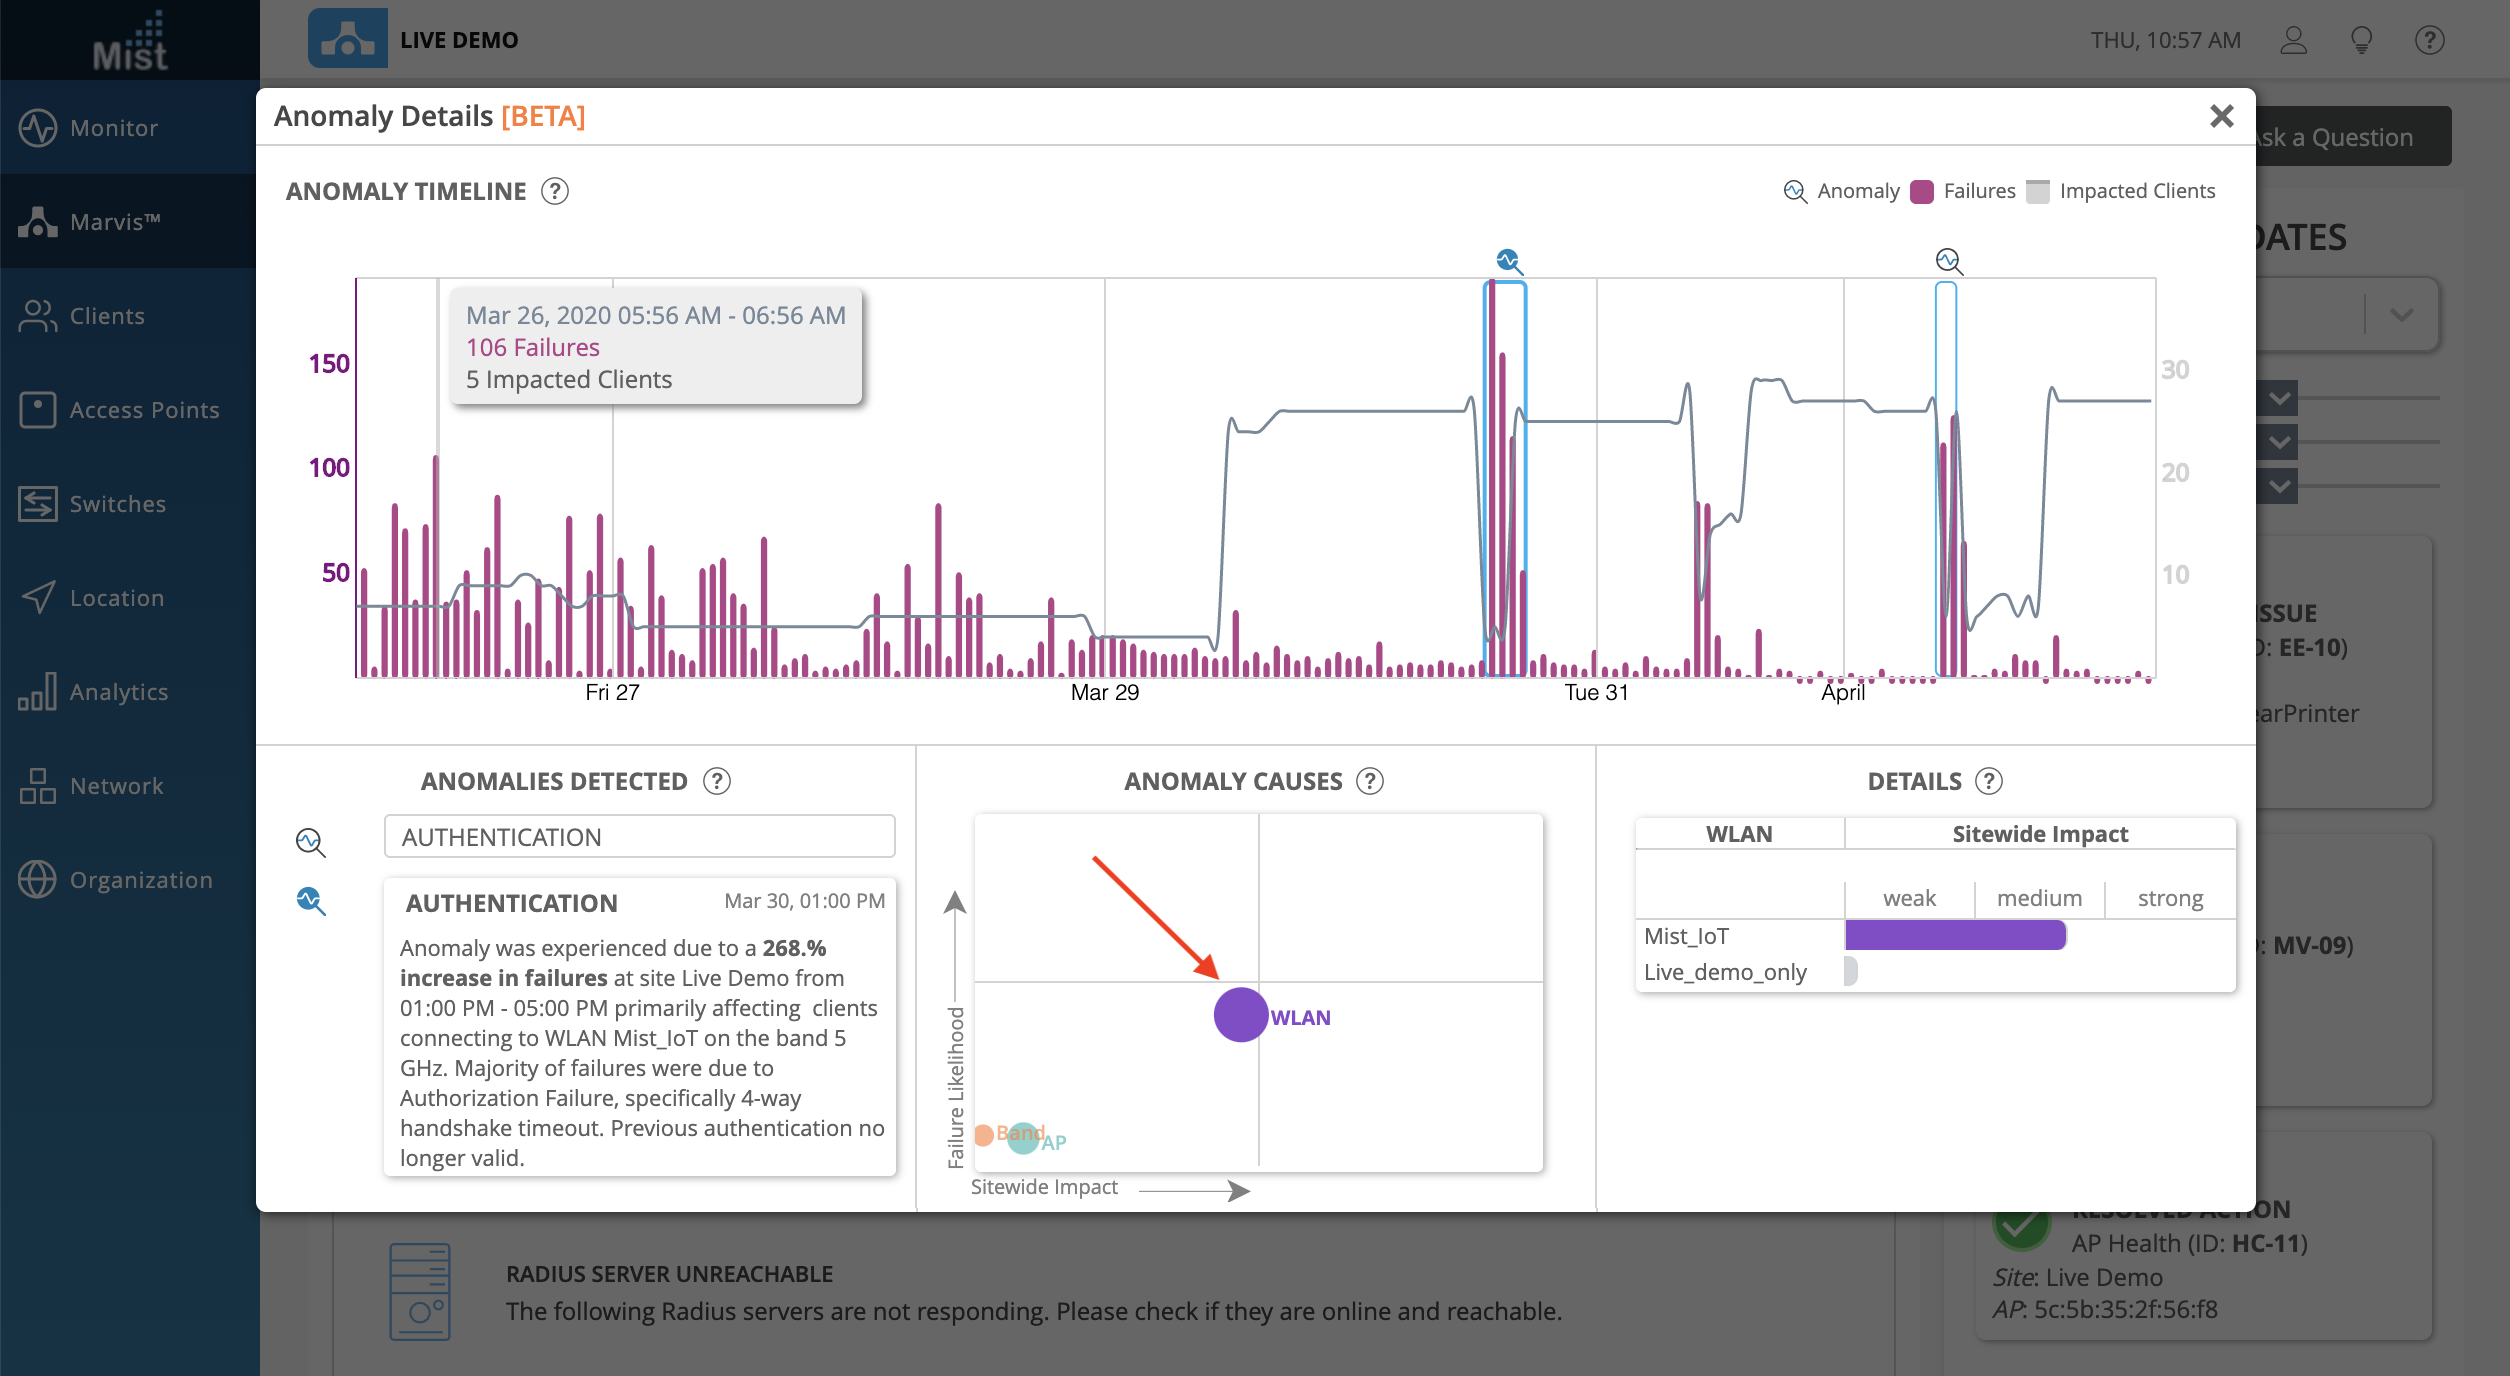
The Anomaly Causes section gives you a graphical representation of the impact between AP, WLAN, and Radio Band. The size of the circle indicates the correlation to failure, and the positions on the graph show the Failure Likelihood as well as Sitewide Impact. Clicking on the circles will change the view of the Details box to the right, which lists out each of the APs, WLANs, or Bands, giving a more in depth view of sitewide impact from each specific element.
Here, selecting the WLAN circle will reveal the list of WLANs which contributed to the anomaly. In our example we can see that the Mist_IoT WLAN has a stronger impact on this anomaly:
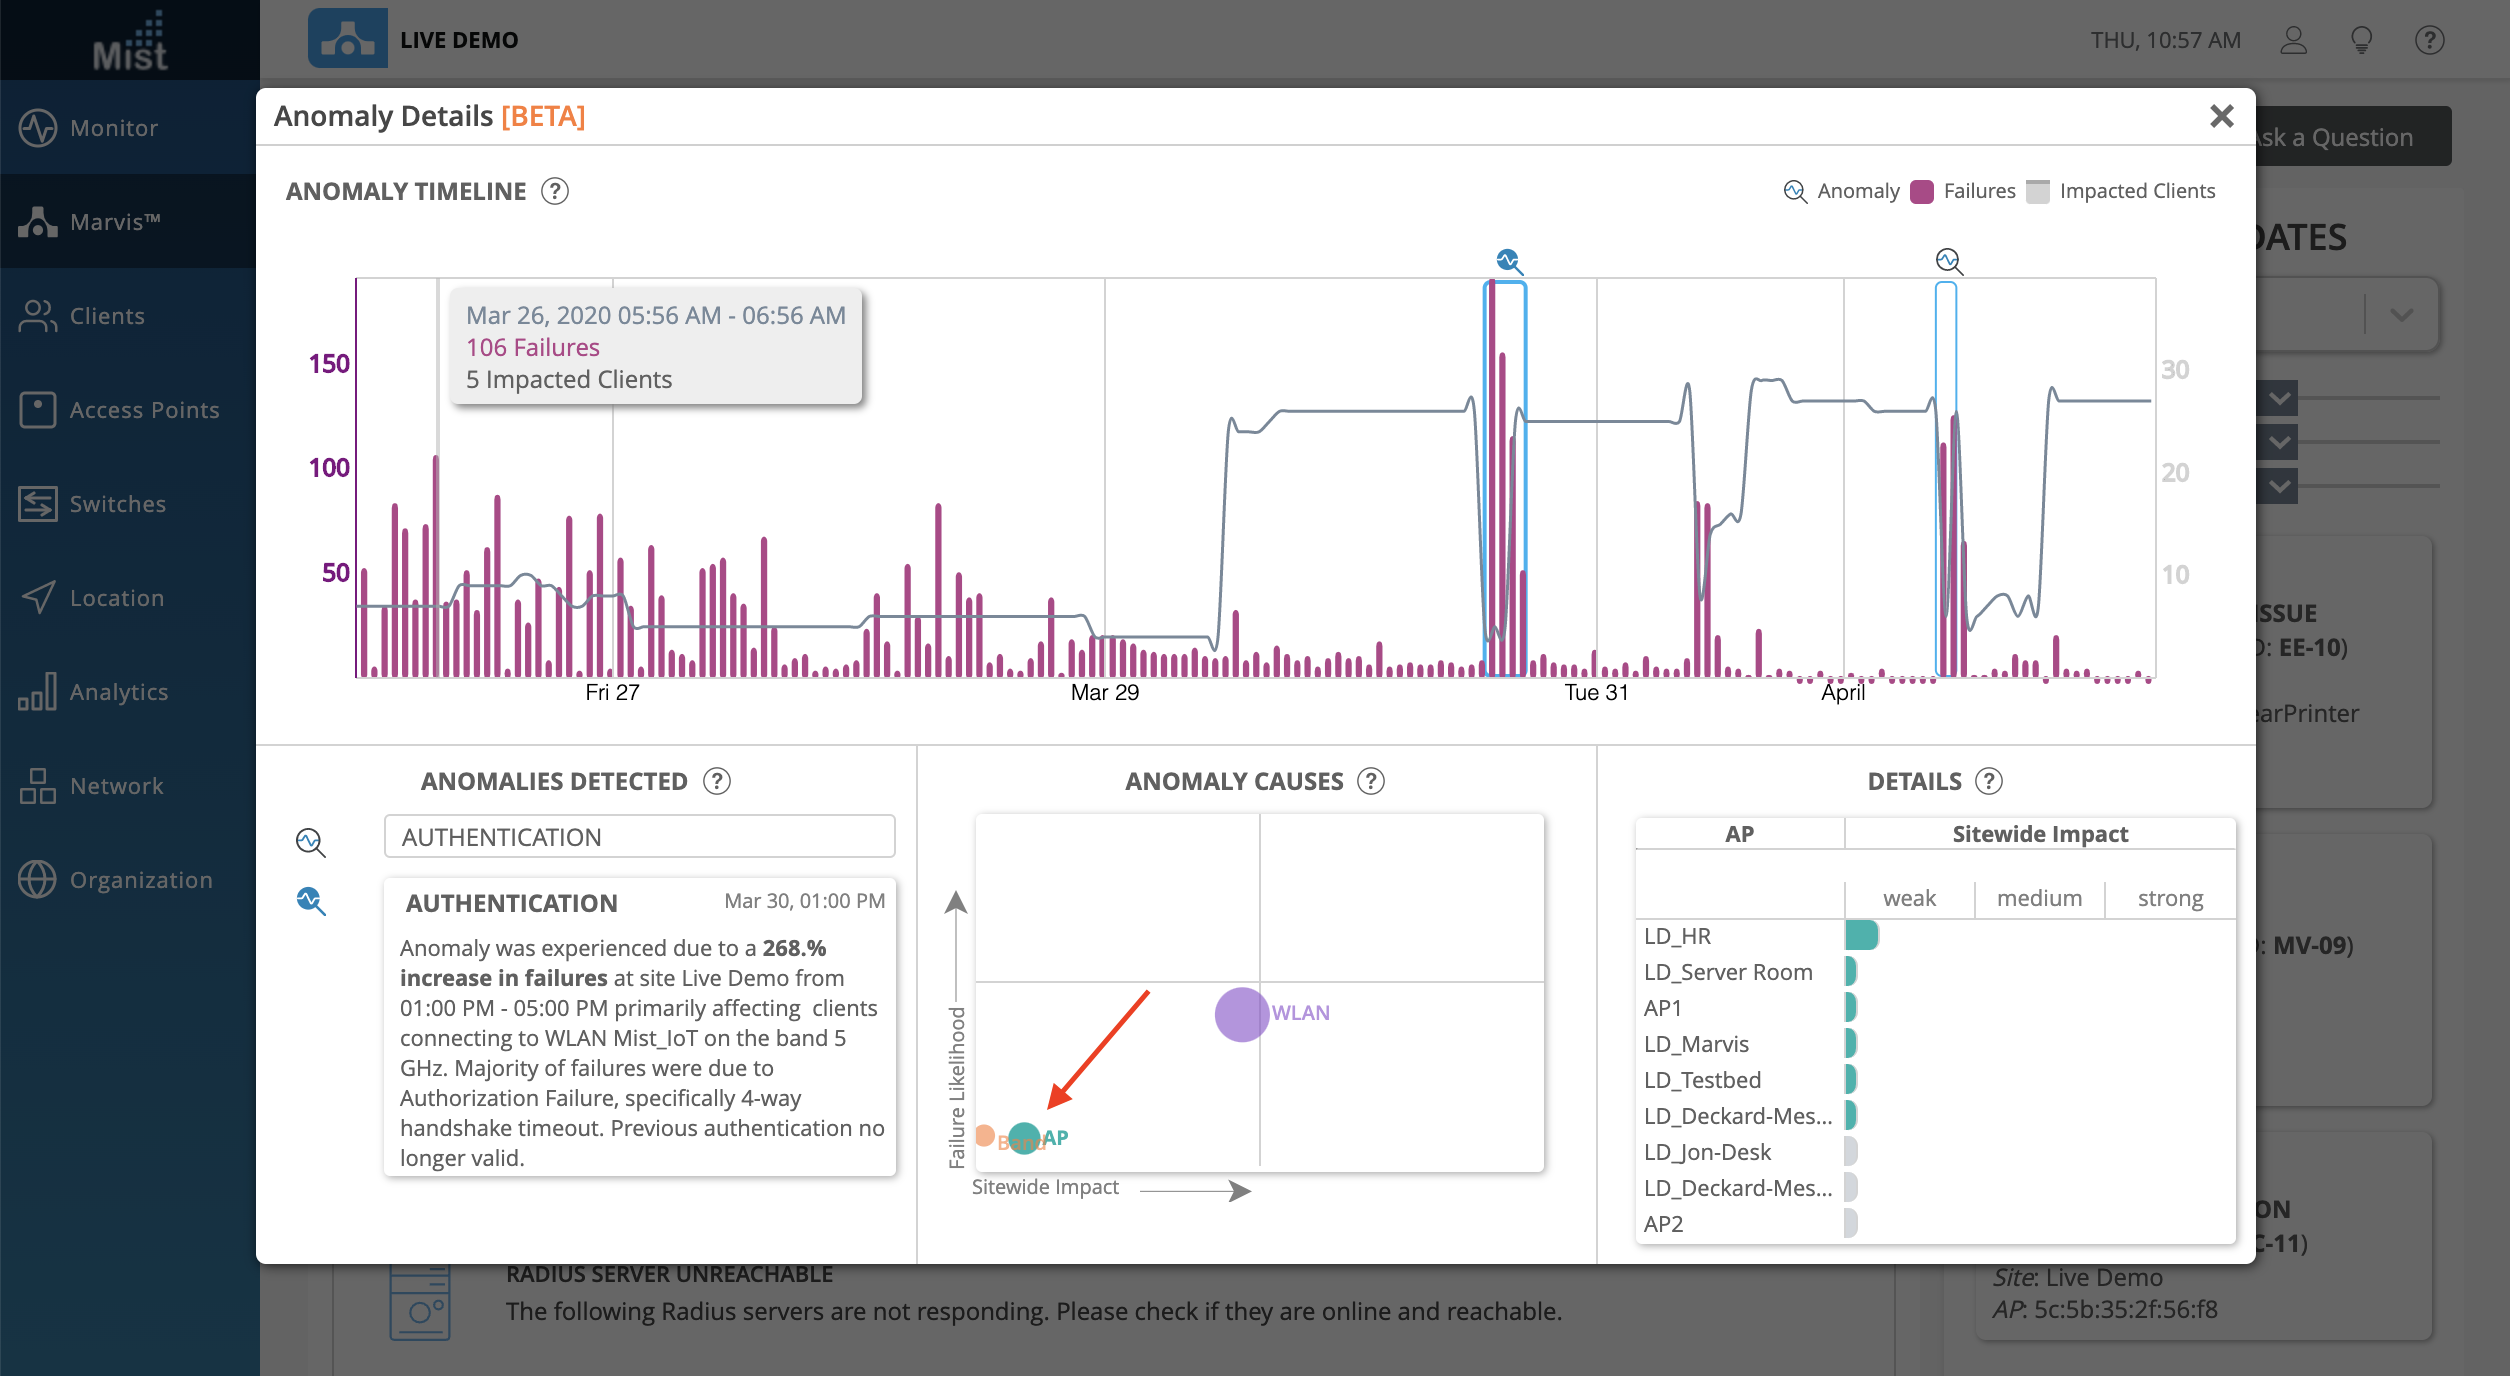
Selecting the AP circle shows the list of APs which were correlated to the anomaly event:
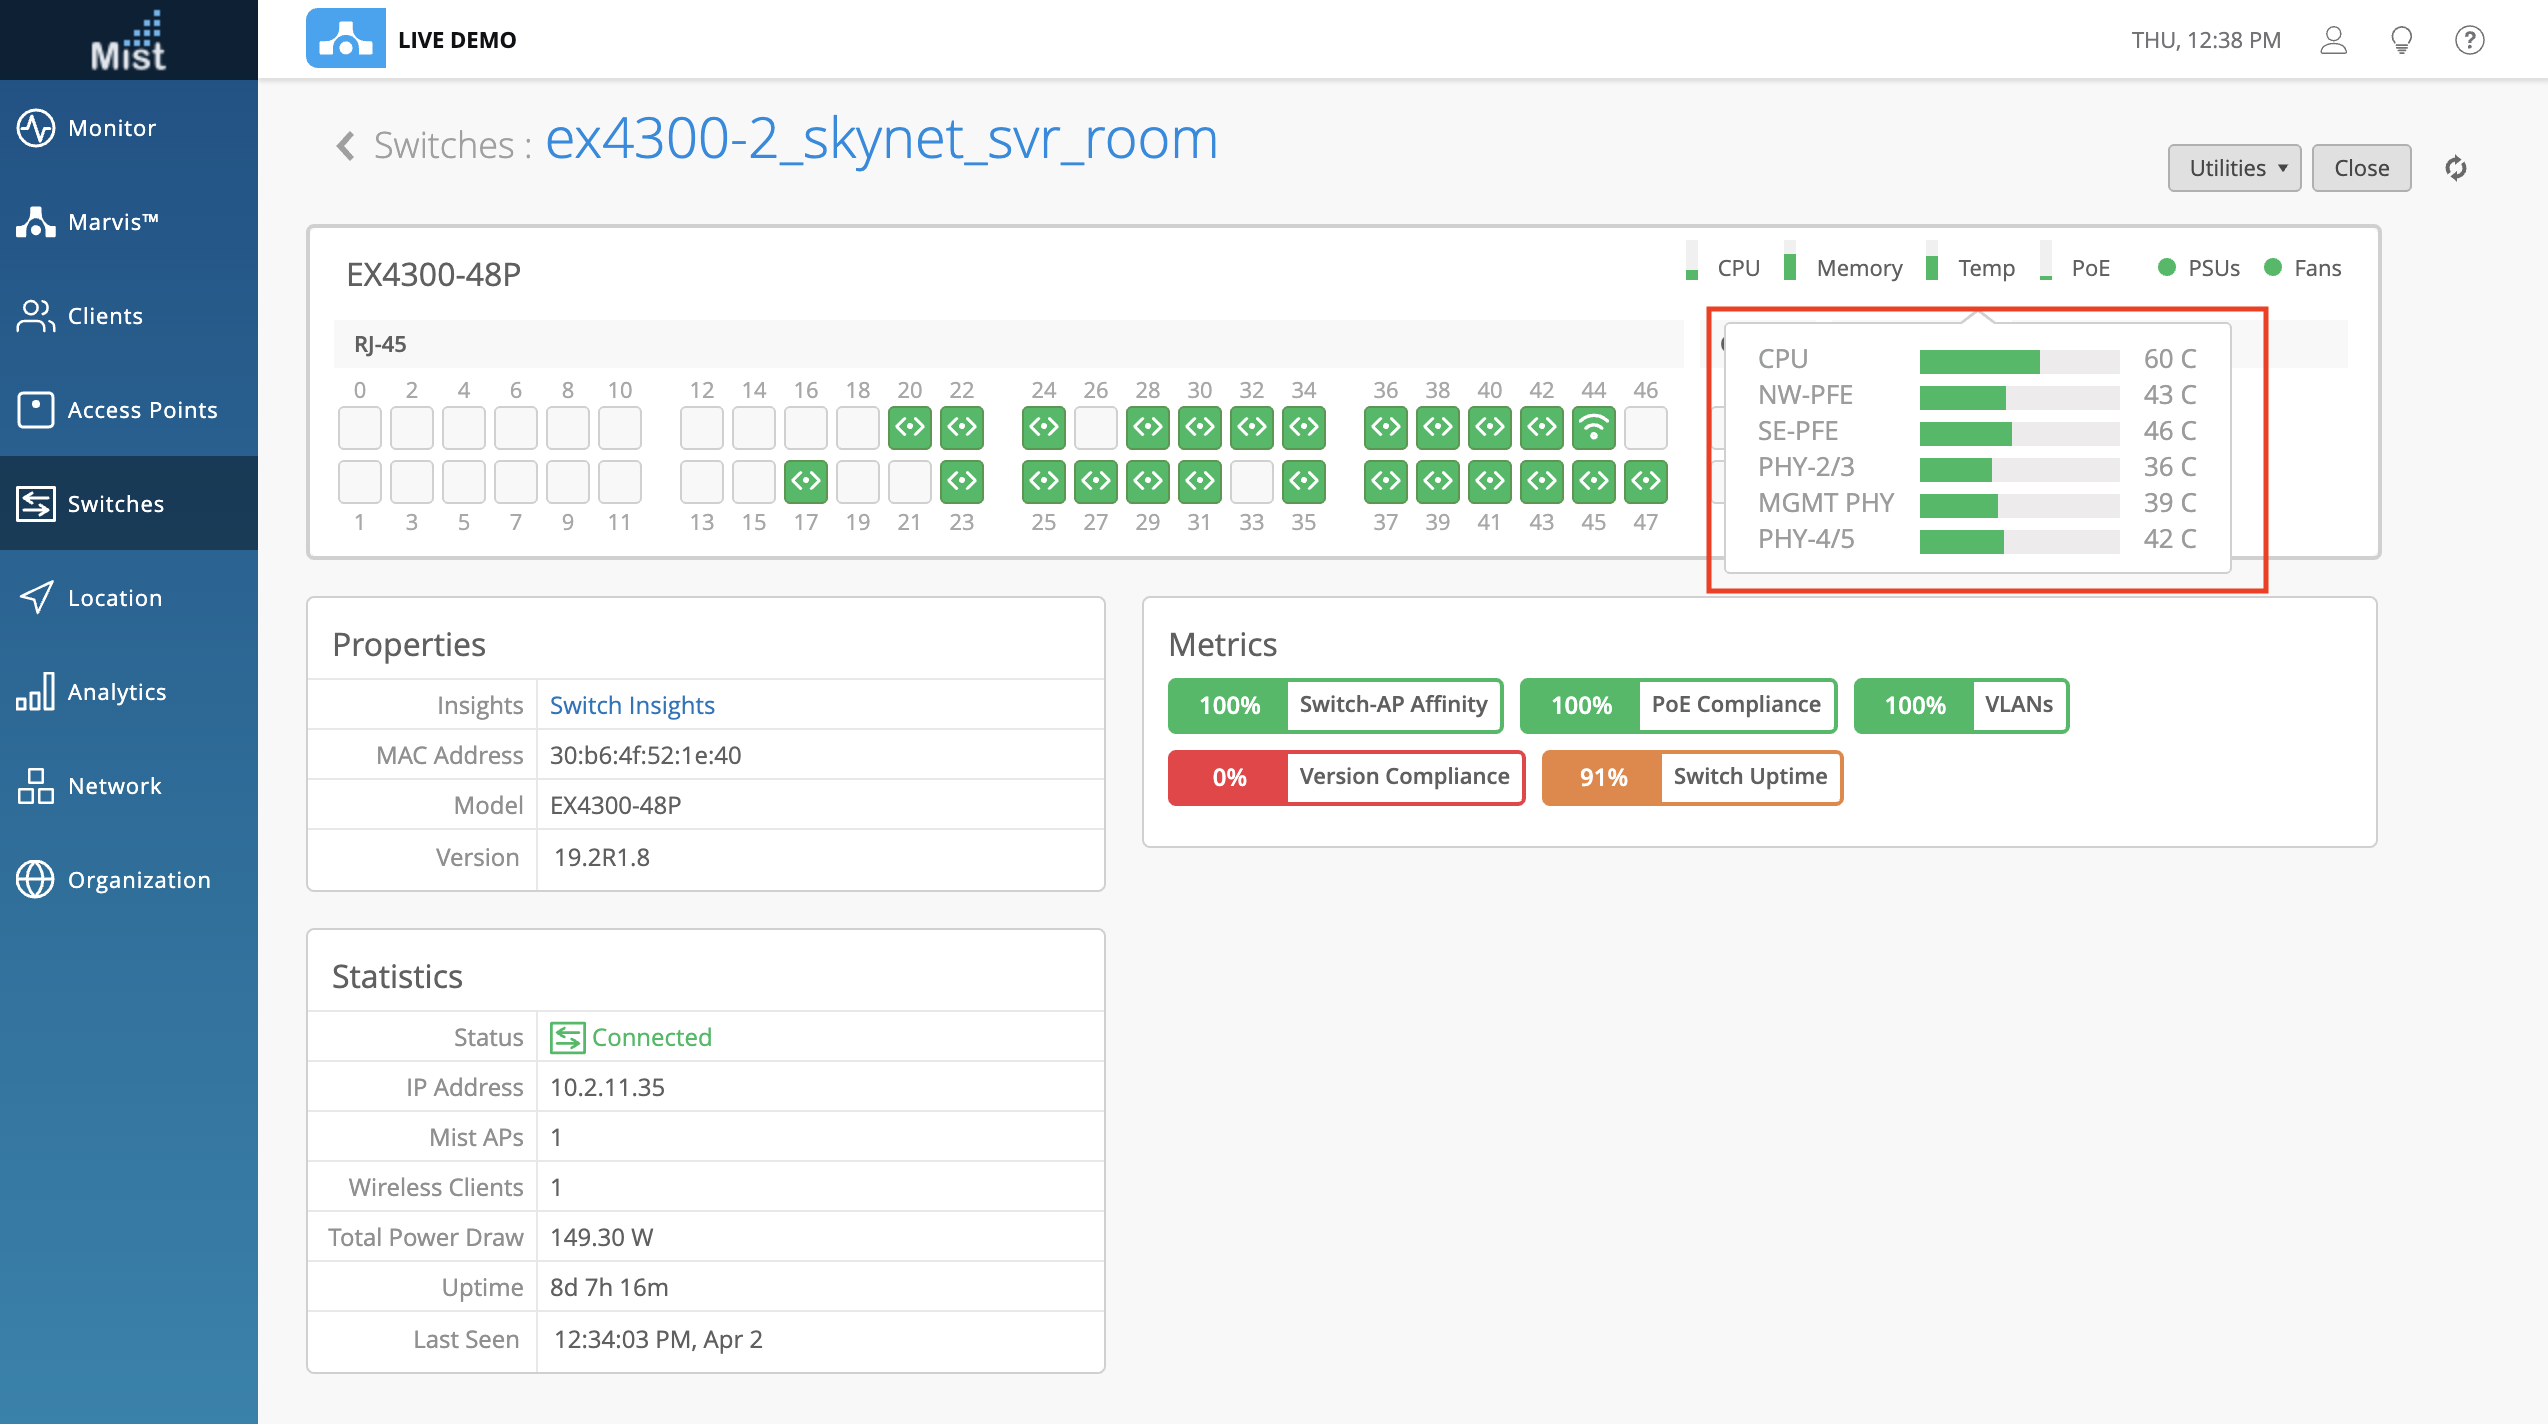
This week we are bringing improved visualization of your EX Switches by providing more details and a better logical representation of your switch on our UI. With our updated front panel view, you can get a better sense of the status and health of your switches, as well as wired clients/APs connected to your switches. To view your Switch Details, navigate to the Switches page and select a switch that has been adopted to your site.
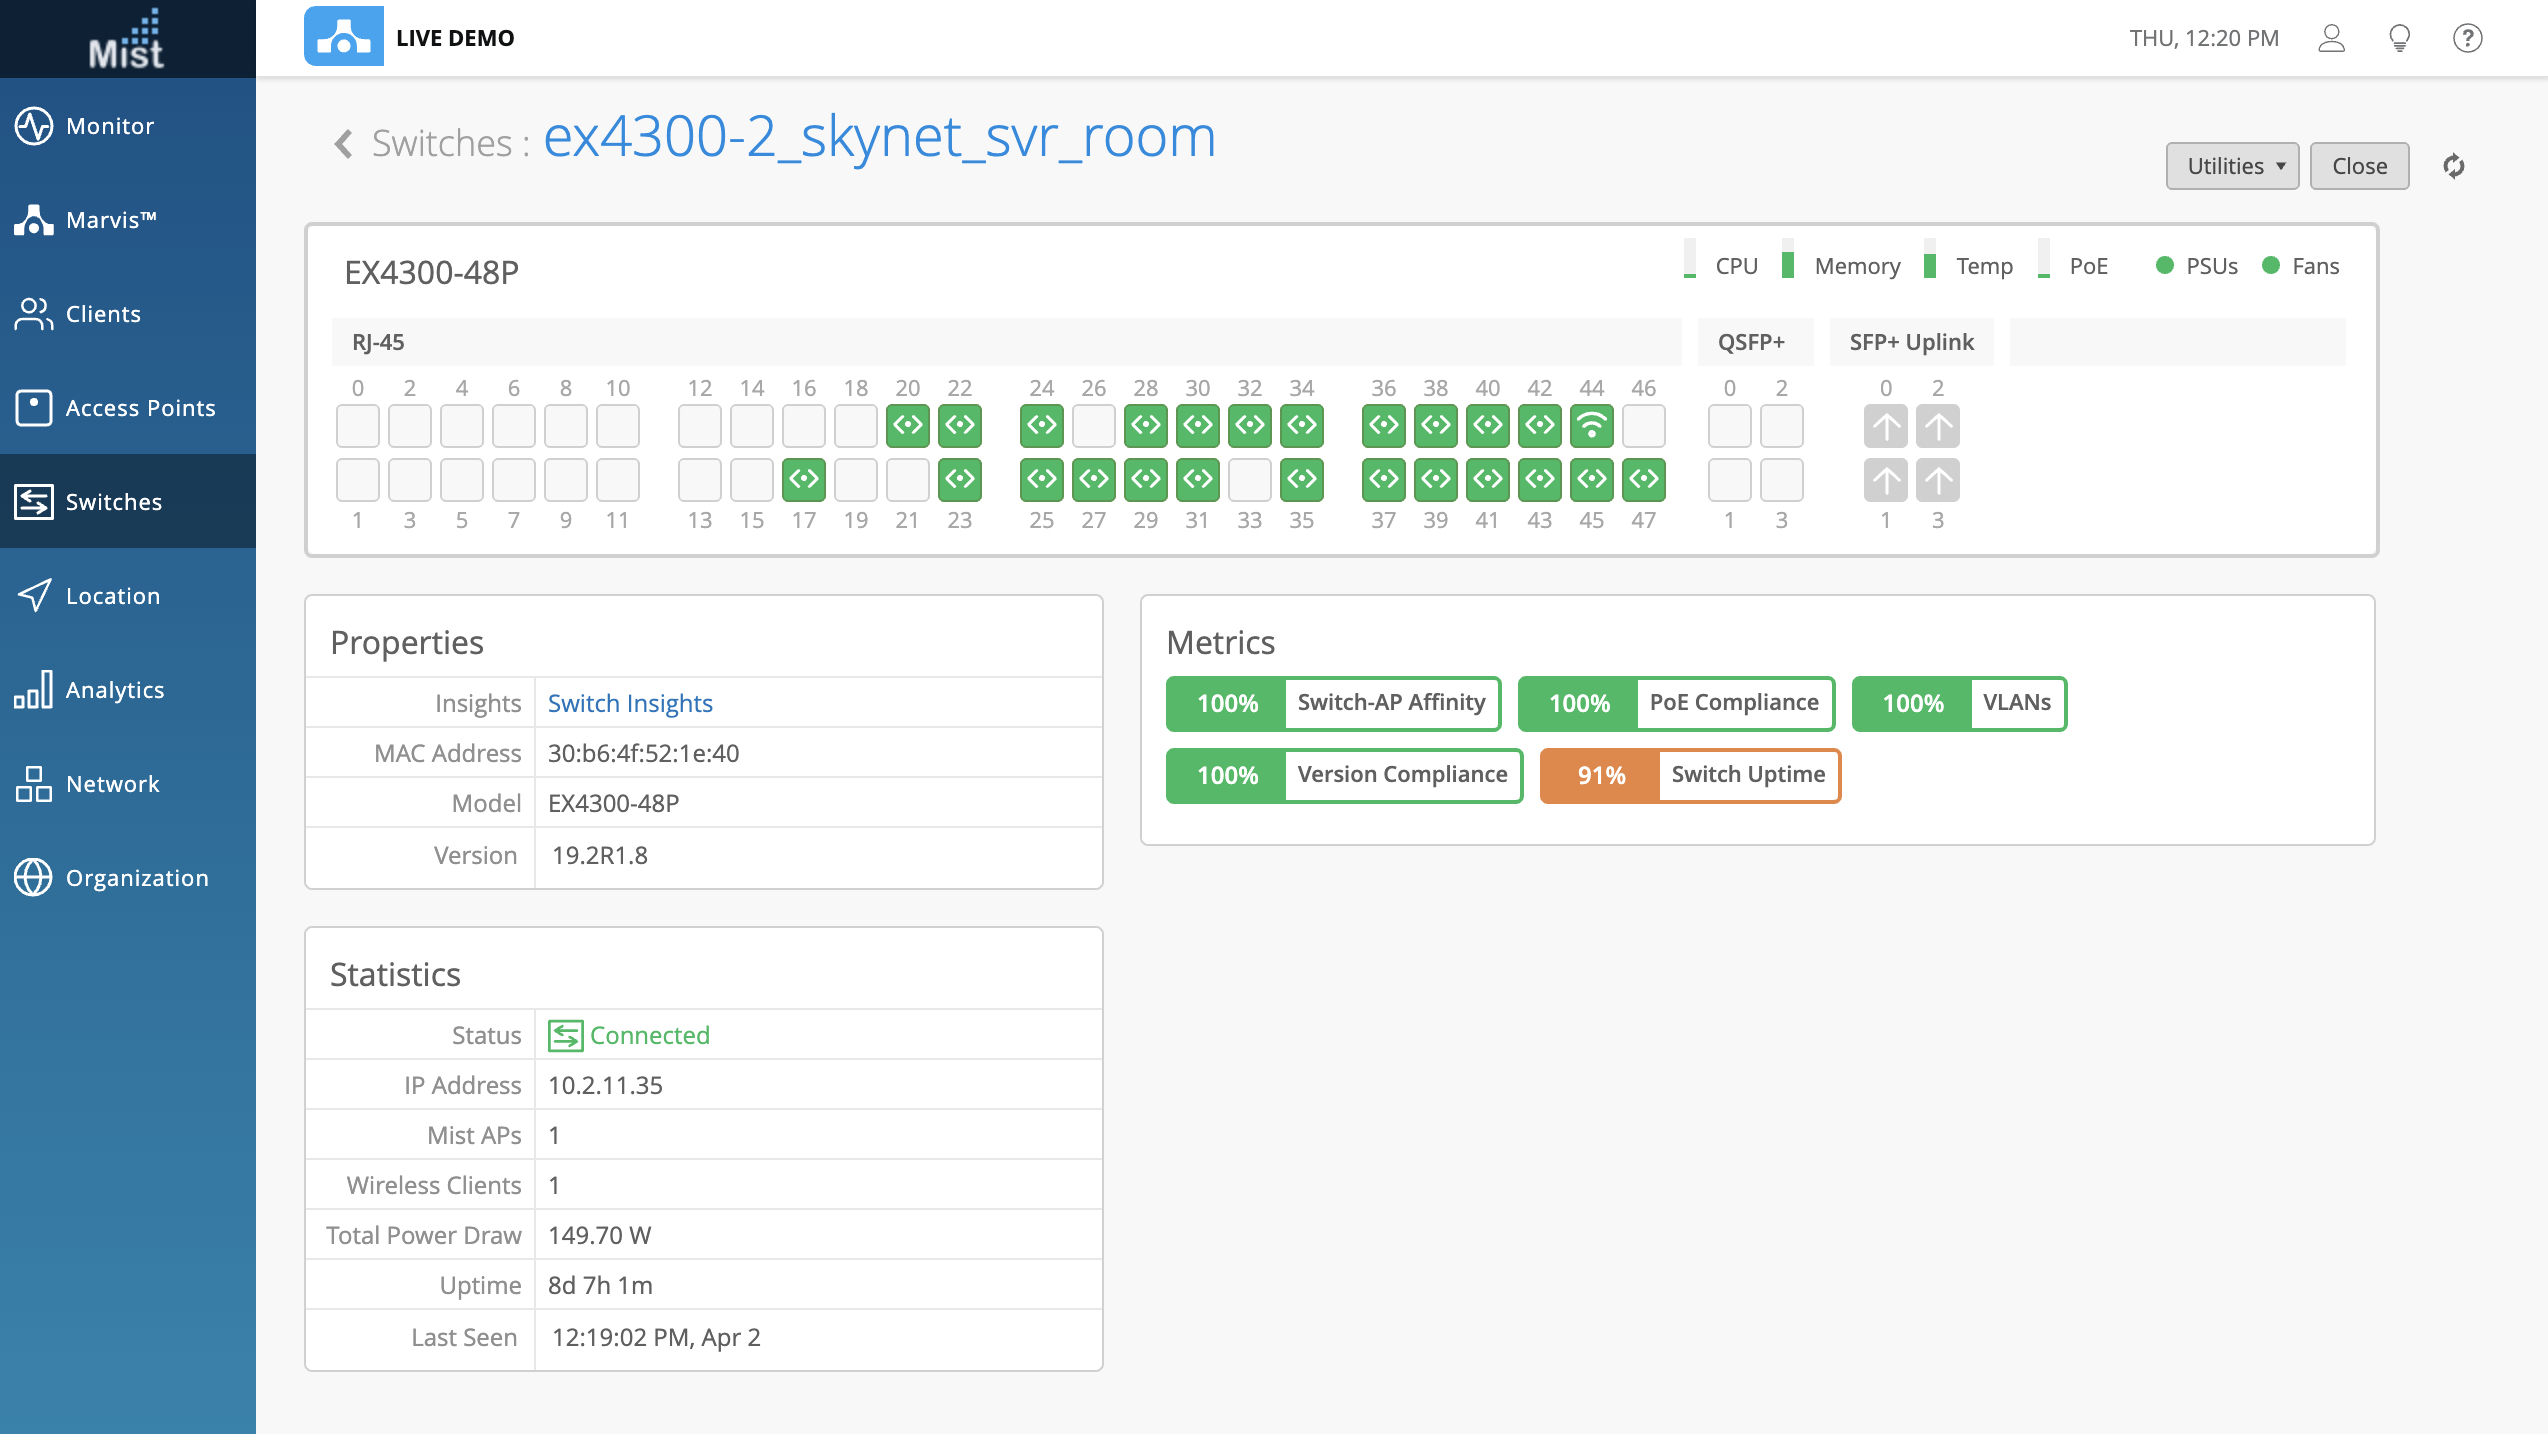
On each of the ports of the switch you will see a symbol and color, which indicate what is connected, and the status of the connected client/AP. Here is the list of different port indicators:
![]()
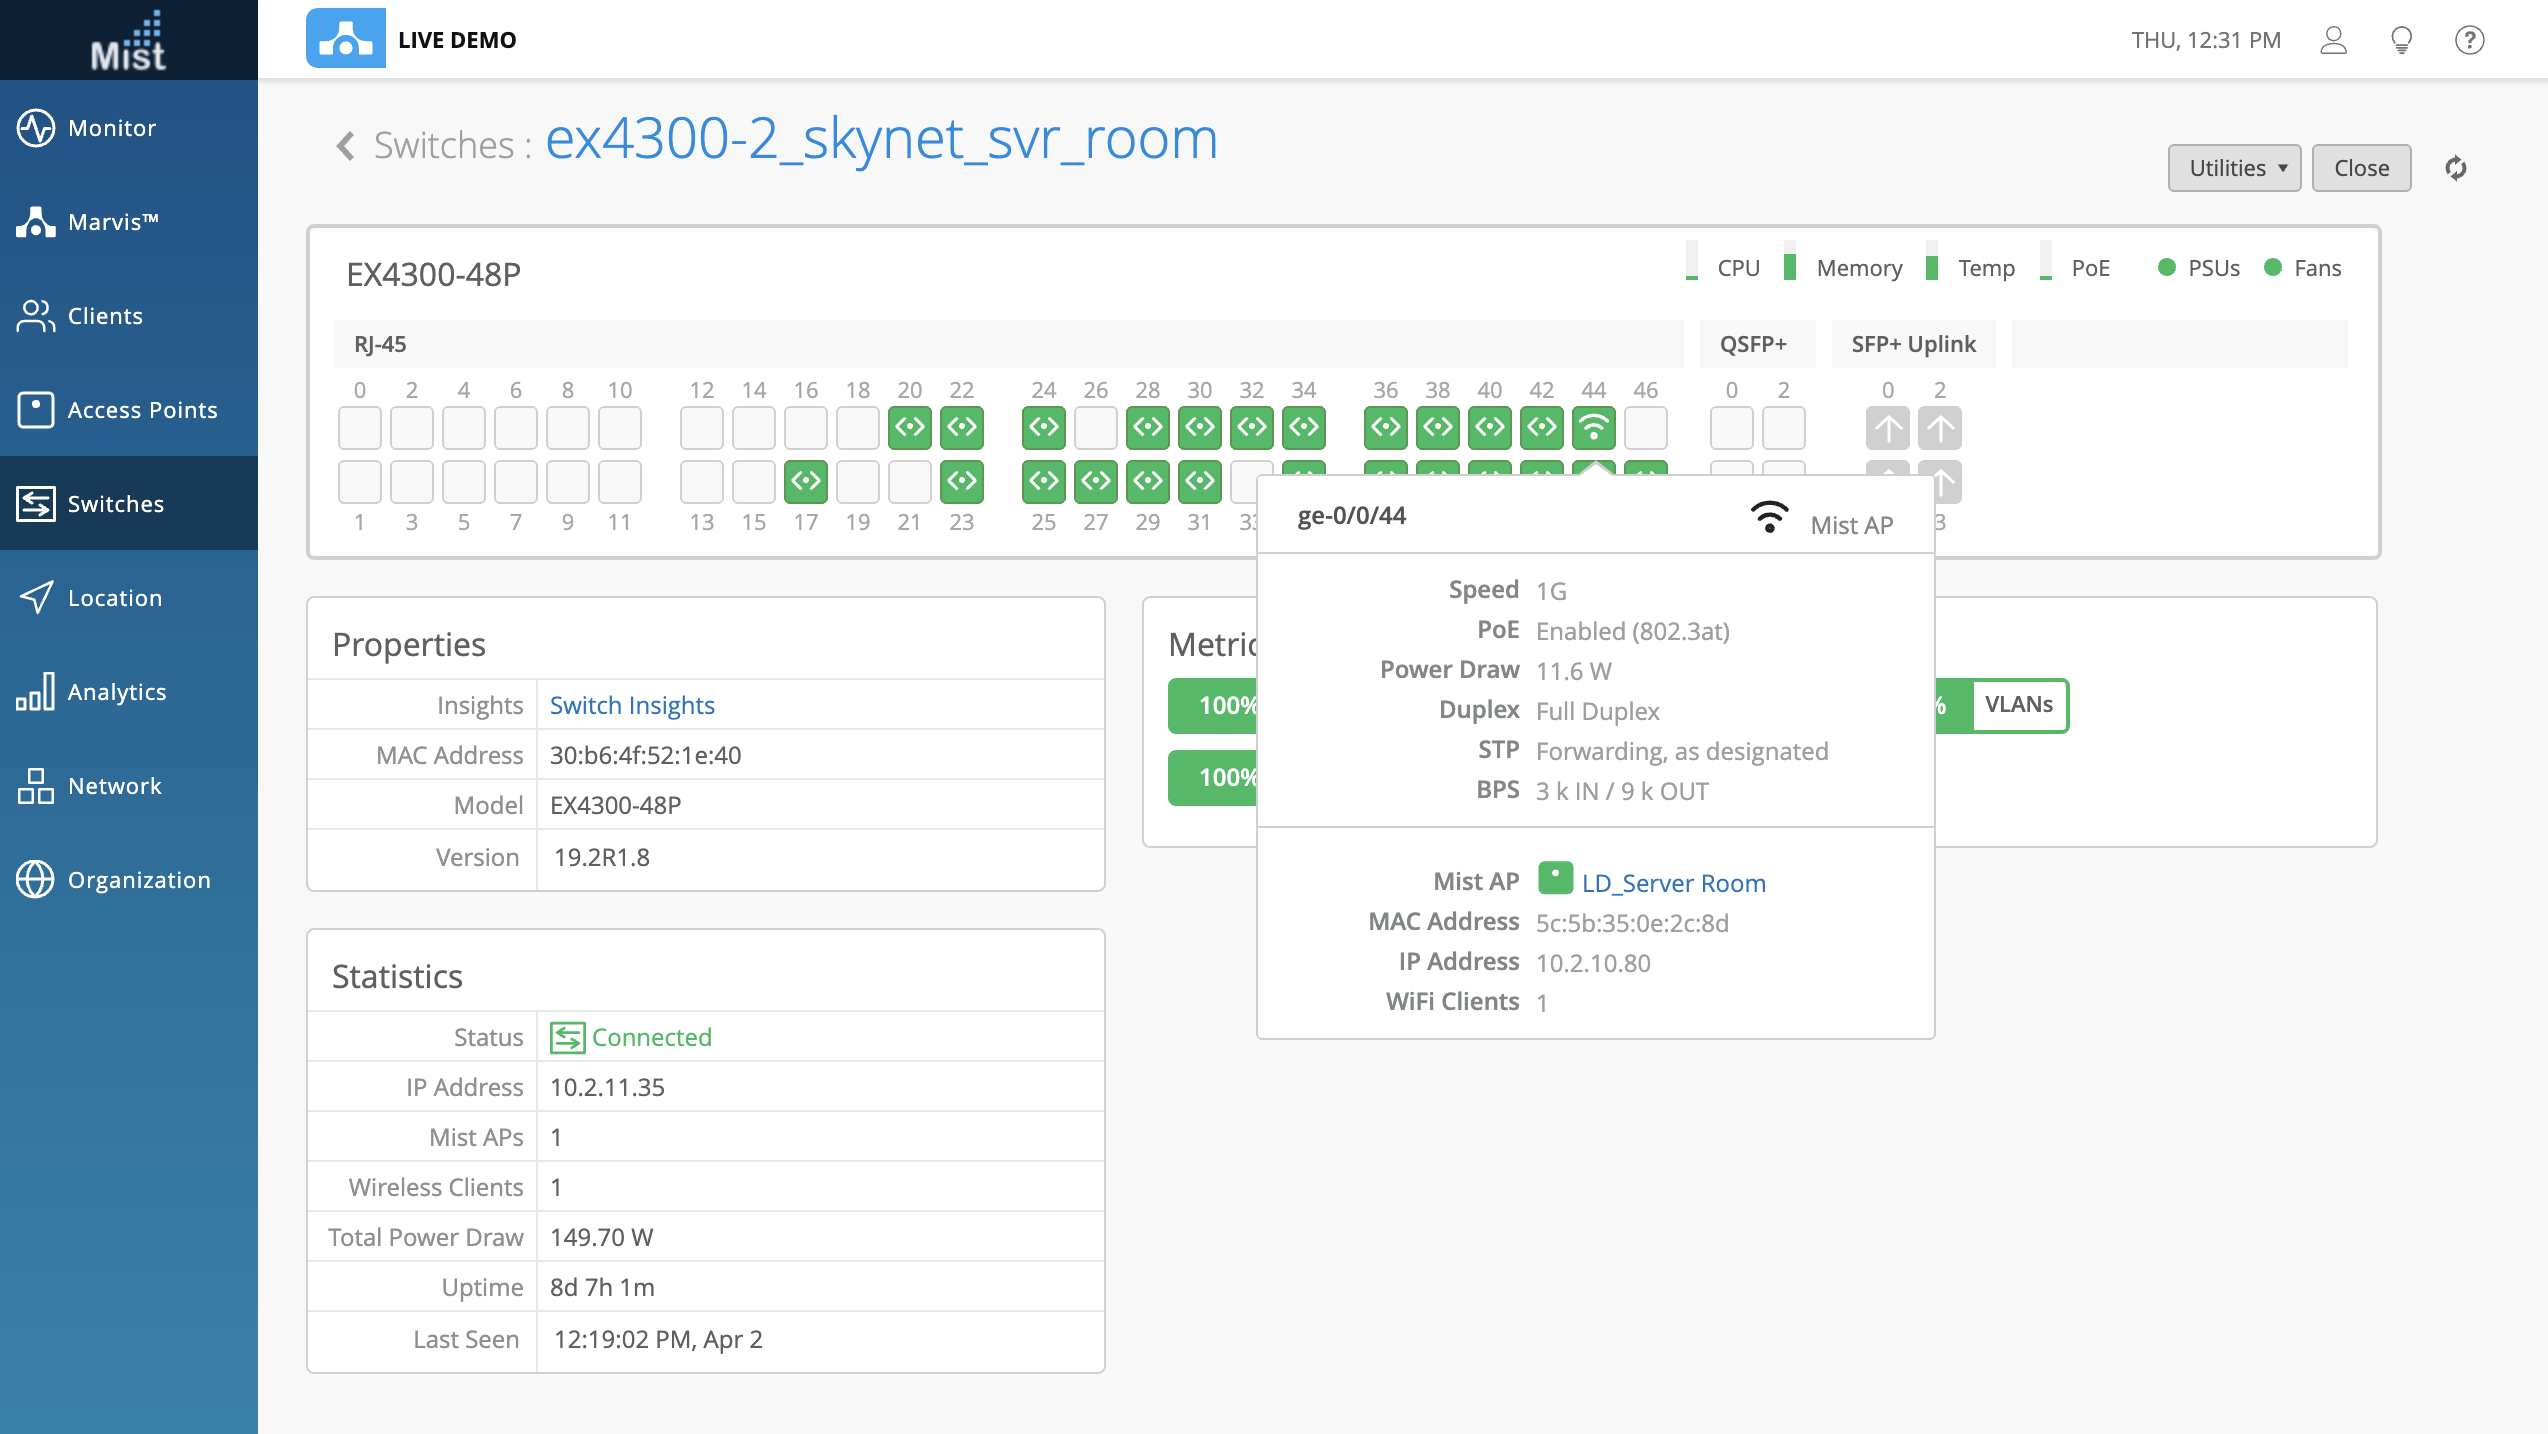
You may hover over the ports to get a more detailed overview of its status. Here, we are hovering over port 44, which indicates that a Mist AP is connected. We can see the full details right from the hover, including information about speed, power, and IP.
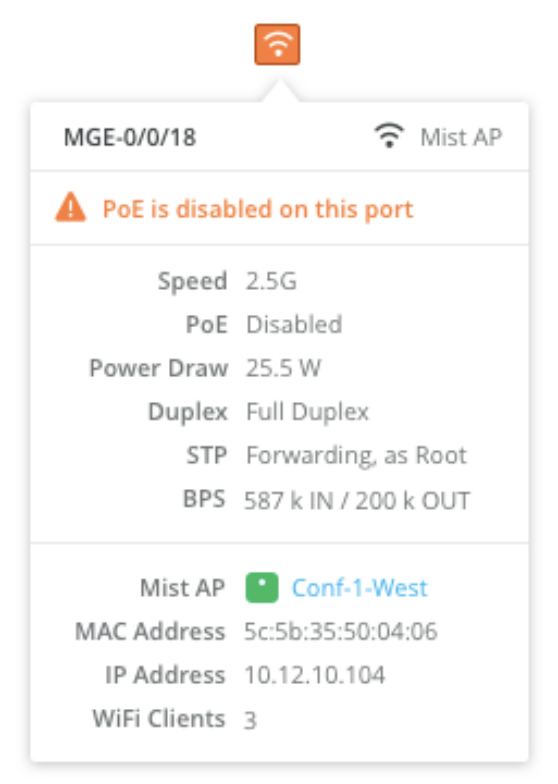
When hovering over a port with active alerts, you will be able to see the exact issue being experienced, as such:
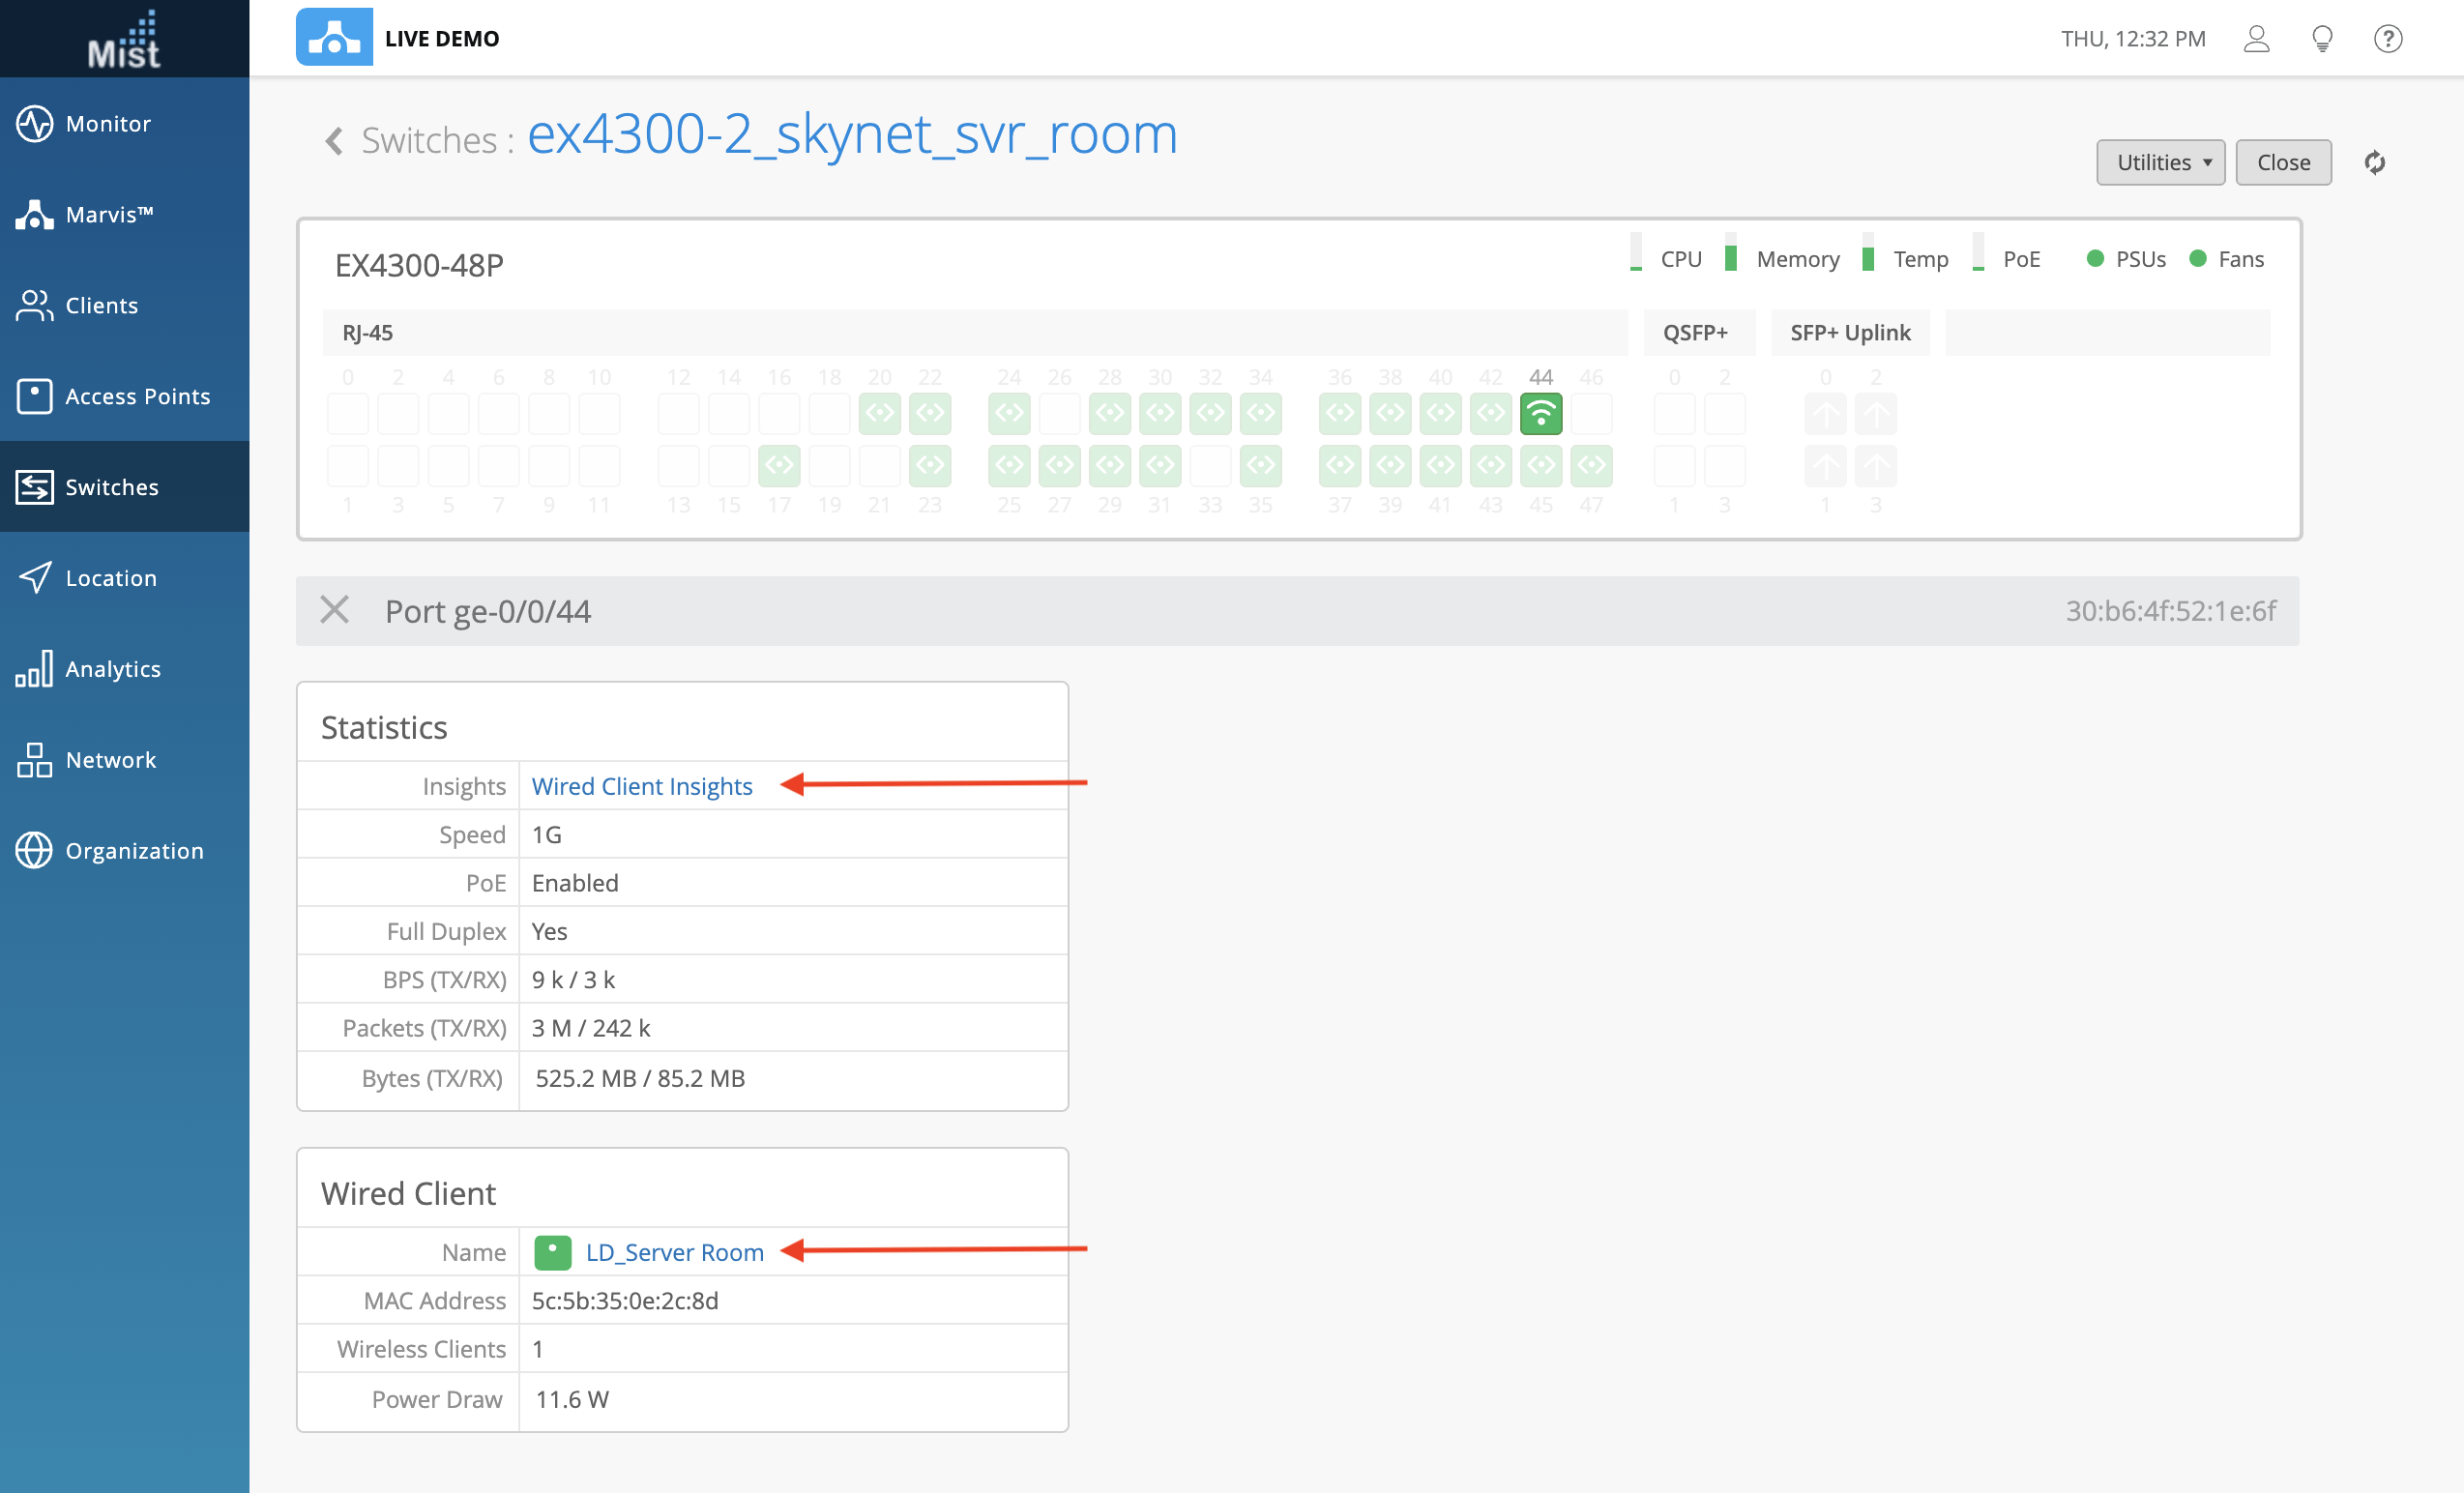
Clicking on the port will highlight the port details directly on this page. From here, you can select Wired Client Insights to go to the Insights page for the AP. Or you click the AP name itself, which will take you to the Access Points Details page of the AP.
In addition to hovering over the ports to get a more detailed view, you can also hover over the usage indicators of the switch to get the same. Simply hover over any of the elements on the top right of the switch to see more exact metrics on the usage. Here, we can see the temperatures of individual components inside the switch which contribute to the total Temp indicator:
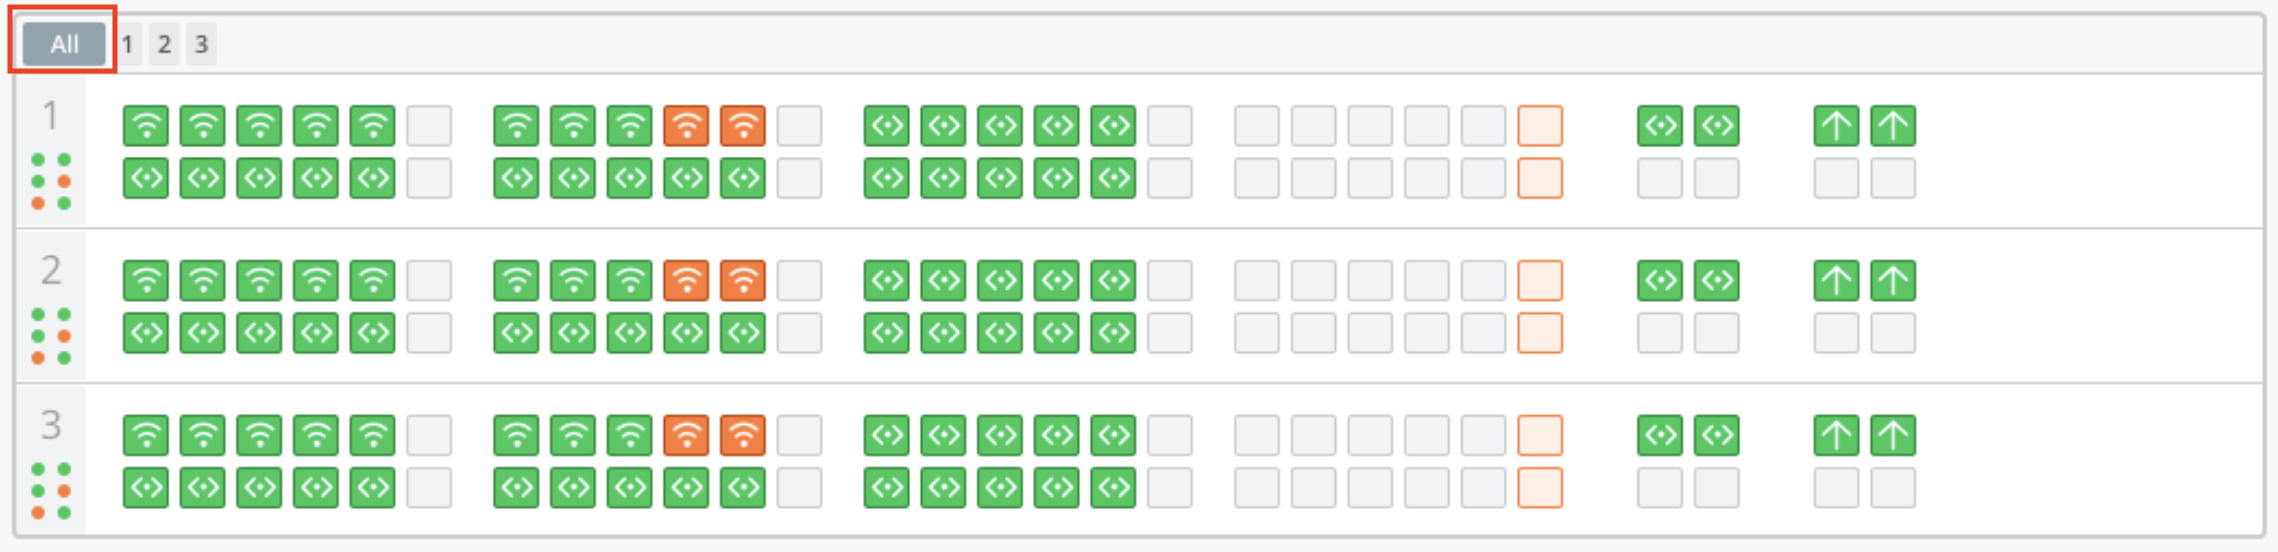
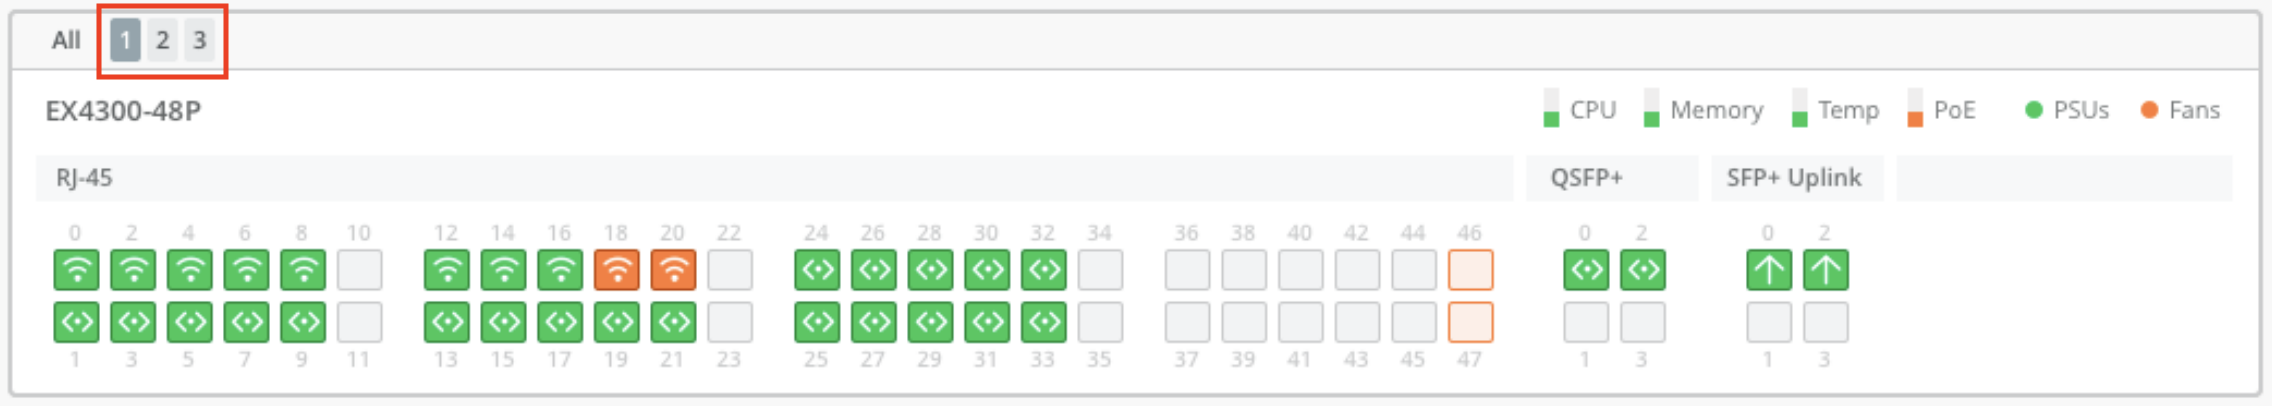
When multiple switches are configured as a virtual chassis, they may be displayed in two different ways. Just select either All or click on the number to indicate which switch to look at.
All at once:
Individually:
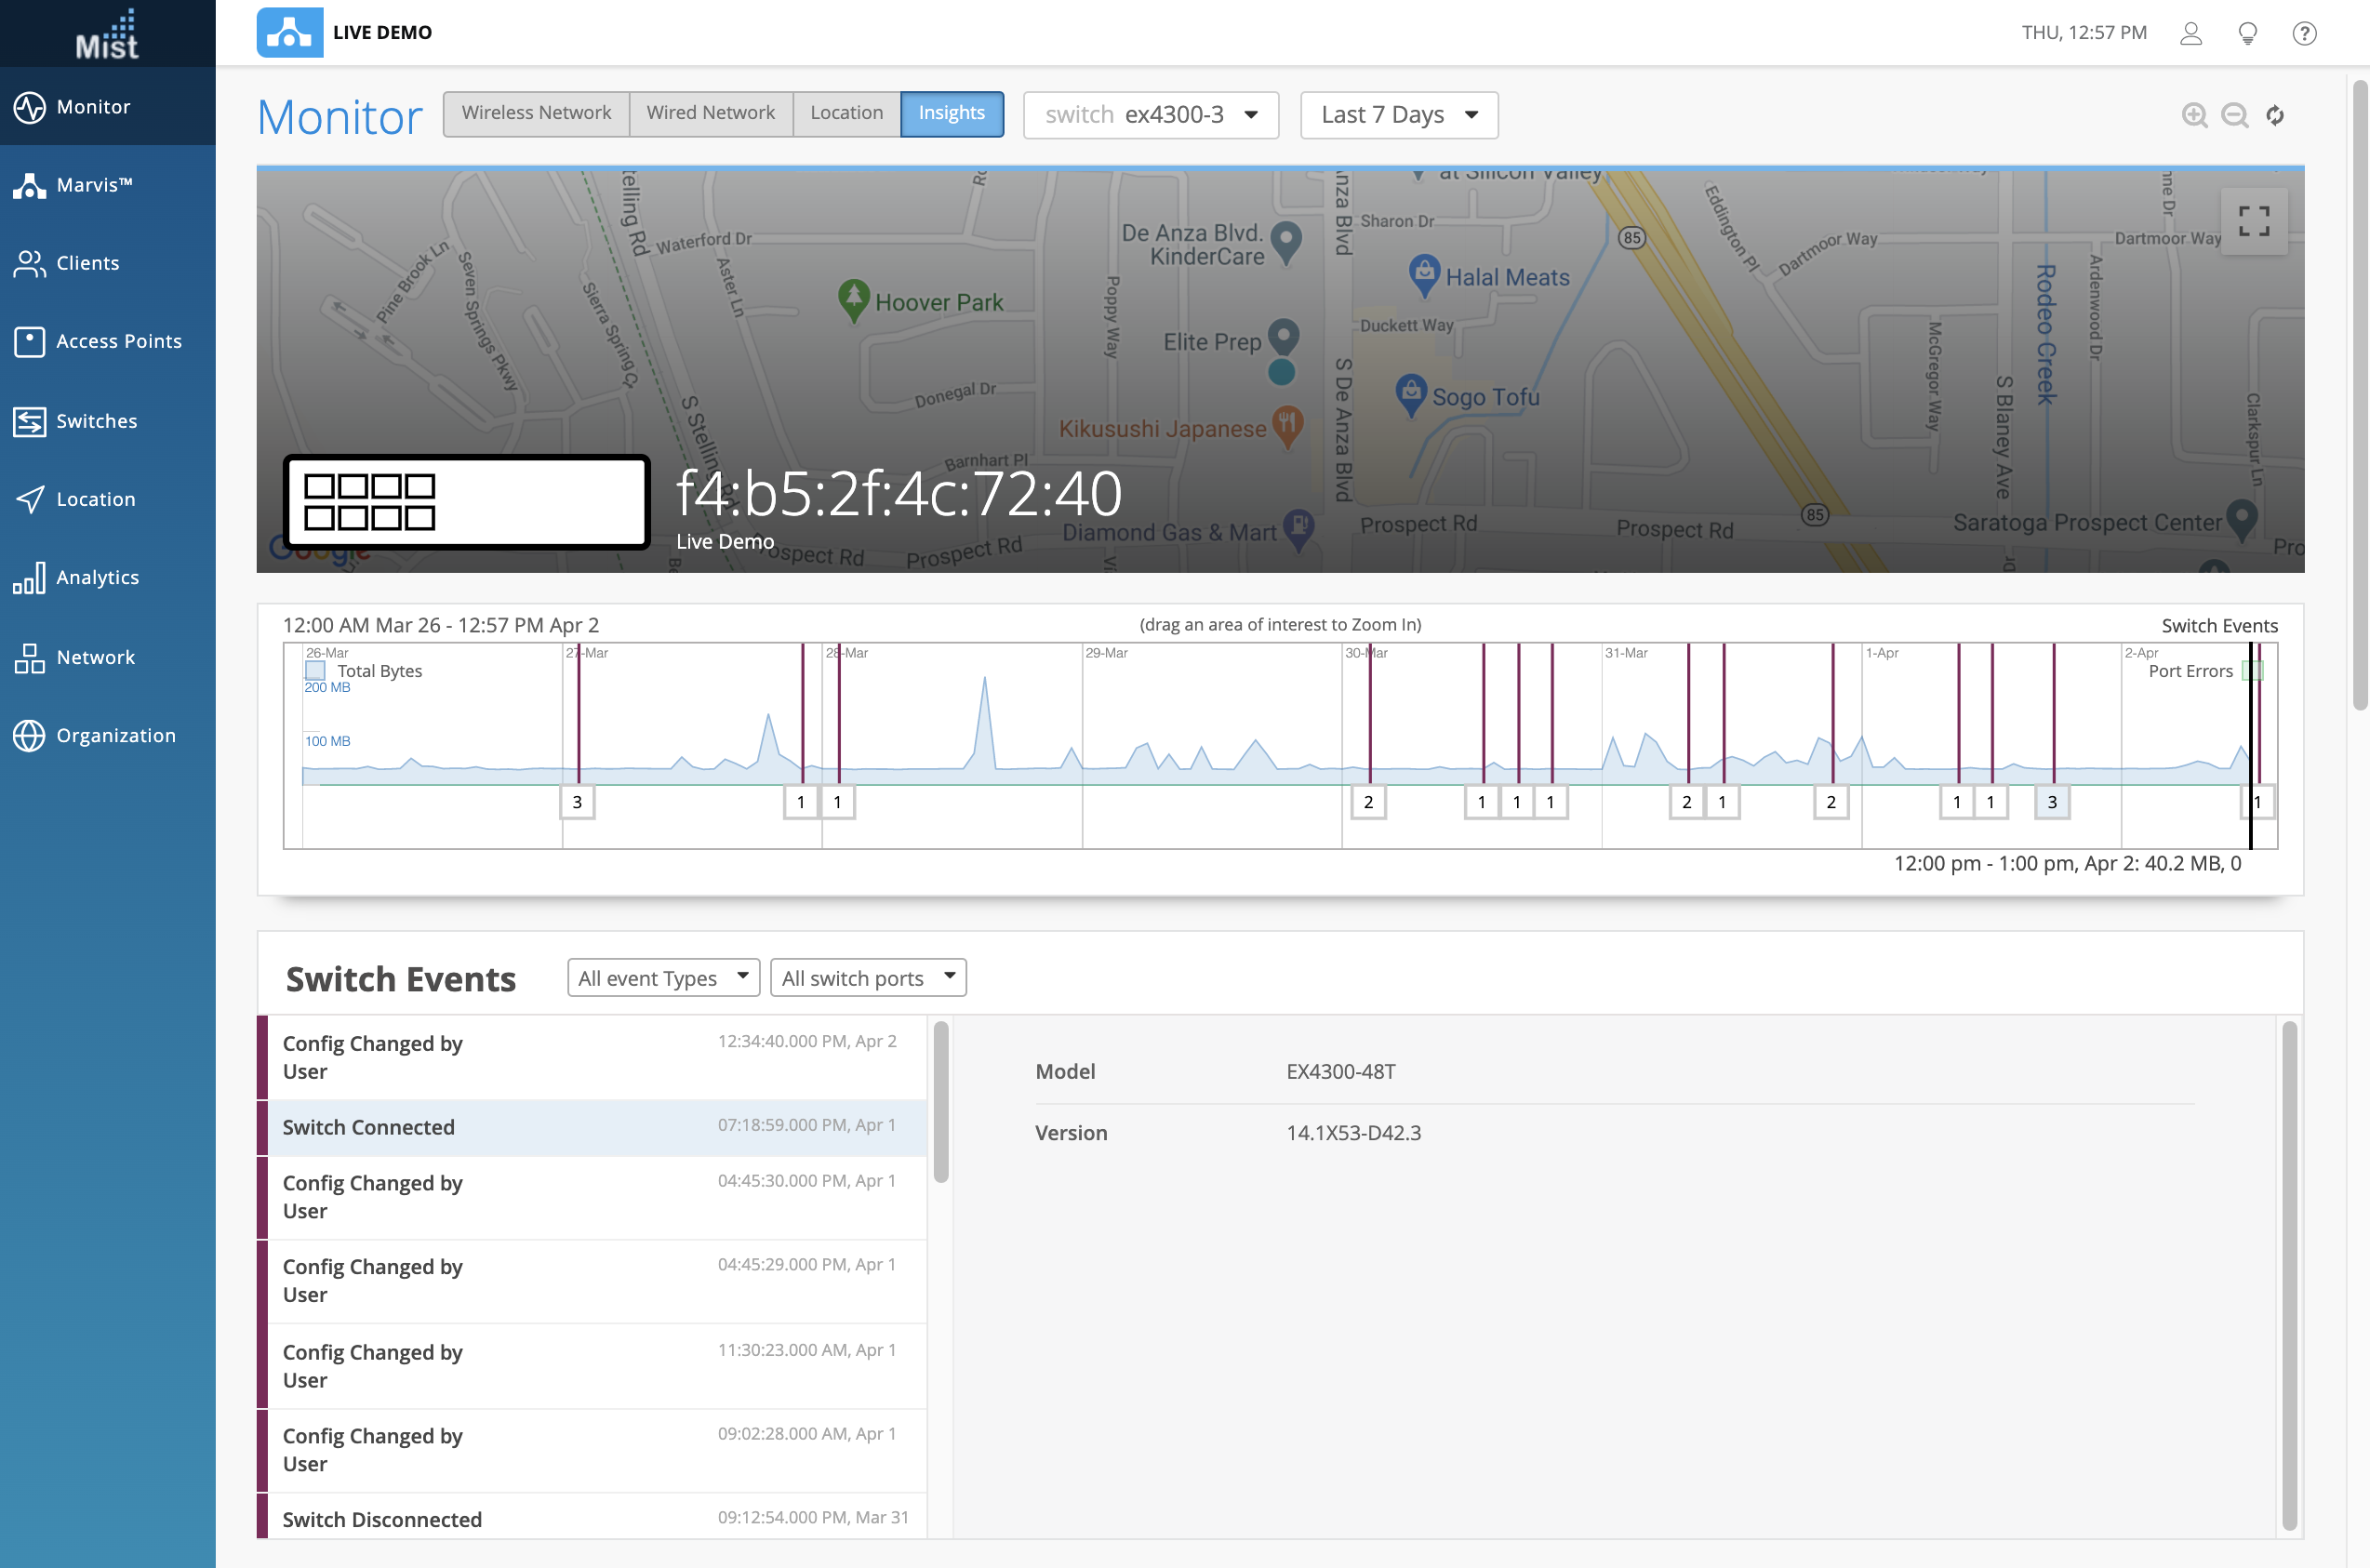
To further help with exposing more information on the wired side of your network, we are proud to introduce Switch Events! These are like our Site, AP, and Client events and can be viewed from the Insights Page of your switch. In Switch events, you can filter based on Event Types as well as events taking place on a specified port:
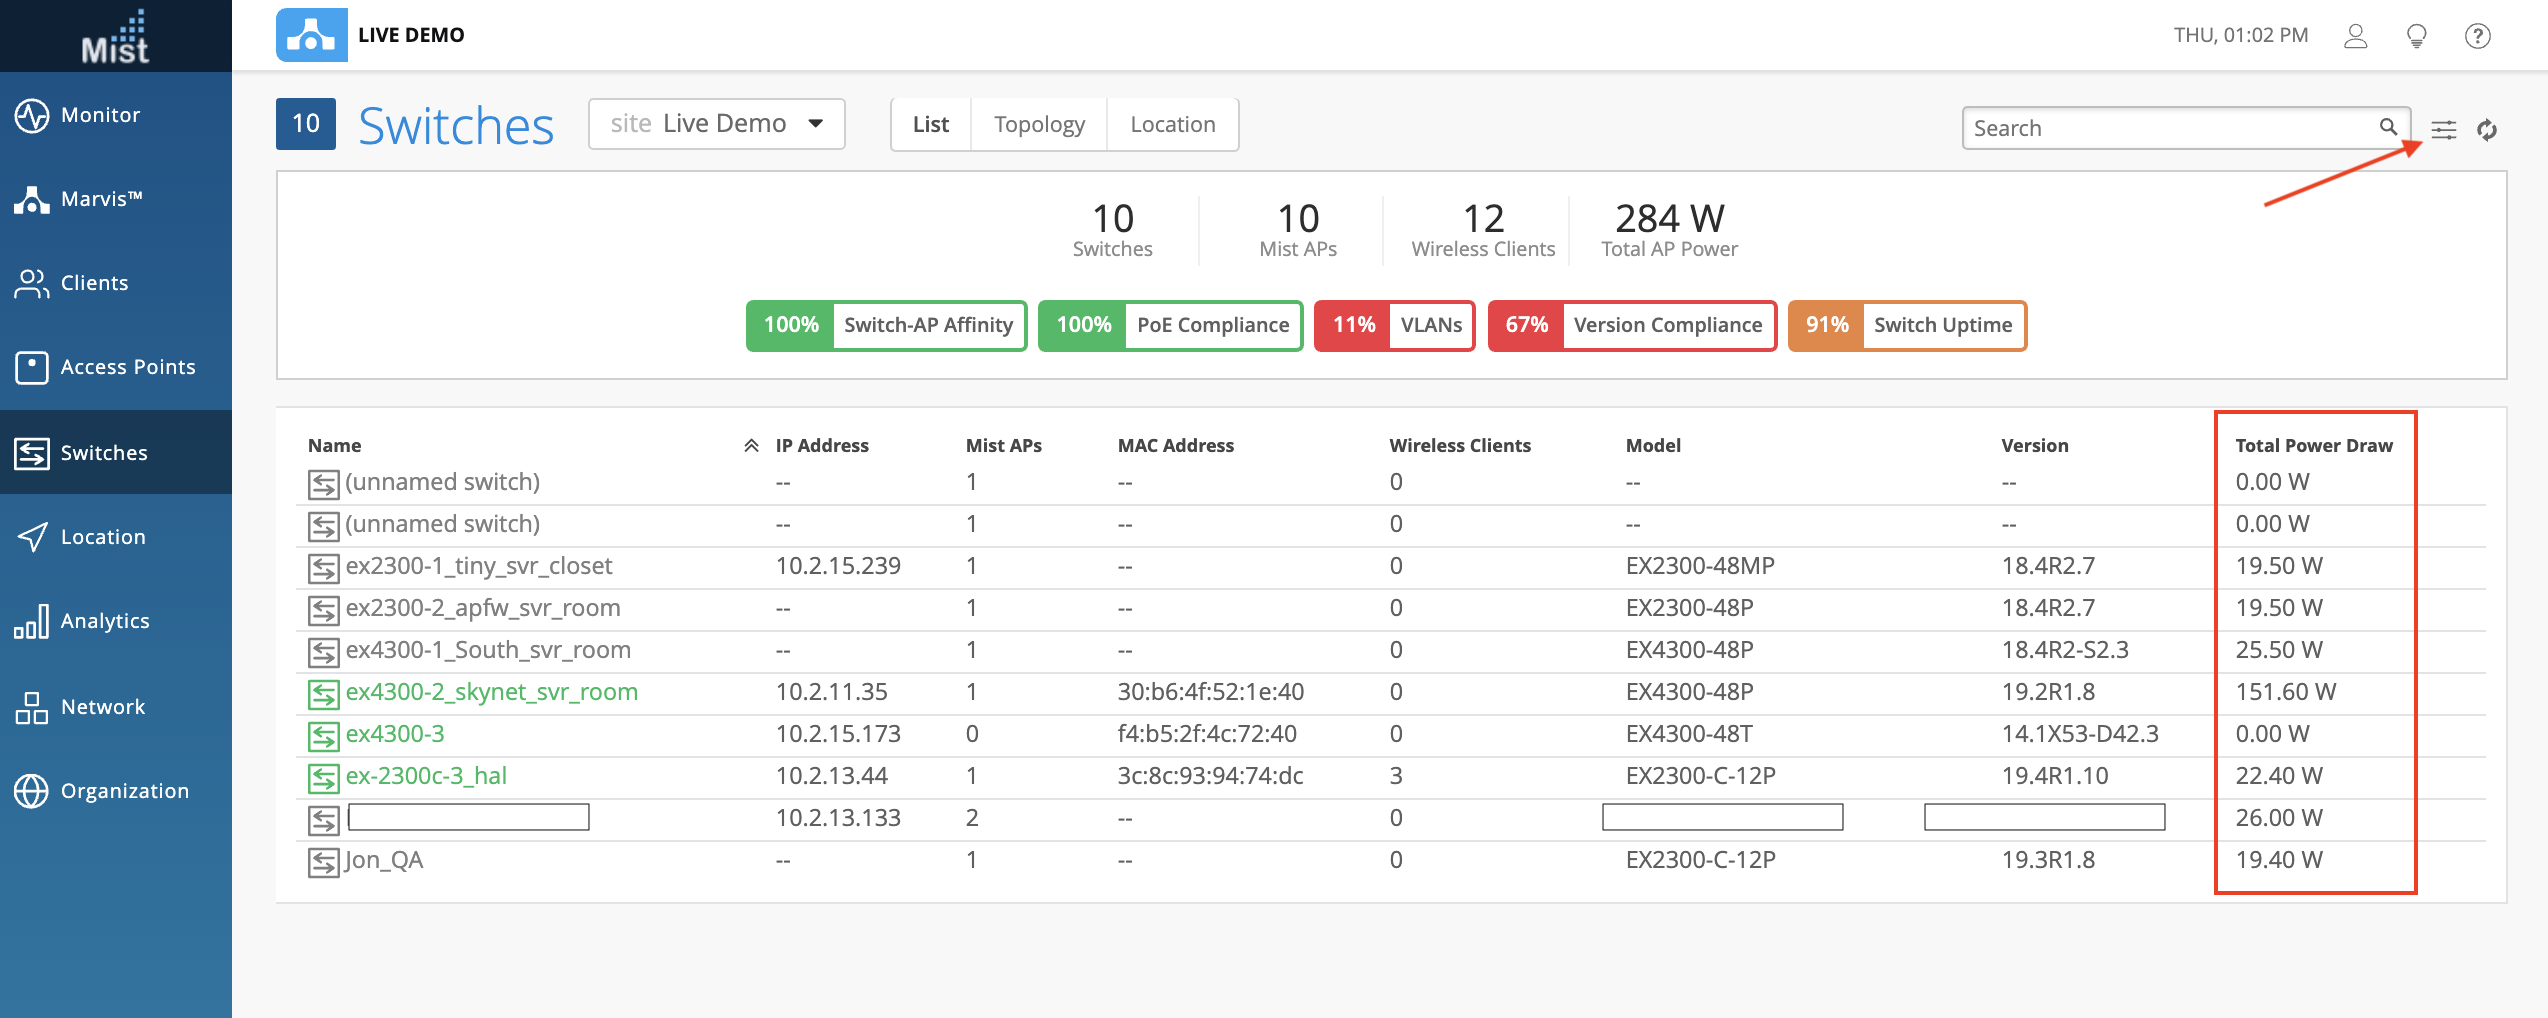
We have added a new column on the Switch list view to display Total Power Draw. Make sure you have this column enabled by selecting the check box in the display menu. This view is available for all switches, not just those compatible with adoption onto the Mist Dashboard.
Here are the Juniper switch models currently compatible with adoption onto the Mist dashboard:
EX4650-48Y-8C (Newly Added)
EX2300-C-12P
EX2300-48P
EX2300-24P
EX3400-48P
EX4300-48P
EX4300-48T
EX4600-40F
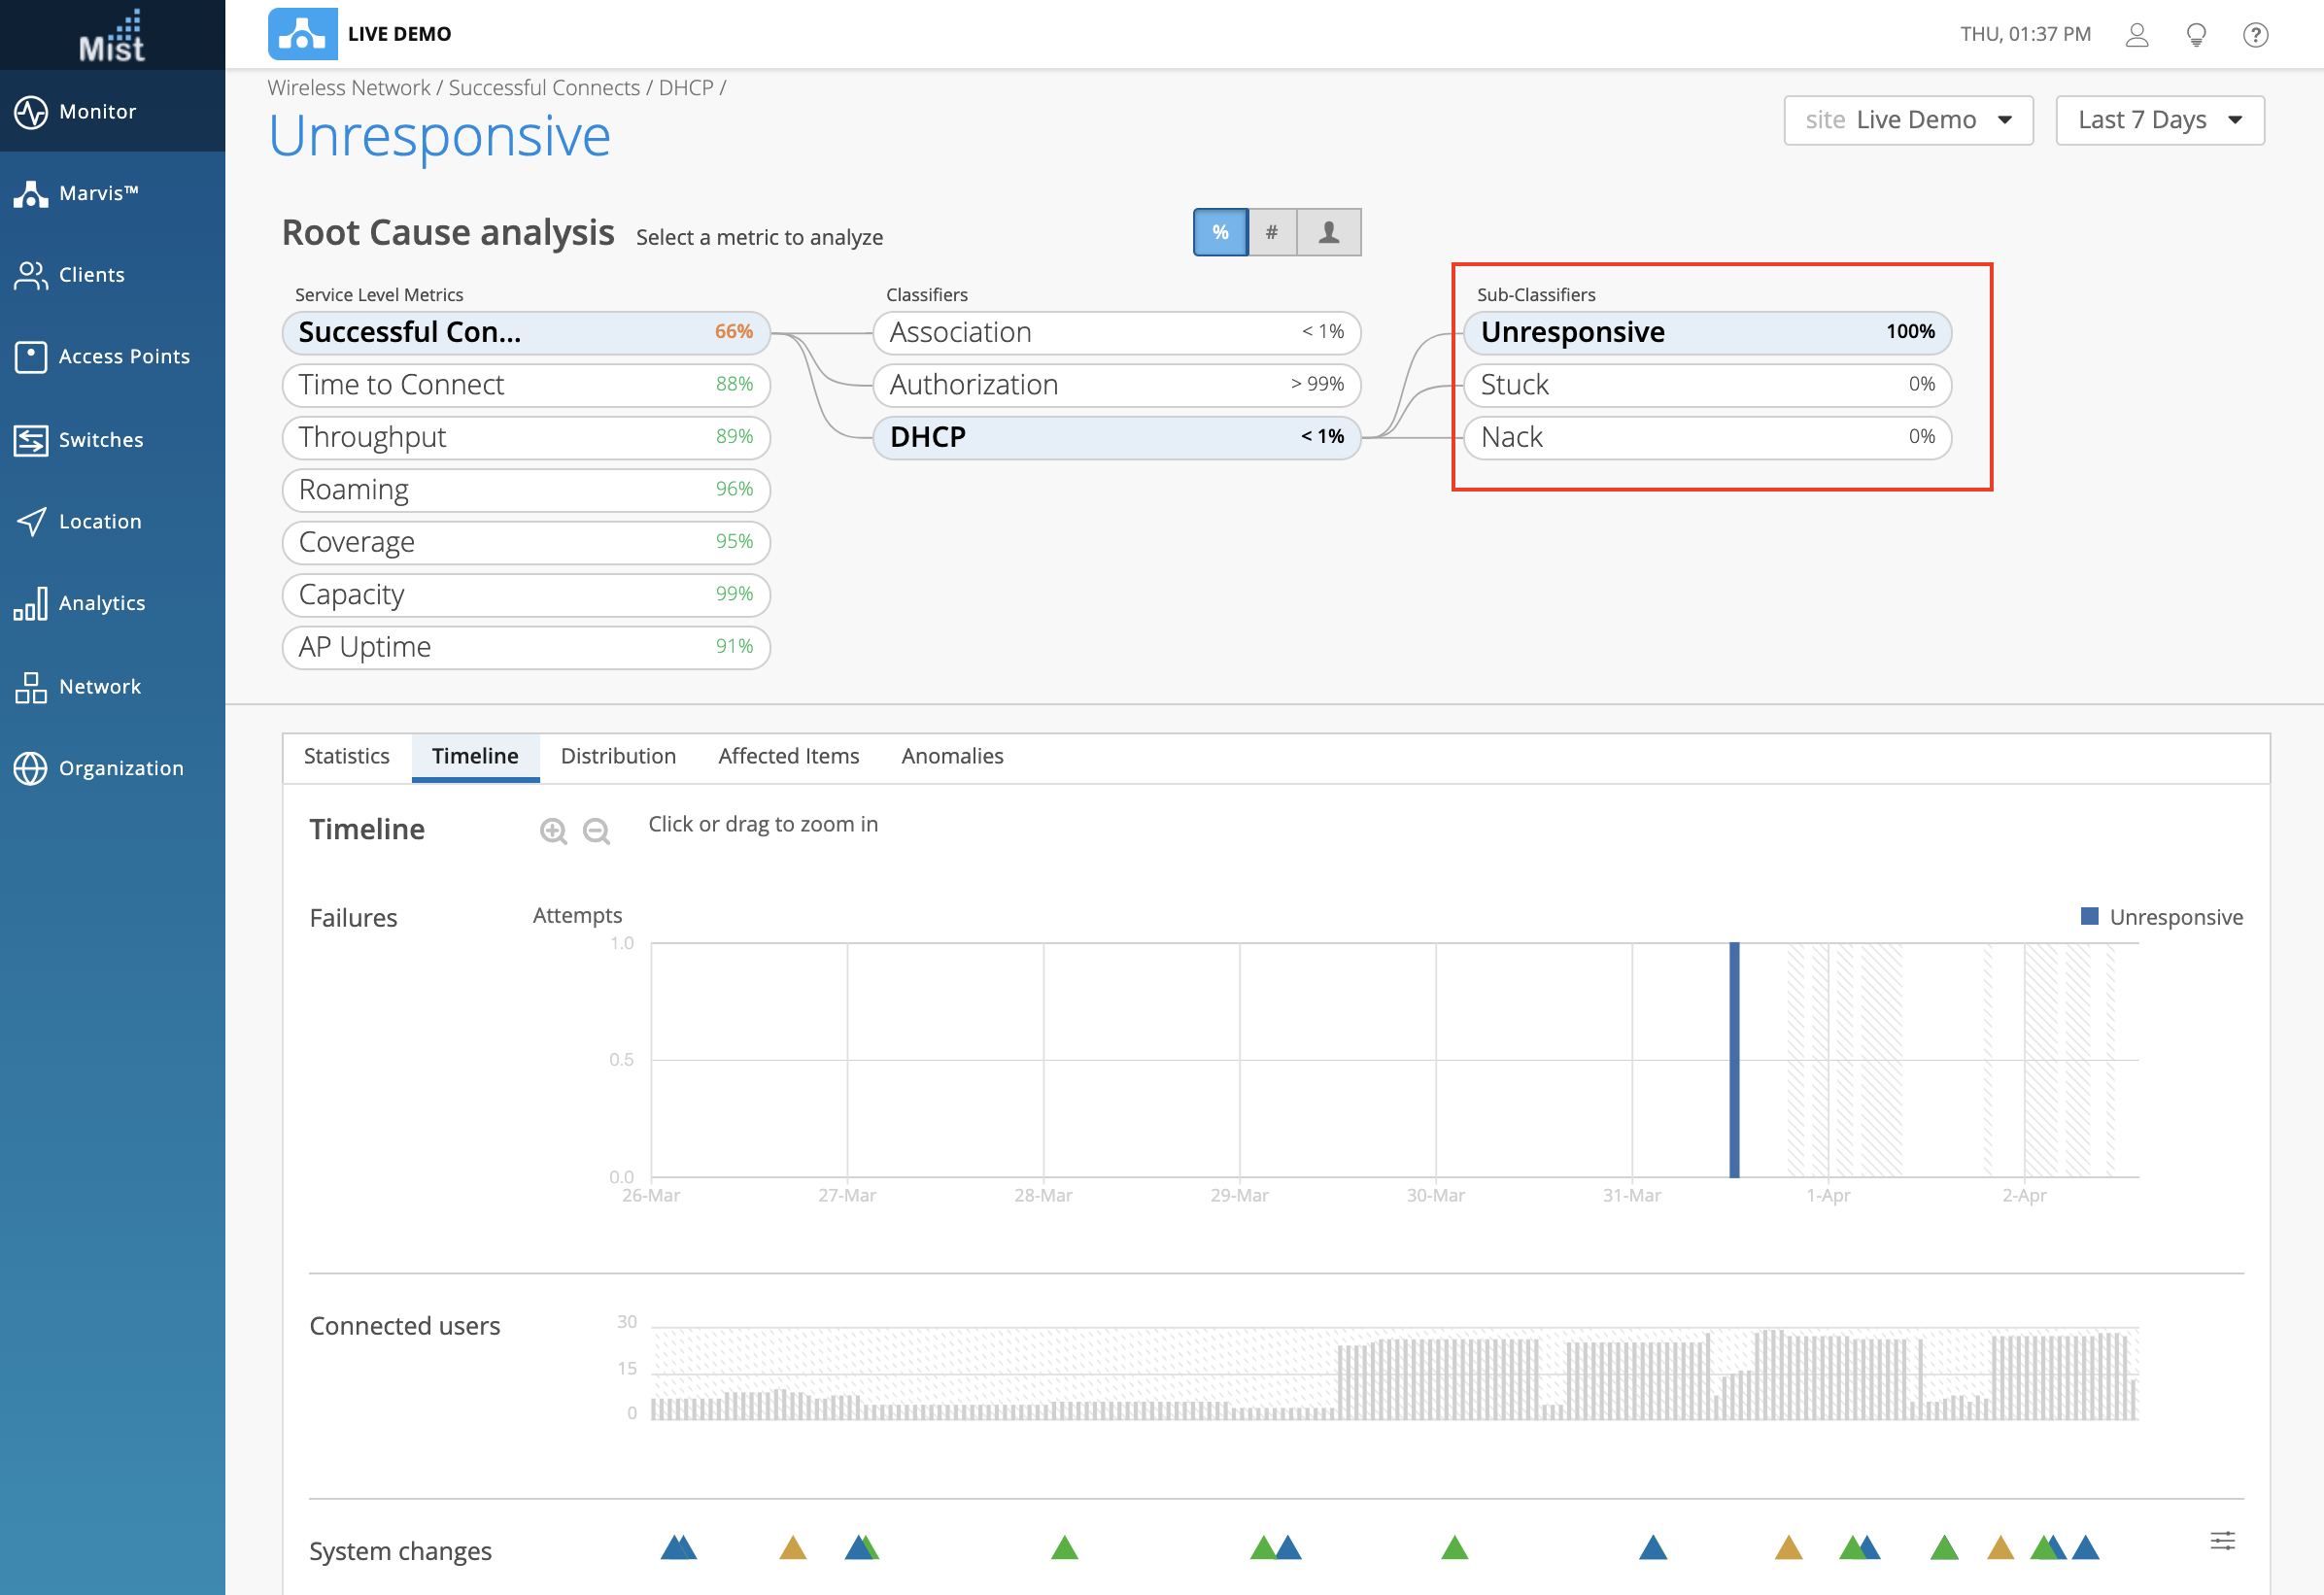
This week we improved on our Successful Connects and Time to Connect Wireless SLEs by including an expanded view of the DHCP Classifier to include Sub-Classifier views. These Sub-Classifiers are: DHCP Stuck, DHCP Unresponsive, and DHCP Nack. Hover over each Sub-Classifier to see the details on the number of users impacted. With these Sub-Classifiers you now have even more granularity when giving you the reason for DHCP errors.
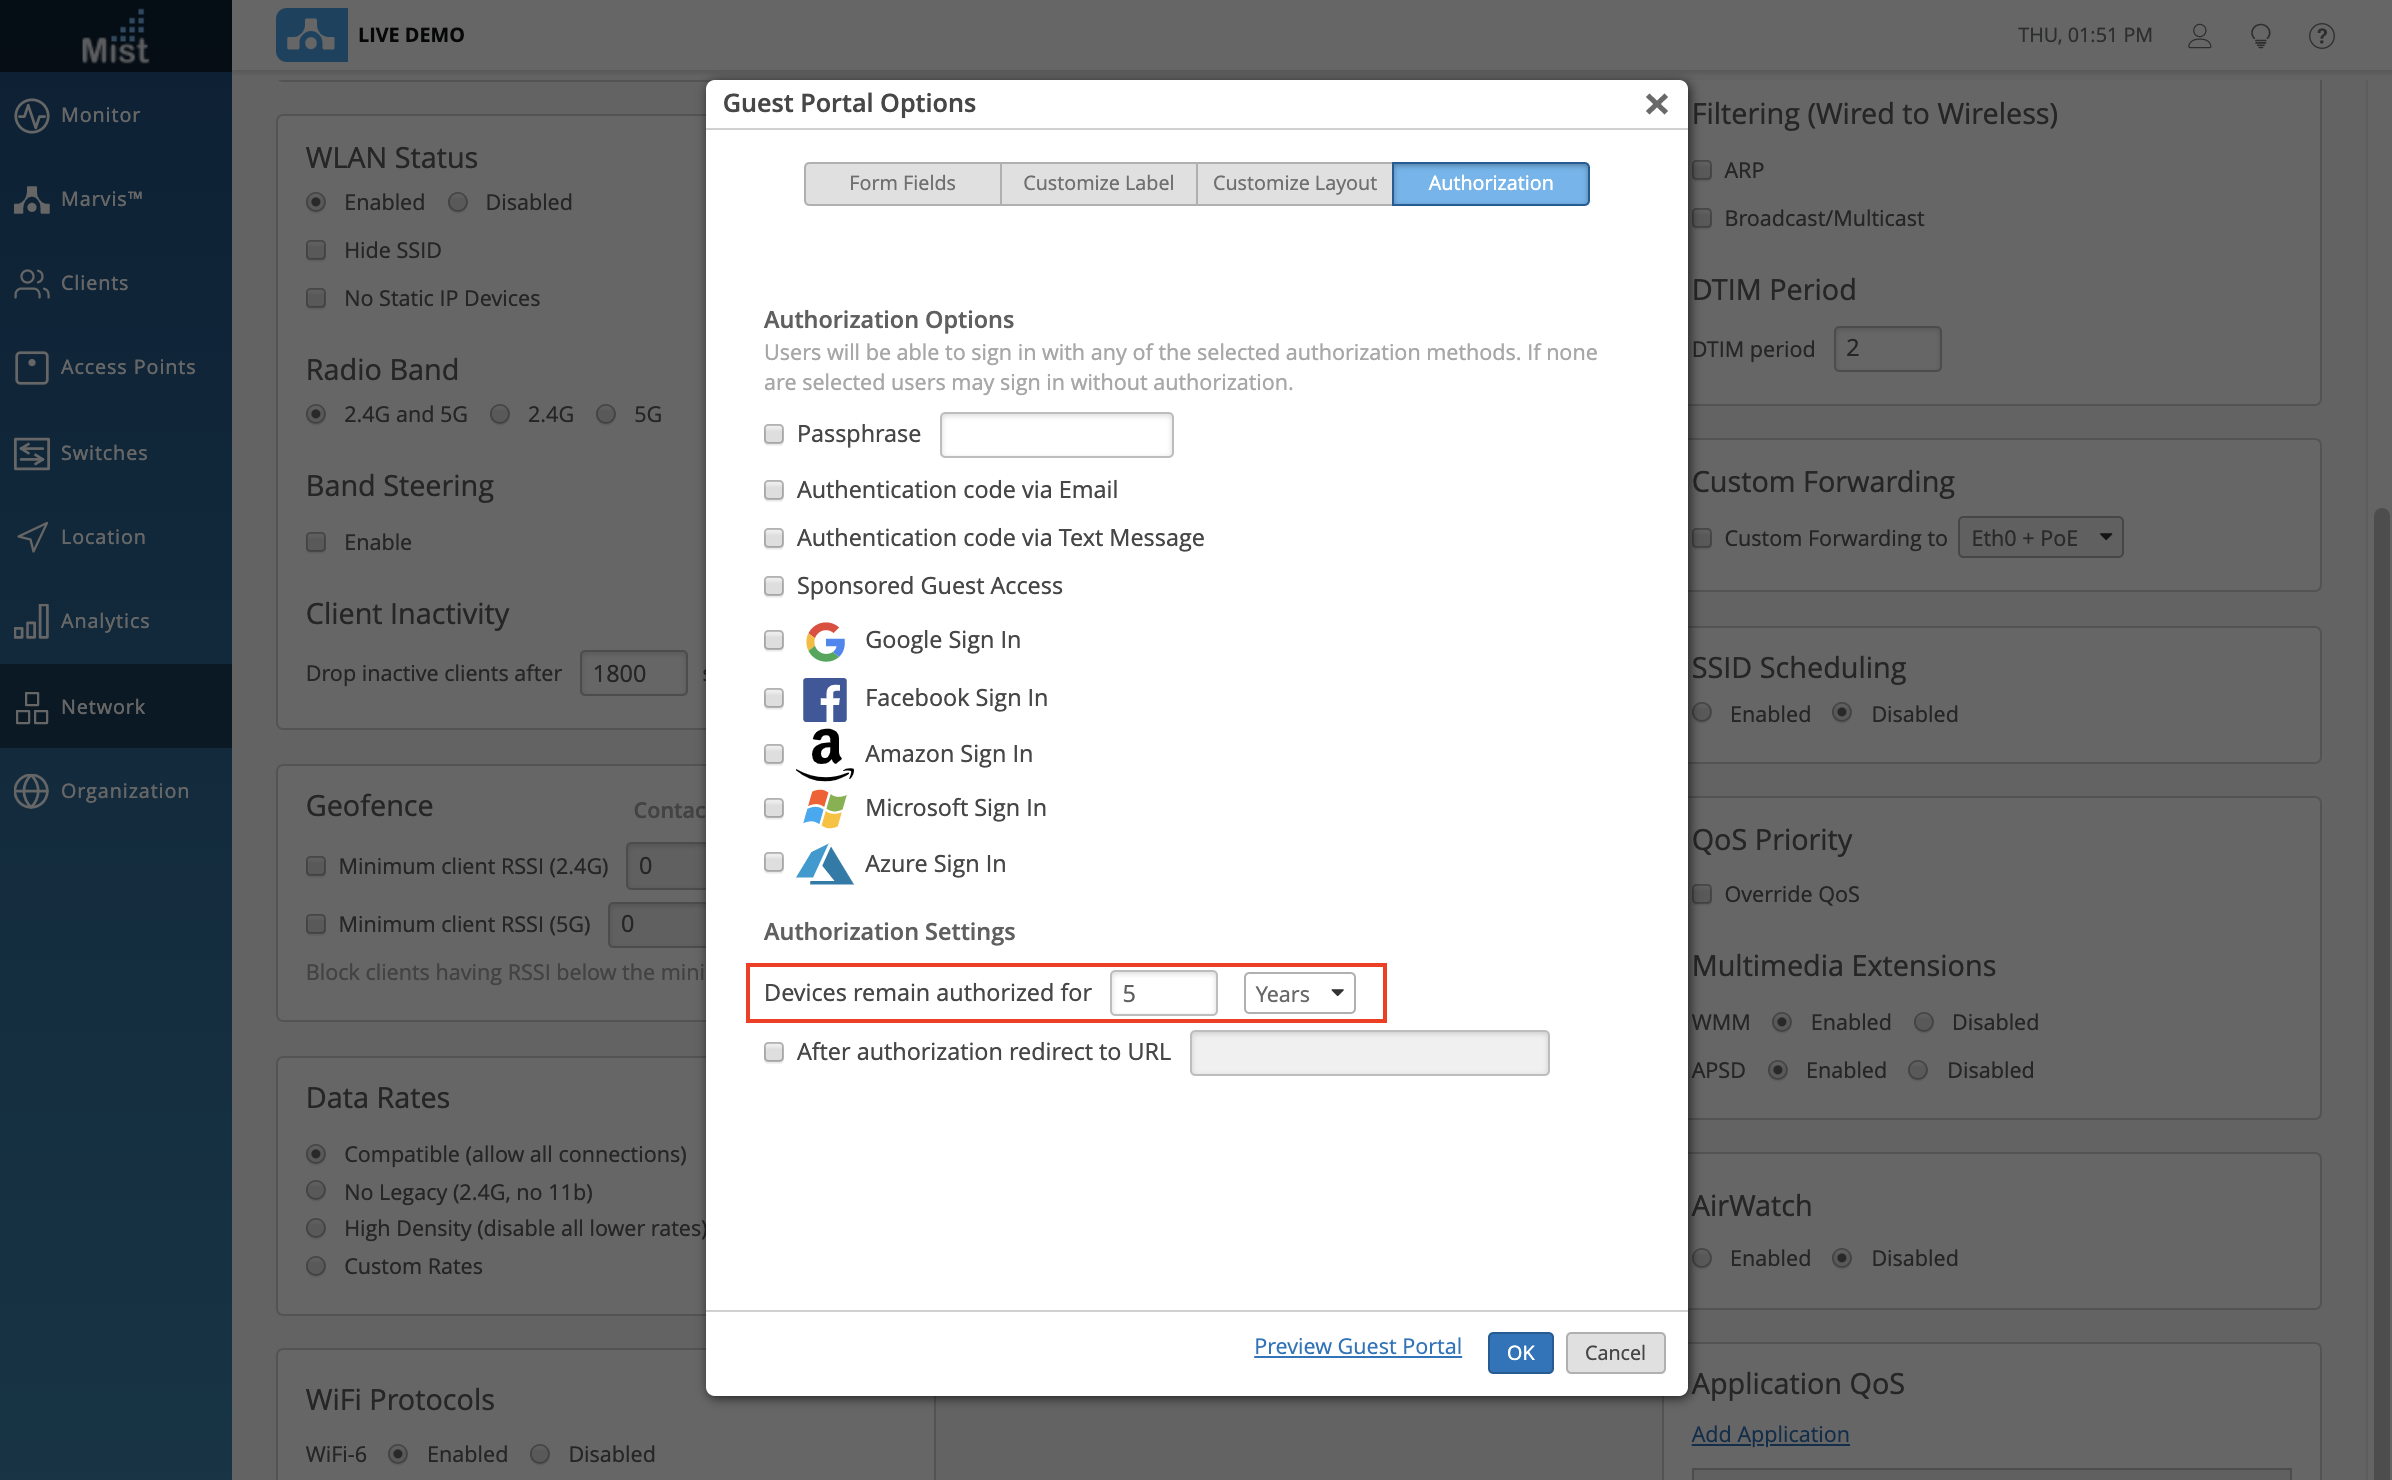
We are glad to announce that you may now configure your guest portal WLANs to allow guest authorization for up to a maximum for 5 years. Previously this was a function available in the API only, but this week we have enabled it on the UI as well. When configuring a guest WLAN, you may modify the Authorization Settings to allow devices to remain authorized for up to 5 years.
Check our documentation section to learn more about Guest Auth: https://www.juniper.net/documentation/us/en/software/mist/mist-wireless/topics/concept/guest-access.html
We have increased the character limit when naming an SSO Role to support names of up to 64 characters. To create a role, navigate to Organization > Settings and select Create Role in the Single Sign-on section.
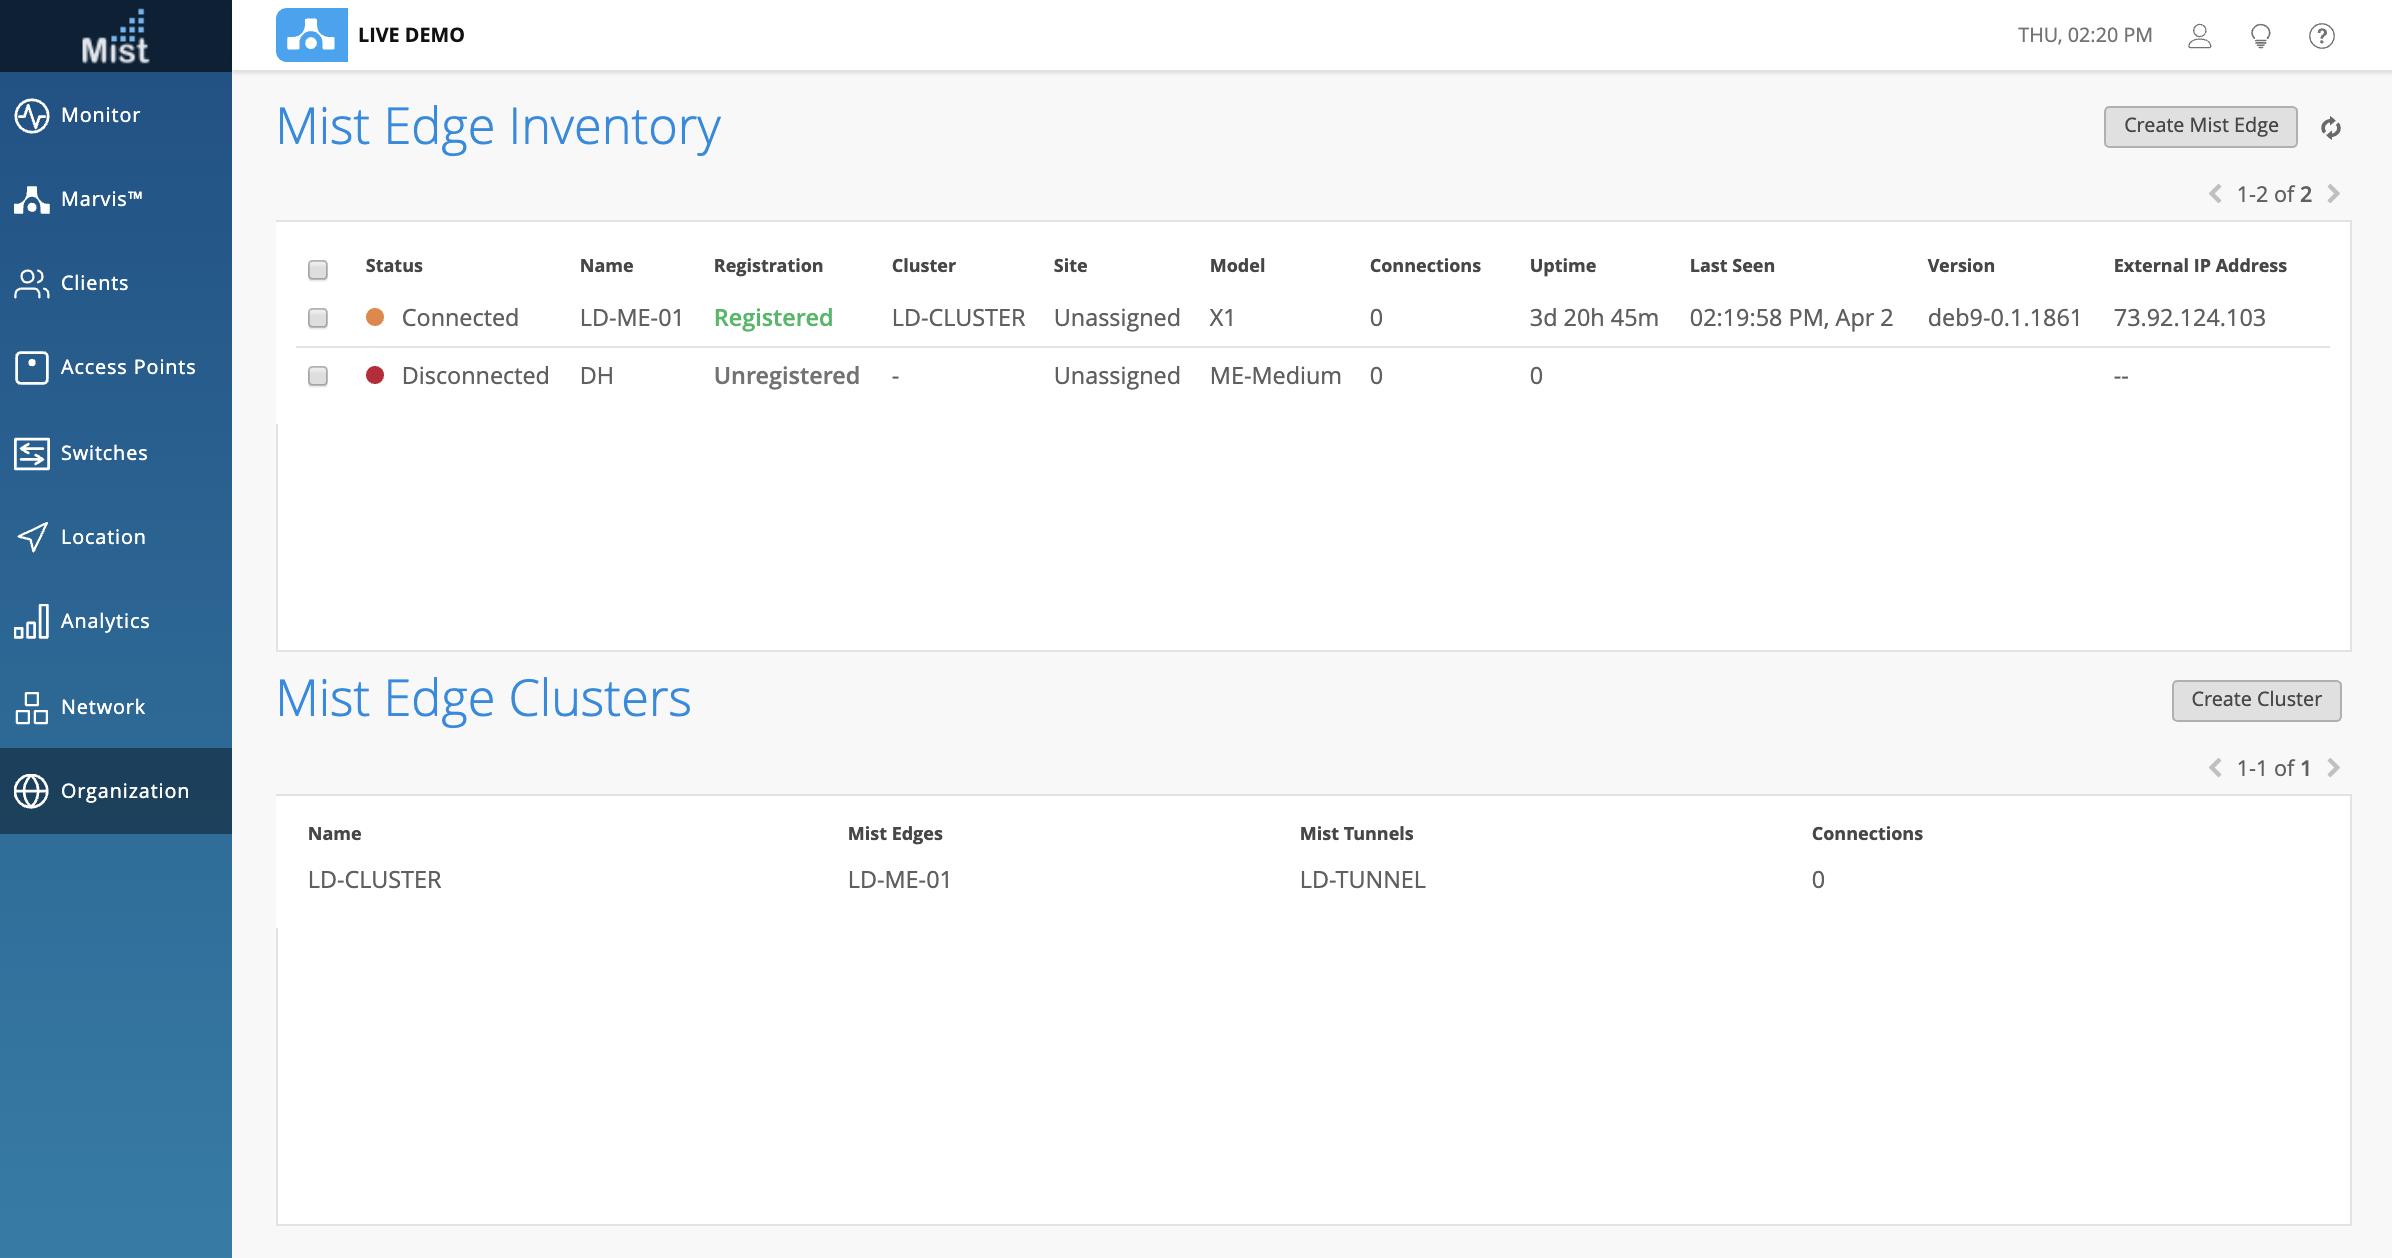
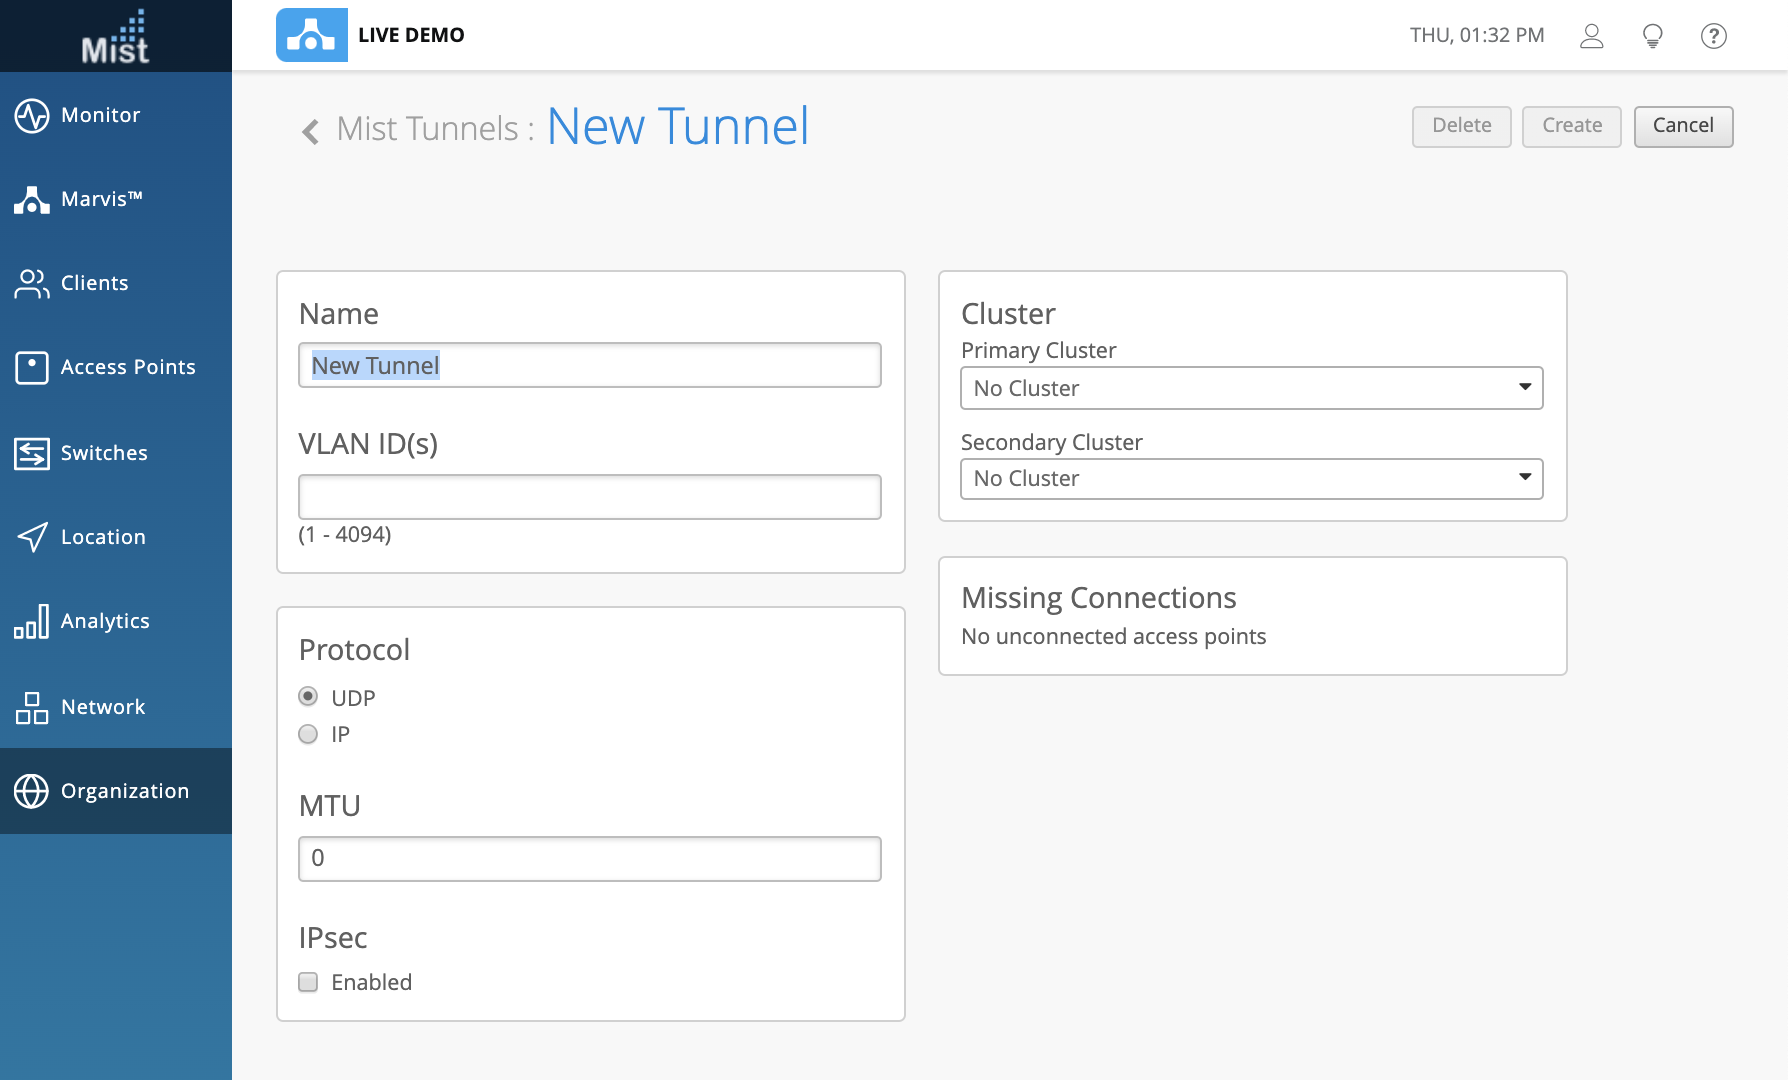
Those with the Mist Edge subscription now have UI access to our Mist Tunnels. Now you may create and edit your tunnels directly from the Mist Dashboard. Here you can define VLANs, Protocols, and Primary/Secondary Clusters.
Simply navigate to Organization > Mist Tunnels to see this page. Select the Create button to make a new tunnel or select any existing tunnels in the list to make configuration changes.
Access the Mist Edge page by navigating to Organization > Mist Edges. Here you can create Mist Edges and Clusters directly from our UI.