- play_arrow Get Started
- play_arrow Organization Management
- Organization and Sites Overview
- Add an Organization
- Delete an Organization
- Manage Organization Settings
- Authentication Methods Overview
- Manage Identity Providers
- Manage Roles
- Manage API Tokens
- Configure Webhooks to Receive Event Notifications in Third-Party Applications
- Integrate Your Juniper Support Resources to Your Organization
- play_arrow Site Management
- play_arrow User Management
- play_arrow Inventory Management
- play_arrow Support Insights
- play_arrow Audit Logs
- play_arrow Licensing
- play_arrow Marvis VNA for Data Center
- play_arrow Monitor and Troubleshoot Data Center Events
- play_arrow Impact Analysis
- play_arrow Service Level Expectations
- play_arrow Alerts
- play_arrow Help & Support
Service Awareness Overview
The Service Aware feature in Juniper Apstra Cloud Services provides a visual representation of the services that are active during a given time period. The visualization also shows how the data center fabric is being utilized by these services. You can select a service and drill down to get detailed information about the traffic flow.
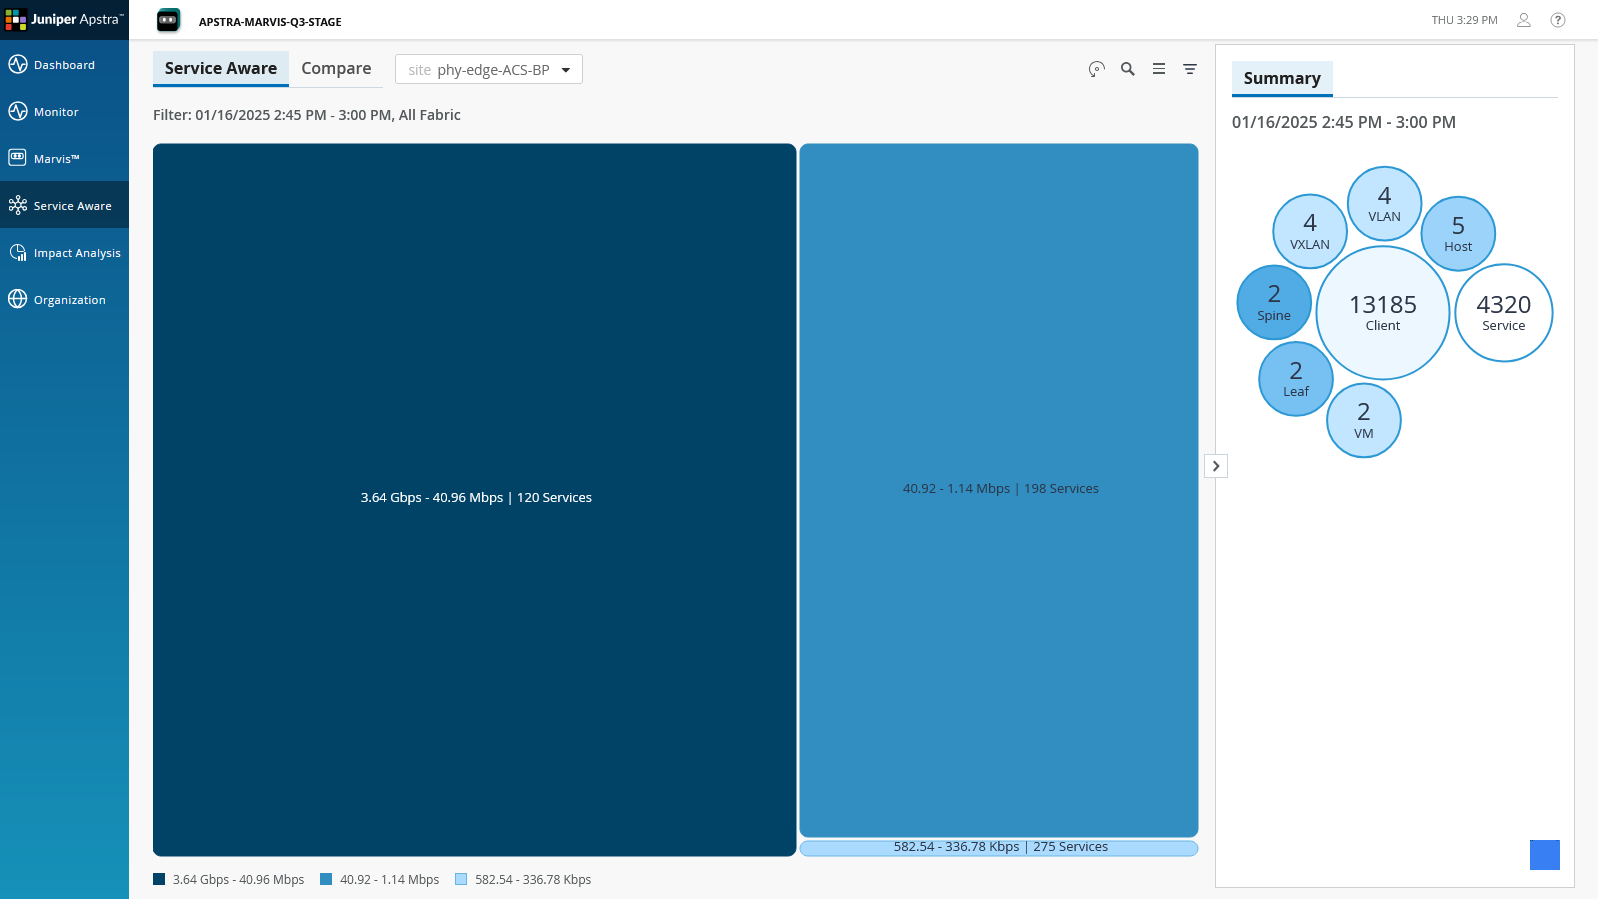
An Apstra-managed data center is aware of all the services that are running in the data center. The Service Aware feature provides a visual representation of all the services running in the site, grouped by throughput, volume, or connections for the site you select. The data displayed on the Service Aware page is refreshed every 15 minutes. To view real-time data, click the On-Demand Data button on the top right of the page.
You can drill down and view details of specific services, view the network topology, identify any node that has an anomaly, and the hosts connected to the device, which are impacted by the anomaly.
You must configure sFlow in the devices in the data center to view flow data in Apstra Cloud Services.
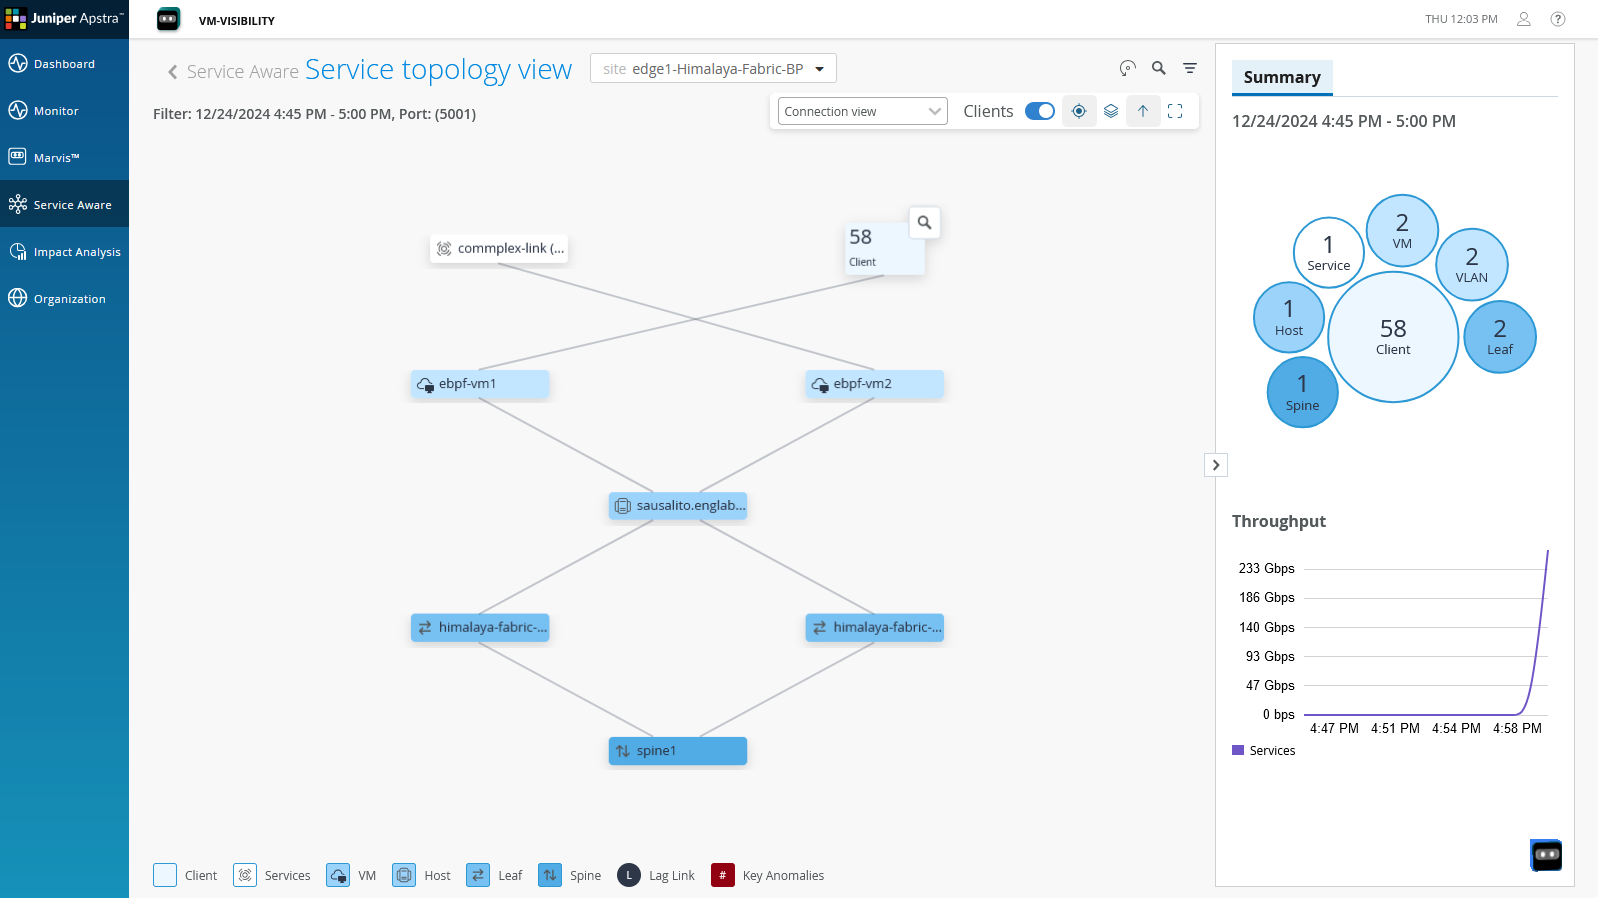
You can select a set of services and examine how nodes are connected to hosts and how those services traverse through the data center fabric. The total count of events and anomalies affecting the nodes is displayed in the topology diagram.
You can view a visual representation of the impact of a device or service failure on the clients connected to it. Select a device or service and click Fail Scenario on the right pane. The potential failure scenarios are simulated and displayed in the topology.
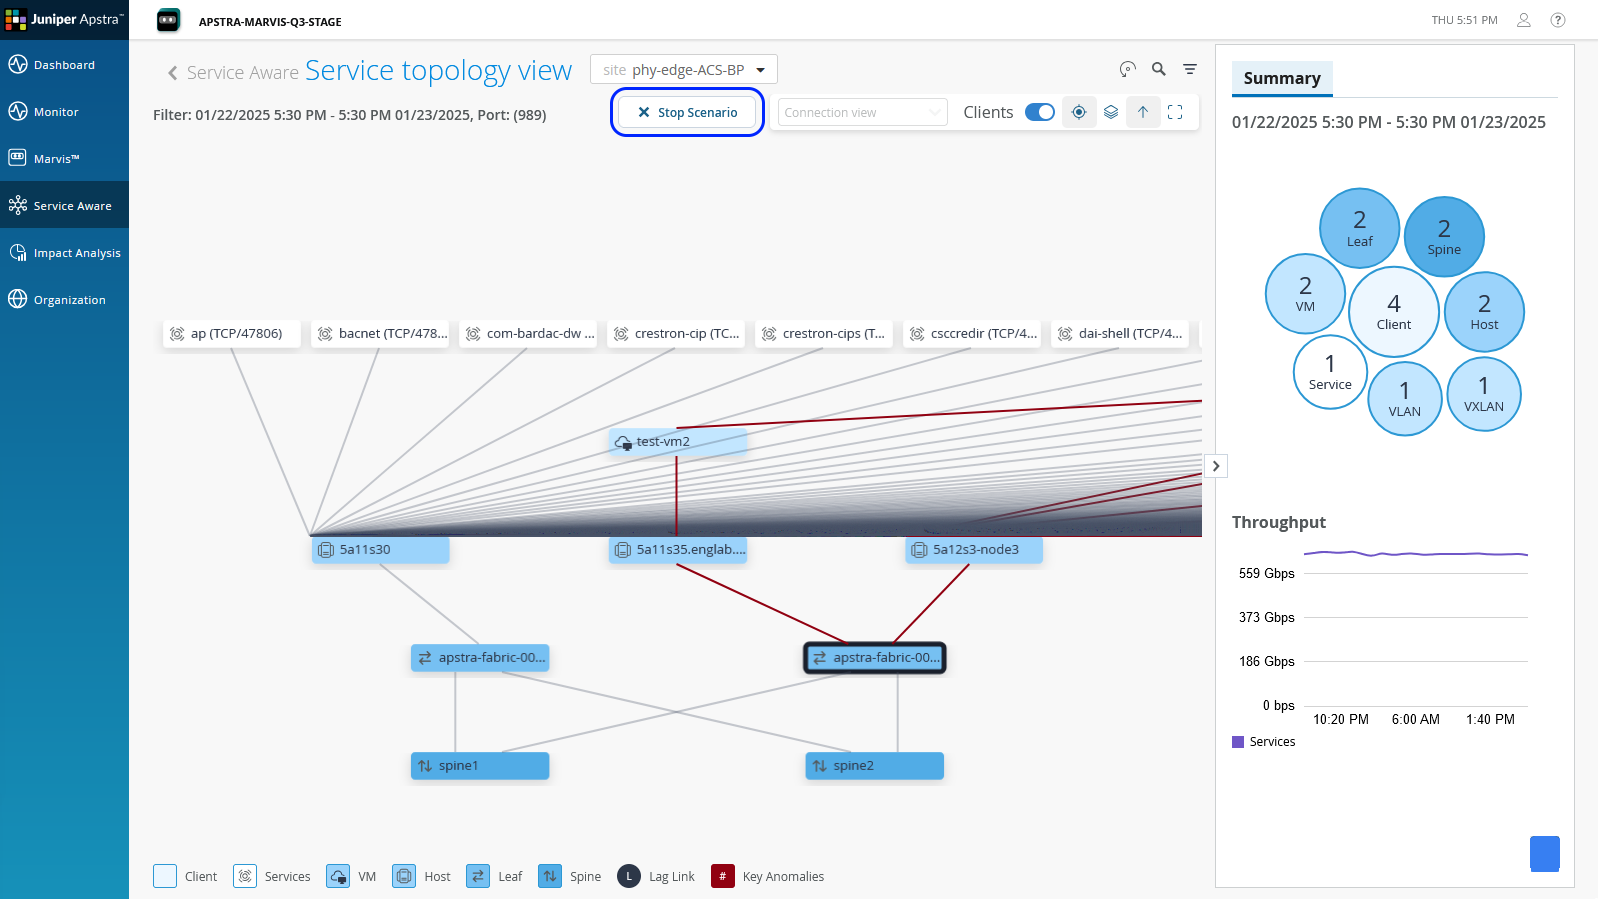
You can also view how traffic is flowing through the data center network for a specific service. Select a service from the topology and click Traffic Flow on the right pane. Once you select the clients you want to monitor from the drop-down, you can see a visualization of application traffic flow.
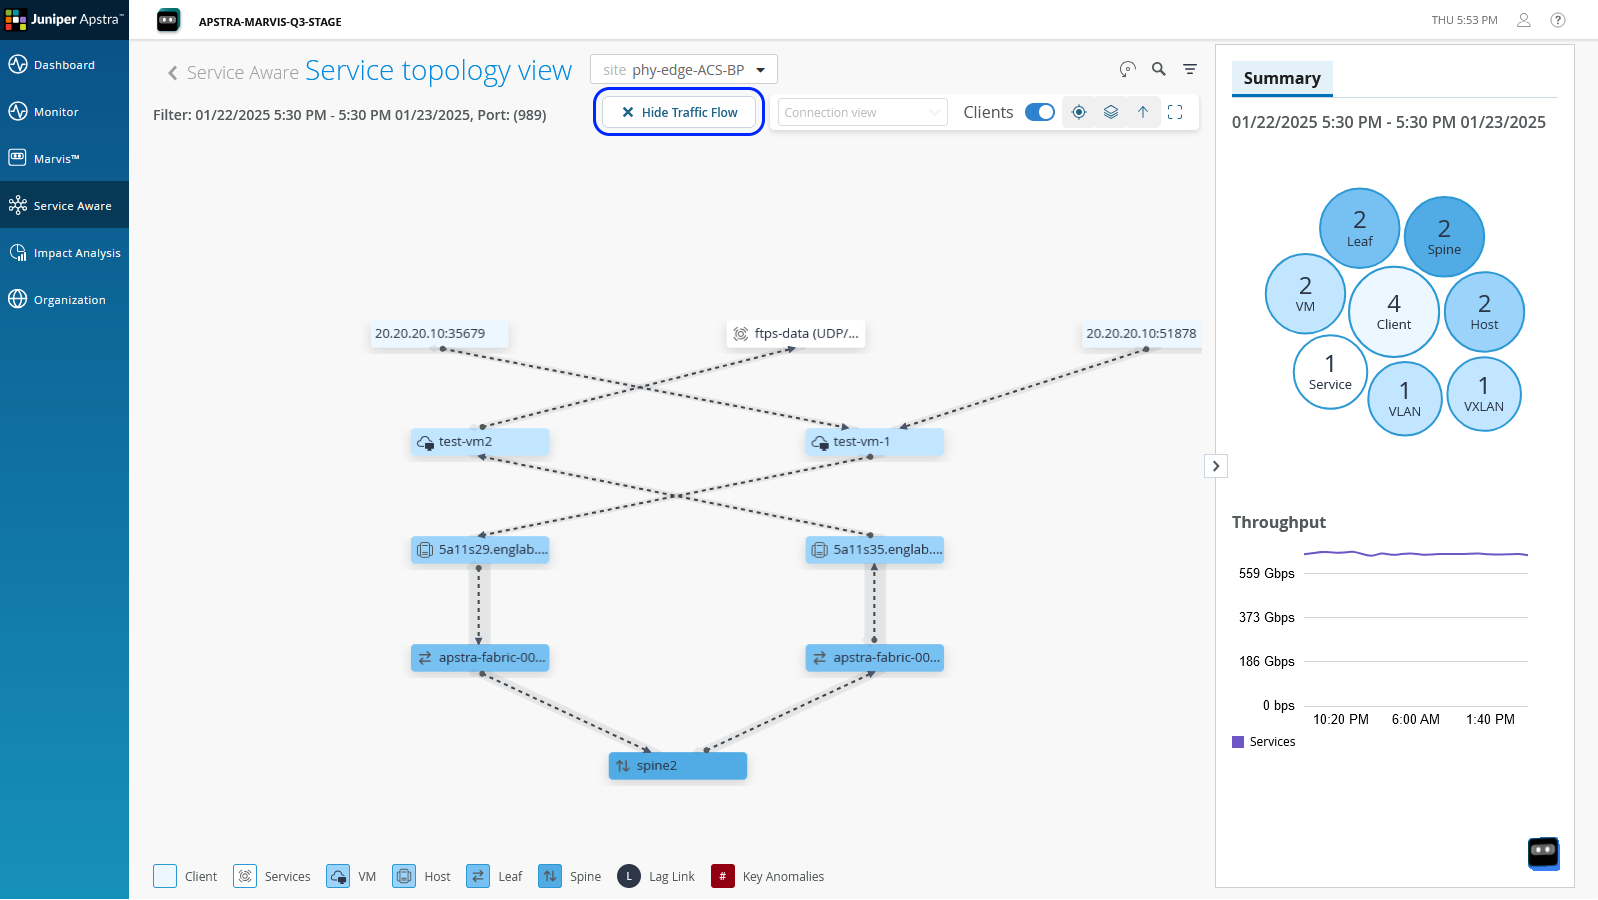
The Summary tab in the right pane provides a summary of the selected service with details such as the number of devices associated with the service and the total number of services.
The search option on the Service Aware page enables you to examine the required service without having to drill down from the topology view. You can directly search for the service and view the connections and flow details for that service. The filter option helps you look into the connections between specific leaf and spine nodes and examine the service traffic by selecting specific services and the layers that you want to view.
You can also compare how the services and endpoints performed during two time periods from the Compare tab. The flow data collected from the Apstra instance is stored in Apstra Cloud Services for 30 days. You can compare the current performance of the services with the last 30 days' flow data. Select Connection View to view the connections between the devices and the services associated with the devices. Select Flow View to understand how service traffic utilizes the network.
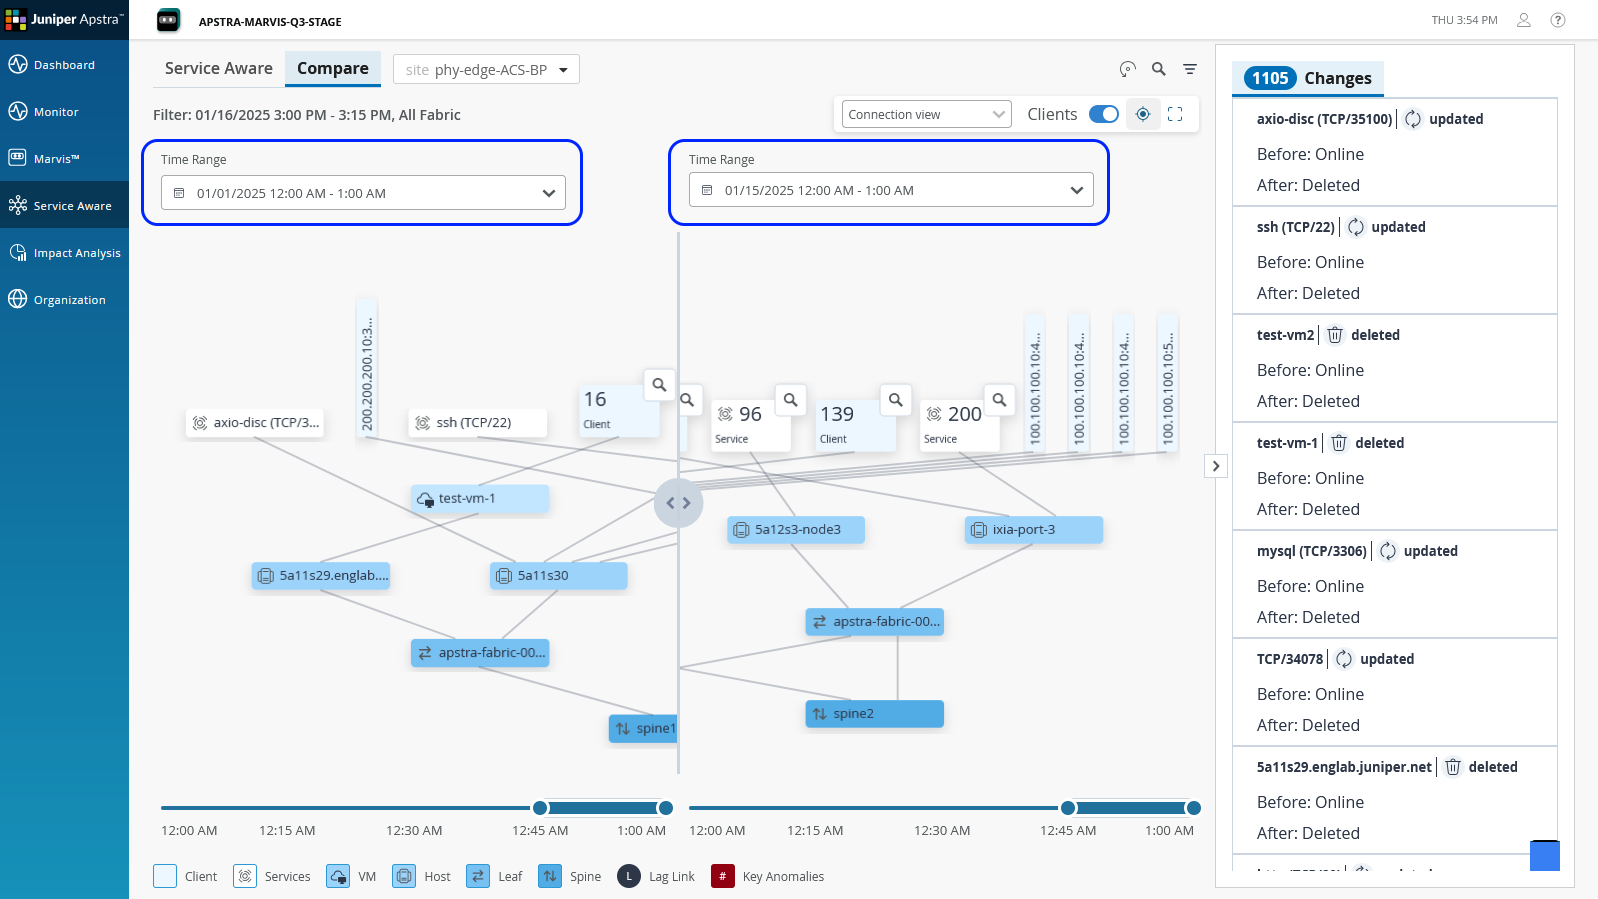
The flow view on the Service Aware page provides information about the flow data between the nodes. A thicker line connecting the devices indicates that more traffic is being exchanged between those devices.
The Service Aware feature thus provides a complete view of the data center, providing insights about potential issues in the data center network and their impact on the services.
Benefits of Service Aware
Provides a service-to-data center resource mapping, thereby providing visibility about how the services are utilizing the data center fabric. This visibility enables administrators to correlate application issues with potential network issues in the data center devices, helping them to resolve issues faster.
Provides information about devices or ports that are associated with specific services. This enables administrators to perform impact analysis and pinpoint devices or ports that are causing issues.
Provides visualization of the network topology displaying how services connect to different endpoints.
Provides insights about traffic patterns and performance metrics for services and network endpoints.


