Impact Analysis Overview
Impact Analysis Overview
The Impact Analysis feature combines Apstra's intent-based analytics (IBA) with network service visibility. The Impact Analysis page on Juniper Data Center Assurance provides a visual representation of the network infrastructure with the following information:
- how nodes in the data center are connected to the clients
- what path the service traffic takes
- how the application traffic is handled
- how an anomaly in a node in the data center can impact application traffic.
Whenever an event occurs in the data center, Apstra generates several anomalies, which might include subsequent events triggered by an earlier anomaly. The main anomaly that triggered the related events is identified as the key anomaly. For example, when a port on a switch goes down, the event might generate various related anomalies like interface issues, cabling issues, route issues, and so on.
The Impact Analysis feature uses knowledge graphs to correlate events to issues in the data center network and then maps those issues to the potential impact on the applications that are utilizing the network. Instead of displaying several anomalies and causing alert fatigue, the Impact Analysis feature lets you view the key anomaly and the impacted devices in the topology diagram.
To view the Impact Analysis page, navigate to Assurance > Impact Analysis.
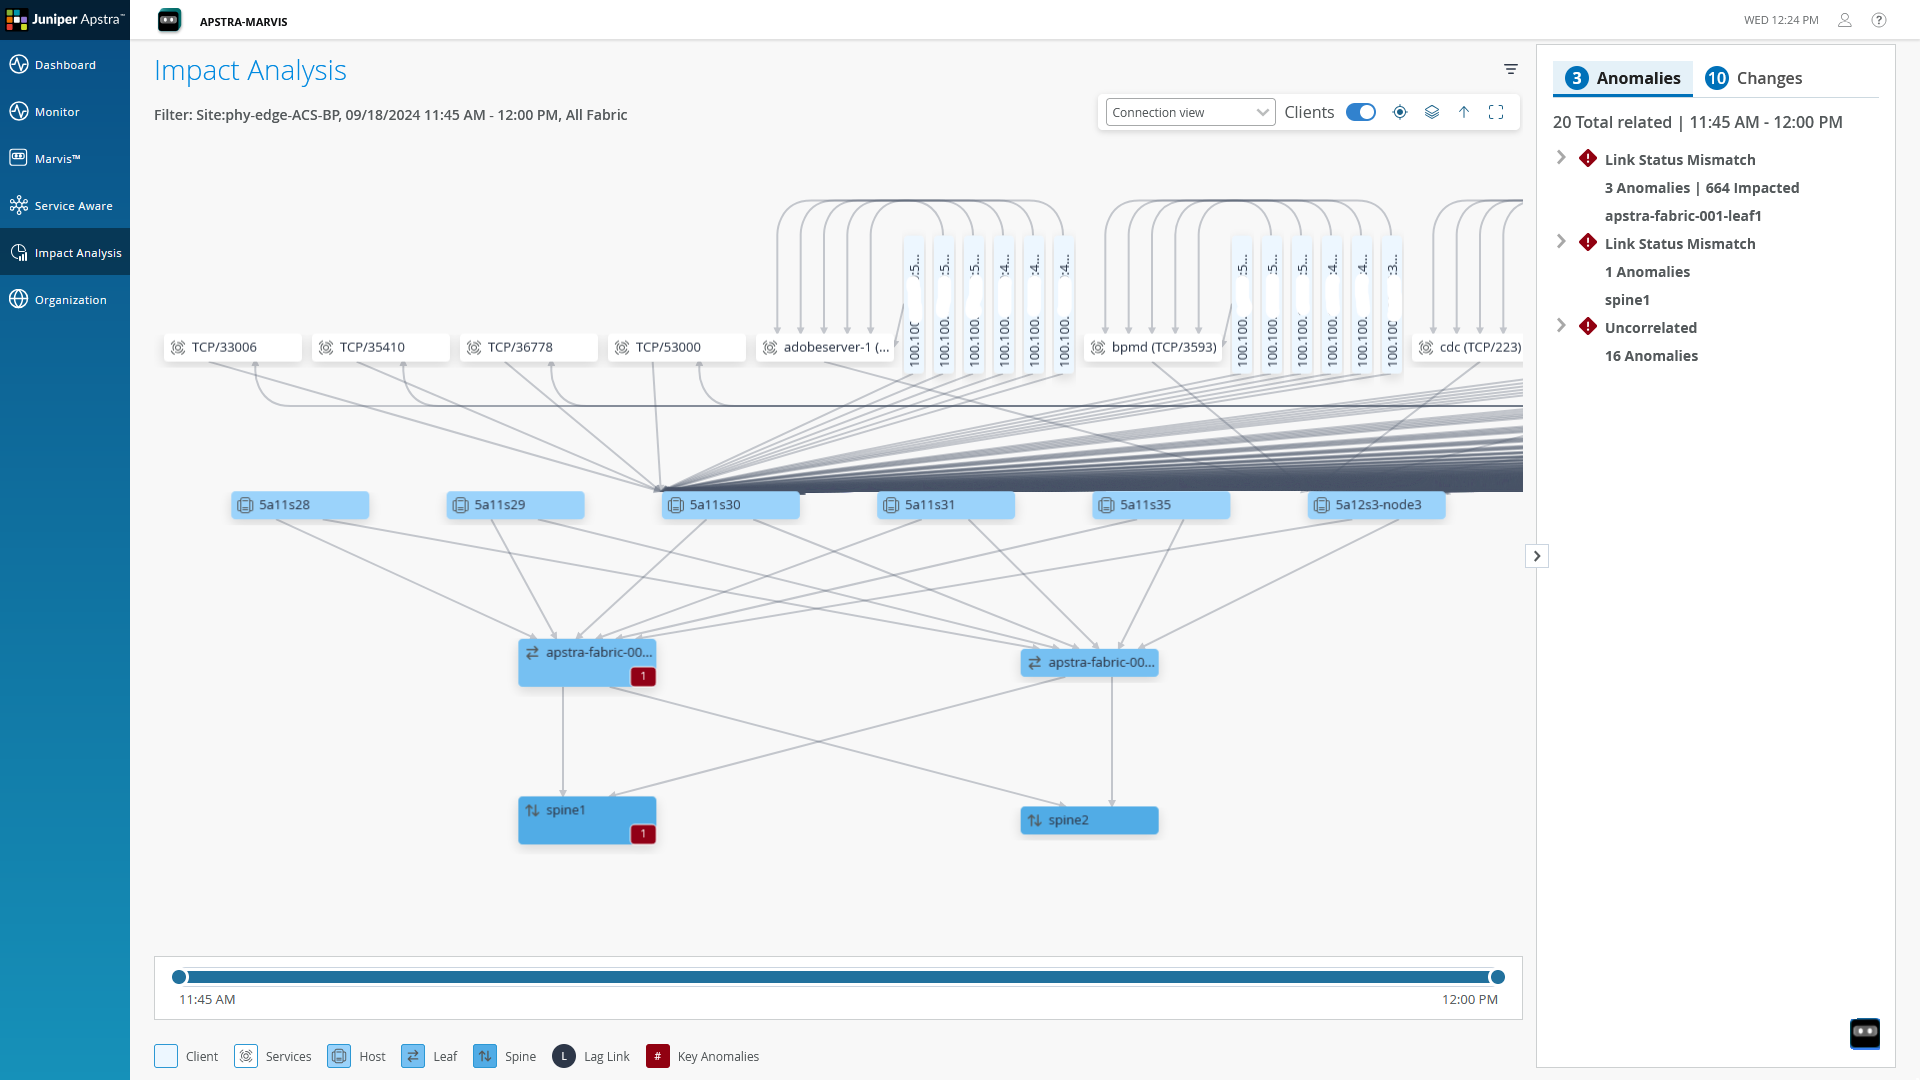
The Anomalies tab in the right pane of DC Assurance displays the current anomalies that occurred in the network along with their start time. Expand a key anomaly to view the detailed list of associated anomalies, symptoms, affected devices, interfaces, services, Virtual Networks, and VRFs. The tab also displays a list of uncorrelated anomalies. Select an anomaly to highlight the affected node in the topology diagram.
When you select a Link Status Mismatch anomaly, the affected node will not be highlighted on the topology diagram. It will only be listed in the anomaly details.
The Changes tab displays the changes in the network topology, such as addition or removal of a device. You can also use the filter on the page to examine how a specific service performed during the selected time period.
The Impact Analysis feature thus enables the administrators to quickly identify the root cause of an issue and resolve it so that the related anomalies also might get resolved. This helps network administrators reduce the mean time to resolution (MTTR), which in turn helps improve application user experience.
Figure 1 shows the Impact Analysis page displaying how the nodes in the data center network are connected to the clients and how an anomaly in a data center device can impact the clients.
Here, we will show how Juniper Data Center Assurance provides end-to-end assurance for business critical applications.
We will explore how infrastructure events in the compute layer such as Vmotions or backup file transfers can increase the load on the fabric and trigger anomalies like interface flaps that impact the application performance. These kinds of anomalies can affect our other workloads running on the same infrastructure as well.
In our scenario, the enterprise IT team reports that users are experiencing intermittent access issues with the CRM application. These problems have been occurring in the evening hours between 4:00 p.m. and 5:00 p.m. Wi-Fi and access point connectivity have been checked and ruled out. So, the issue is escalated to the network admin for investigation on the data center side.
During the day, the CRM application performs normally. Pages load quickly and users can easily navigate the interface. But in the evening, the application becomes unresponsive at times. Users are unable to load the homepage or navigate through features which disrupts their ability to work. Sometimes the pages eventually load after a delay, but the issue persists intermittently. When the problem is occurring, pages are slow or even completely stop loading at all. Fortunately, we have tools that allow us to look deeply at the network to determine the source of the problems quickly.
The network admin begins by logging into Juniper Data Center Assurance and navigates to the Impact Analysis screen. They select the time window reported by IT - 4:00 p.m. to 5:00 p.m. Specifying the date and time allows us access to the historical data. Sliding through the 15-minute intervals within the time range, the admin observes anomalies between 4:00 and 4:30 p.m., specifically on the leaf switch.
Several services are impacted by these anomalies, including the CRM application, which runs on port 8069. Expanding the anomaly view confirms that the CRM service hosted on hypervisor ESX01 is affected by the issue in the fabric layer.
To investigate further, the admin moves to the Service Awareness page which provides a comparison view for analyzing service topologies across the different time periods.
The admin selects the same time window from the IT report for comparison.
Here, we're setting a date and time range so we can search through the historical data to find where the problems actually occurred.
The comparison screen allows the admin to view changes in the 15-minute windows side by side. Using sliders, they explore variations in service topologies before and after the anomaly occurred. The change panel highlights key differences between the two snapshots.
A DNS VM that was initially connected to ESX01 is now in a disconnected state. A new DNS VM appears on ESX04. ESX04 itself, which wasn't in the previous topology, is now active. All of these changes are listed in the change panel with the option to drill into host level details.
With this information in hand, the network admin contacts the virtual infrastructure admin. The VI admin begins investigating ESX01; confirms that during the reported time period, a Vmotion event was triggered and completed at 4:36 p.m. They also confirmed that this is a scheduled Vmotion performed daily during evening hours to consolidate VMs and shut down unused infrastructure to save power. Once the Vmotion was completed, the anomalies in the fabric self-resolved. Since this was a scheduled Vmotion and it occurs regularly in the evening, the intermittent slowness experienced by users is an expected side effect of the compute load shifting across the fabric.
By using end-to-end assurance with Juniper Data Center Assurance, the network admin was able to correlate compute events with fabric anomalies and trace their impact on application performance and pinpoint the root cause quickly and efficiently.
Simulate Failure Scenarios
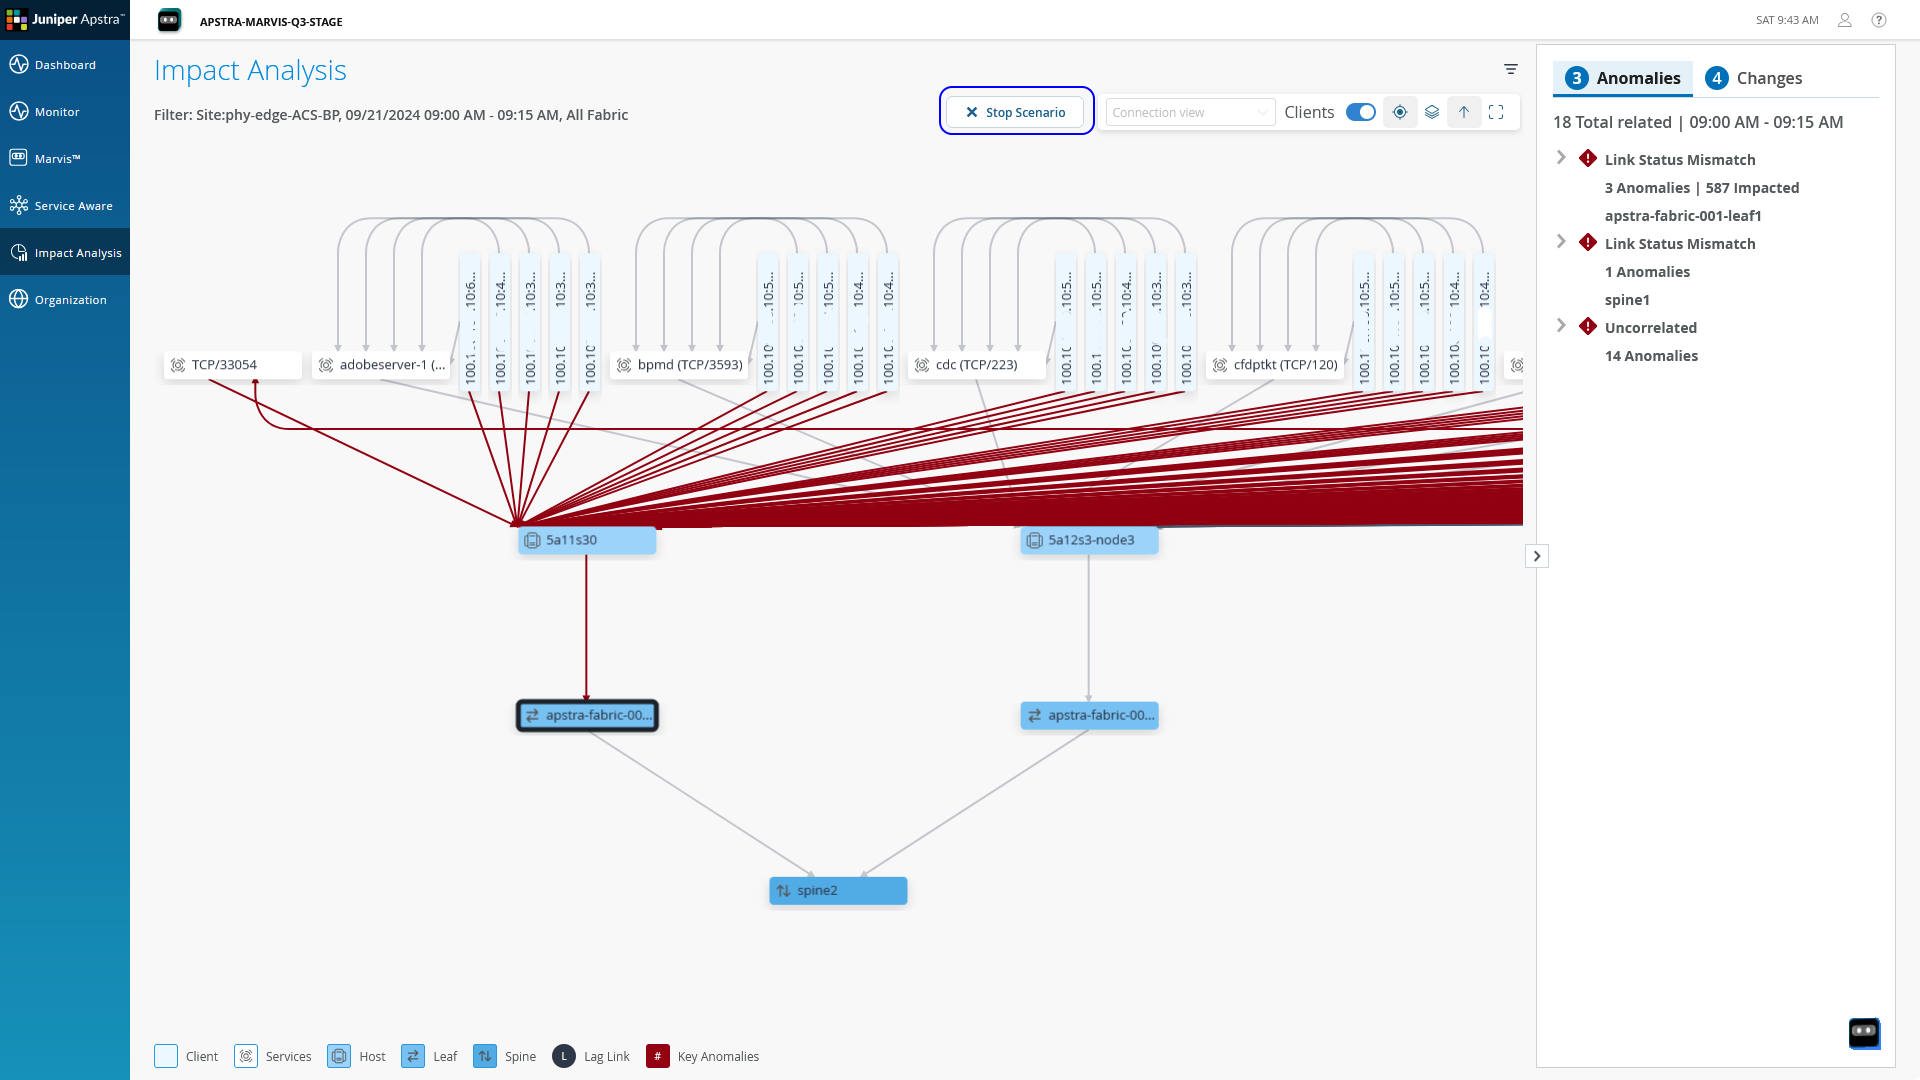
Using the Impact Analysis feature, you can also simulate failure scenarios to identify potential impact of an issue in the data center network. You just need to select a device in the network and click Fail Scenario. DC Assurance generates a visualization of how clients and services will be impacted if an issue occurs in the device. Thus, network administrators can use the Impact Analysis feature to analyze the impact of a network issue, and also to identify which component in the network is causing issues to the application traffic. Instead of providing generic solutions to troubleshoot issues, the Impact Analysis feature helps administrators to pinpoint specific issues in the data center network that affect application user experience.
Figure 2 shows how an issue
in the device apstra-fabric-001-leaf1 can impact the clients that
are connected to it.
View Device Details
In addition to this information, you can also view details of specific nodes in the topology. Click a node to view details of the node in the right pane. The displayed information includes CPU and memory utilization, along with details of transmitted and received packets on each interface of the device as shown in Figure 3.
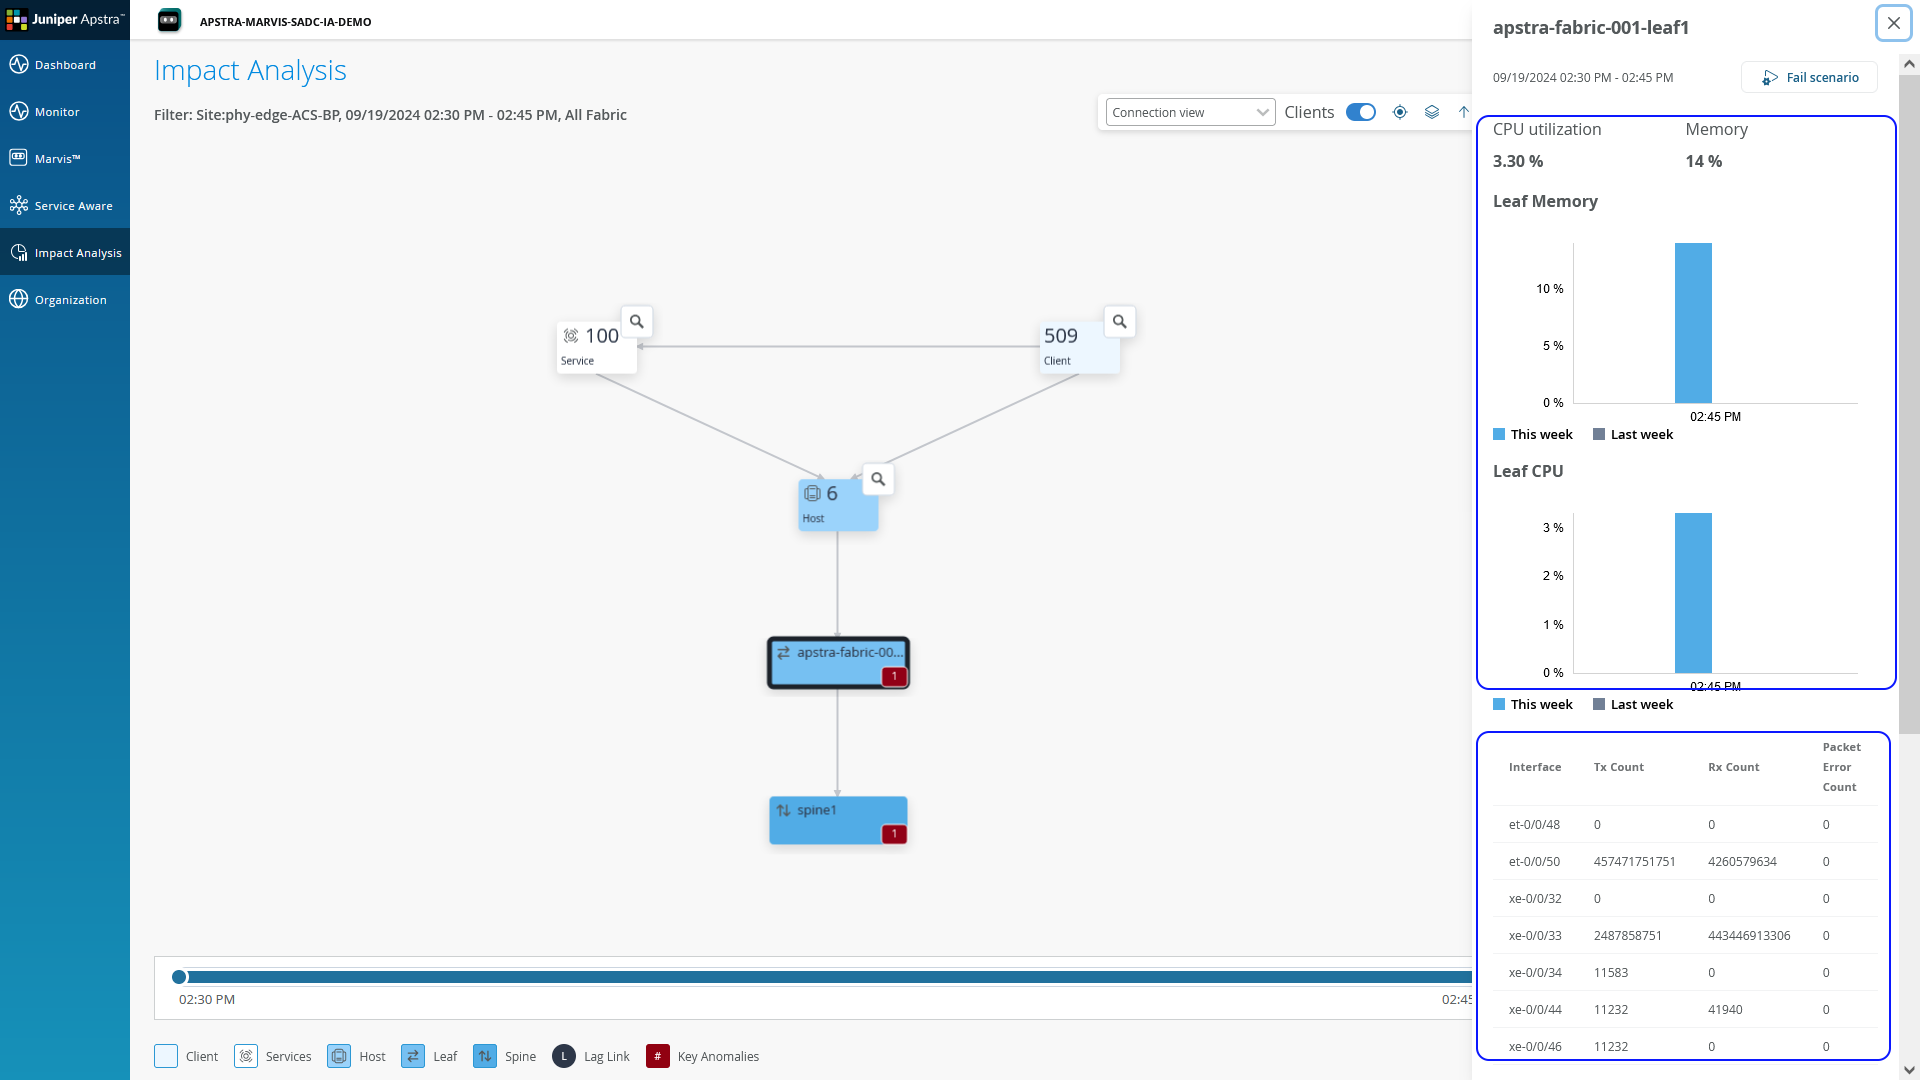
You must import a probe for each blueprint in the Apstra Data Center Director instance to enable sending of CPU and memory utilization data to Juniper Data Center Assurance. For more information, see Import a CPU and Memory Probe in Apstra Data Center Director in Juniper Apstra Edge Setup Guide.
Benefits of Impact Analysis
The Impact Analysis page provides the following benefits:
-
Enables administrators to map application issues to issues in the data center network, enabling faster resolution issues minimizing the impact on end user experience.
-
Helps reduce the MTTR of data center issues, enhancing end user experience.
-
Helps quickly identify the potential impact of network events on clients and services utilizing the network.