Centralized Monitoring and Troubleshooting using AWS Features
This topic provides you details on how you can perform monitoring and troubleshooting of your vSRX Virtual Firewall instances on the AWS console by integrating vSRX Virtual Firewall with CloudWatch, IAM, and Security Hub.
Understanding Centralized Monitoring Using Cloudwatch
AWS provides a comprehensive view of various metrics, logs, security events from third-party services across AWS accounts. With the support of CloudWatch, vSRX Virtual Firewall can publish native metrics and logs to cloud, which you can use to monitor vSRX Virtual Firewall running status. Security Hub is the single place that aggregates, organizes and prioritizes security alerts.
The CloudWatch logs agent provides an automated way to send log data to CloudWatch Logs from Amazon EC2 instances. The agent pushes log data to CloudWatch Logs.
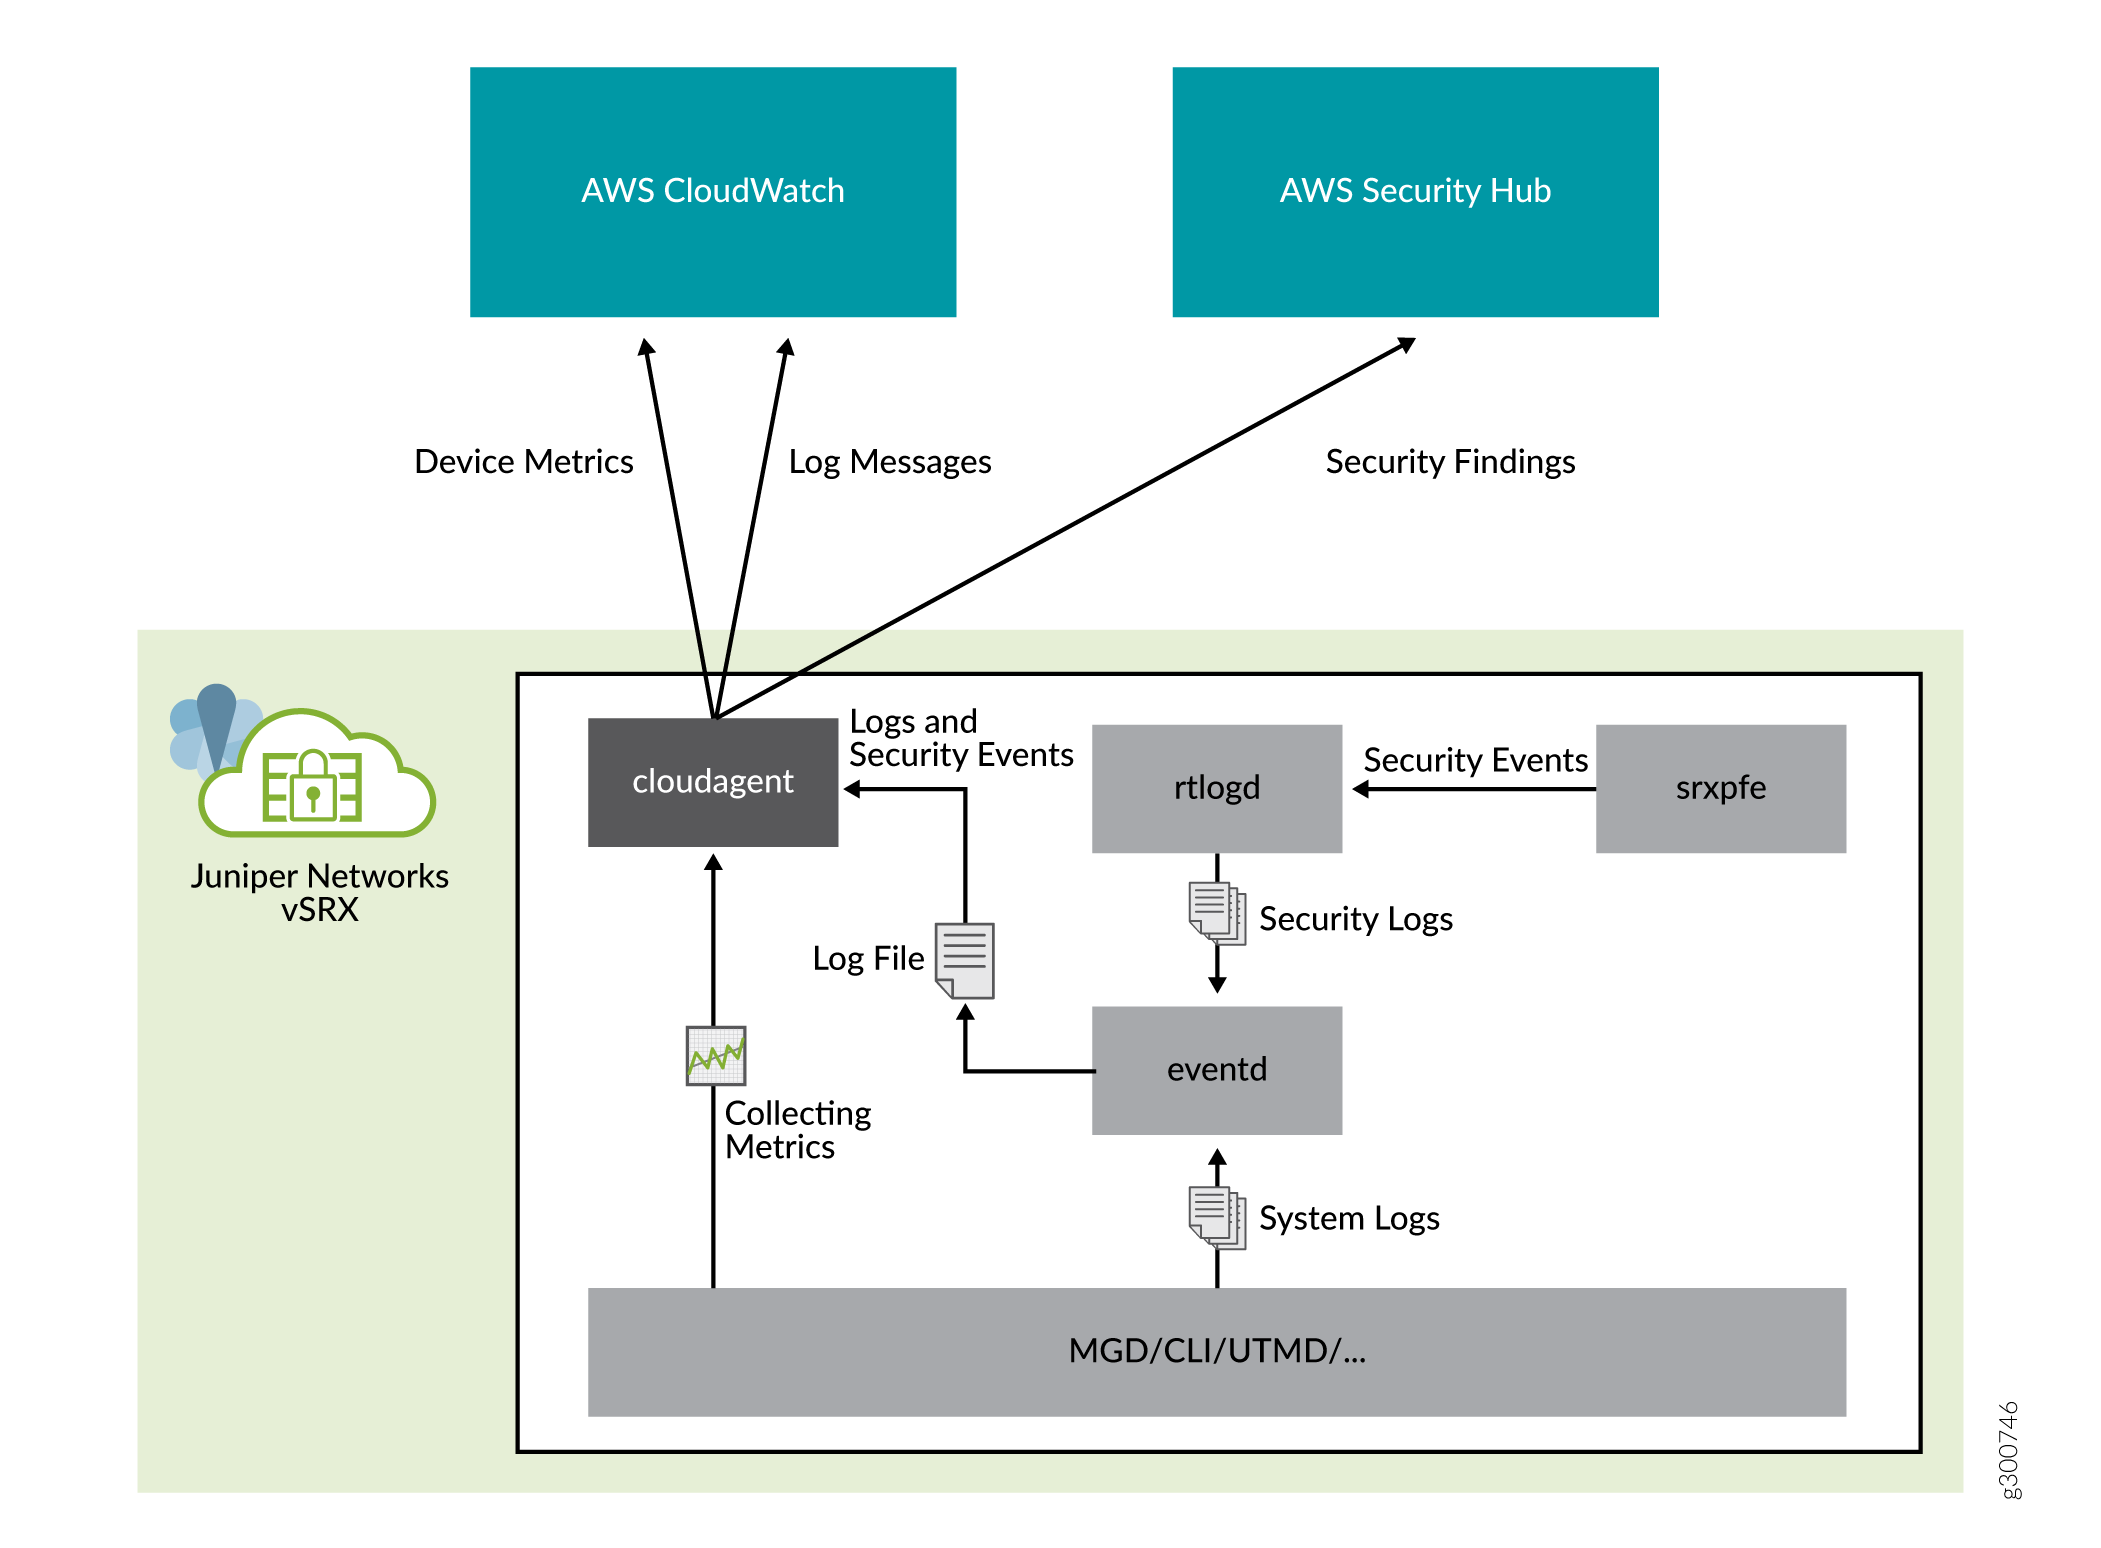
The cloudagent daemon that runs on the vSRX Virtual Firewall allows integration of AWS CloudWatch and Security Hub. The cloudagent:
Collects device metrics and send metrics to AWS CloudWatch
Collects system and security logs and sends the logs to AWS CloudWatchLog
Any event type (component or log level) that can be collected by the cloudagent under vSRX Virtual Firewall event log mode is supported for CloudWatch log collection. Events supported for CloudWatchLog are:
System activities such as Interfaces status (up/down), configuration changes, user login logout and so on.
Security events such as IDP, ATP Cloud, and security logs such as Content Security logs, and Screen, ATP Cloud and so on.
Collects security alerts and import those alerts to Security Hub in security finding format.
To import security events to Security Hub, you need to configure CloudWatch log collection and import the security events based on the log messages.
Security Hub collects security data from across AWS accounts, services, and supported third-party partners and helps you analyze your security trends and identify the highest priority security issues. After the AWS security hub support is added on vSRX Virtual Firewall, it helps administrator reduces the effort of collecting and prioritizing security findings across accounts. With the help of Security hub, you can run automated, continuous account-level configuration and compliance checks based on vSRX Virtual Firewall security output.
For the list of events and metrics that are imported, see Table 1 and Table 2.
For more information on the events and their purpose, see Juniper System Log Explorer.
|
Metric |
Description |
|---|---|
|
AV_MANY_MSGS_NOT_SCANNED_MT |
Skip antivirus scanning due to excessive traffic |
|
WEBFILTER_URL_BLOCKED |
Web request blocked |
|
AAMW_CONTENT_FALLBACK_LOG |
AAMW content fallback info |
|
AV_MANY_MSGS_DROPPED_MT |
Drop the received file due to excessive traffic |
|
PFE_SCREEN_MT_CFG_ERROR |
screen config failure |
|
WEBFILTER_URL_REDIRECTED |
Web request redirected |
|
AV_FILE_NOT_SCANNED_PASSED_MT |
The antivirus scanner passed the received traffic without scanning because of exceeding the maximum content size |
|
RT_SCREEN_TCP_SRC_IP |
TCP source IP attack |
|
RT_SCREEN_SESSION_LIMIT |
Session limit |
|
SECINTEL_ACTION_LOG |
Secintel action info |
|
IDP_APPDDOS_APP_STATE_EVENT |
IDP: DDOS application state transition event |
|
AAMW_HOST_INFECTED_EVENT_LOG |
AAMW cloud host status event info |
|
IDP_ATTACK_LOG_EVENT |
IDP attack log |
|
IDP_SESSION_LOG_EVENT |
IDP session event log |
|
AAMW_MALWARE_EVENT_LOG |
AAMW cloud malware event info |
|
WEBFILTER_URL_PERMITTED |
Web request permitted |
|
IDP_PACKET_CAPTURE_LOG_EVENT |
IDP packet captutre event log |
|
RT_SCREEN_WHITE_LIST |
Screen white list |
|
RT_SCREEN_IP |
IP attack |
|
AAMW_SMTP_ACTION_LOG |
AAMW SMTP action info |
|
RT_SCREEN_TCP_DST_IP |
TCP destination IP attack |
|
IDP_APPDDOS_APP_ATTACK_EVENT |
IDP: DDOS attack on application |
|
RT_SCREEN_ICMP |
ICMP attack |
|
IDP_TCP_ERROR_LOG_EVENT |
IDP TCP error log |
|
AV_FILE_NOT_SCANNED_DROPPED_MT |
The antivirus scanner dropped the received traffic without scanning because of exceeding the maximum content size |
|
AAMW_ACTION_LOG |
AAMW action info |
|
PFE_SCREEN_MT_ZONE_BINDING_ERROR |
screen config failure |
|
AV_VIRUS_DETECTED_MT |
The antivirus scanner detected a virus |
|
PFE_SCREEN_MT_CFG_EVENT |
screen config |
|
RT_SCREEN_TCP |
TCP attack |
|
RT_SCREEN_UDP |
UDP attack |
|
AV_SCANNER_DROP_FILE_MT |
The antivirus scanner dropped the received traffic because of an internal error |
|
AAMW_IMAP_ACTION_LOG |
AAMW IMAP action info |
|
AV_SCANNER_ERROR_SKIPPED_MT |
Skip antivirus scanning due to an internal error |
|
AV_MEMORY_INSUFFICIENT_MT |
The DRAM size is too small to support antivirus |
|
Metric |
Unit |
Description |
|---|---|---|
|
ControlPlaneCPUUtil |
Percent |
Utilization of the CPU on which control plane tasks are running |
|
DataPlaneCPUUtil |
Percent |
Utilization of each CPU on which data plane tasks are running |
|
DiskUtil |
Percent |
Disk storage utilization |
|
ControlPlaneMemoryUtil |
Percent |
Memory utilization of control plane tasks |
|
DataPlaneMemoryUtil |
Percent |
Memory utilization of data plane task |
|
FlowSessionInUse |
Count |
Monitors the number of flow session in use, including all those sessions are allocated in valid, invalid, pending and other states. |
|
FlowSessionUtil |
Percent |
Flow session utilization |
|
RunningProcesses |
Count |
Number of processes in running state. |
|
Ge00XInputKBPS |
Kilobits/Second |
Interfaces input statistics on Kilobits per second. Each GE interface will be monitored separately. |
|
Ge00XInputPPS |
Count/Second |
Interfaces input statistics on packets per second. Each GE interface will be monitored separately. |
|
Ge00XOutputKBPS |
Kilobits/Second |
Interfaces output statistics on Kilobits per second. Each GE interface will be monitored separately. |
|
Ge00XOutputPPS |
Count/Second |
Interfaces output statistics on packets per second. Each GE interface will be monitored separately. |
Besides the agent running in vSRX Virtual Firewall, you must configure the AWS console to enable CloudWatch and Security Hub service for vSRX Virtual Firewall, including:
-
Grant privileges for vSRX Virtual Firewall to post data to CloudWatch and Security Hub
Create a role with corresponding permission in AWS Identity and Access Management (IAM) console
Attach the role to vSRX Virtual Firewall instances in AWS EC2 console
Configure CloudWatch dashboard to display metric items with chart widget
Figure 1 shows how a cloudagent collects data from vSRX Virtual Firewall and posts to AWS services.
Benefits
Observability of events and data on a single platform across applications and infrastructure
Easiest way to collect metric in AWS and on-premises
Improve operational performance and resource optimization
Get operational visibility and insight
Derive actionable insights from logs
CloudWatch Overview
Amazon CloudWatch is a monitoring and management service built for developers, system operators, site reliability engineers (SRE), and IT managers. CloudWatch provides you with data and actionable insights to monitor your applications, understand and respond to system-wide performance changes, optimize resource utilization, and get a unified view of operational health.
You can use CloudWatch to detect anomalous behavior in your environments, set alarms, visualize logs and metrics side by side, take automated actions, troubleshoot issues, and discover insights to keep your vSRX Virtual Firewall 3.0 instances running smoothly.
CloudWatch collects monitoring and operational data in the form of logs, metrics, and events, and visualizes it using automated dashboards so you can get a unified view of your AWS resources, applications, and services that run in AWS and on-premises. You can correlate your metrics and logs to better understand the health and performance of your resources. You can also create alarms based on metric value thresholds you specify, or that can watch for anomalous metric behavior based on machine learning algorithms. To take action quickly, you can set up automated actions to notify you if an alarm is triggered and automatically start auto scaling, for example, to help reduce mean-time-to-resolution. You can also dive deep and analyze your metrics, logs, and traces, to better understand how to improve application performance.
Security Hub Overview
AWS Security Hub gives you a comprehensive view of your high-priority security alerts and compliance status across AWS accounts. Security Hub is the single place that aggregates, organizes, and prioritizes security alerts. vSRX Virtual Firewall supports Security Hub with authentication to post security finding data to Security Hub.
Various security alerts from your vSRX Virtual Firewall instances are collected by Security Hub. With the integration of Security Hub, you now have a single place that aggregates, organizes, and prioritizes your security alerts, or findings, from your vSRX Virtual Firewall instances. Your findings are visually summarized on integrated dashboards with actionable graphs and tables. You can also continuously monitor your environment using automated compliance checks based on the AWS best practices and Juniper standards. Enable Security Hub using the management console and once enabled, Security Hub will begin aggregating and prioritizing the findings.
Identity and Access Management Console
AWS Identity and Access Management (IAM) enables you to manage access to AWS services and resources securely. Using IAM, you can create and manage AWS users and groups, and use permissions to allow and deny their access to AWS resources.
IAM is a feature of your AWS account offered at no additional charge.
Integration of vSRX Virtual Firewall with AWS Monitoring and Troubleshooting Features
This topic provides details on how to integrate CloudWatch and Security Hub with vSRX Virtual Firewall 3.0 for centralized monitoring and troubleshooting on the AWS console.
- Grant Permission for vSRX Virtual Firewall to access AWS CloudWatch and Security Hub
- Enable Monitoring of vSRX Virtual Firewall Instances with AWS CloudWatch Metric
- Collect, Store, and View vSRX Virtual Firewall Logs to AWS CloudWatch
- Enable and Configure Security Hub on vSRX Virtual Firewall
Grant Permission for vSRX Virtual Firewall to access AWS CloudWatch and Security Hub
This section provides you details on how to enable access on vSRX Virtual Firewall instances to interact with AWS CloudWatch and Security Hub.
-
Configure an IAM role role on the AWS console and attach the role to
vSRX Virtual Firewall instance. After you create and IAM role, the role can be viewed on
IAM console and edited as necessary.


-
Attach an IAM role to vSRX Virtual Firewall instances by selecting a IAM role and the
vSRX Virtual Firewall instance ID under the Attach/Replace IAM
Role tab on the AWS console as shown in Figure 2. With the created role, you can enable CloudWatch and Security Hub
access for vSRX Virtual Firewall instance by attaching the role.
Figure 2: Attach or Replace IAM Role to the vSRX Virtual Firewall Instances

Enable Monitoring of vSRX Virtual Firewall Instances with AWS CloudWatch Metric
This procedure provides us steps to enable monitoring of vSRX Virtual Firewall with AWS CloudWatch Metric.
Metric is data about the performance of the system. By enabling CloudWatch Metric monitoring, you can monitor some resources of vSRX Virtual Firewall instances.
Collect, Store, and View vSRX Virtual Firewall Logs to AWS CloudWatch
CloudWatch Logs are used to monitor, store, and access log files from Amazon Elastic Compute Cloud (Amazon EC2) instances, AWS CloudTrail, Route 53, and other sources. For a vSRX Virtual Firewall instance, cloudagent collects both system and security logs and then post these logs to CloudWatchLog. The log collection in cloudagent will cache logs in a time window and post them to CloudWatchLog in a batch.
This procedure provides you details on how to enable and configure CloudWatch Logs on vSRX Virtual Firewall
Enable and Configure Security Hub on vSRX Virtual Firewall
To import security events to AWS Security Hub, you need to configure CloudWatch log collection and then import the security events based on the log messages.
For example:
# set security cloud aws cloudwatch log group vsrx-group
# set security cloud aws cloudwatch log file mylog security-hub-import
# set security cloud aws cloudwatch log file mylog collect-interval
1
# set system syslog file mylog any any
# set system syslog file mylog structured-data
In the above configuration you are configuring CloudWatch log collection on file mylog under /var/log directory and any security events in the log file will be imported from the vSRX Virtual Firewall to Security Hub in the AWS security finding format.
The security-hub-import option is only supported
on log files with structured-data format. Which means if a message
is logged with plain text format, security events in log messages
cannot be converted to AWS security finding and imported to Security
Hub.
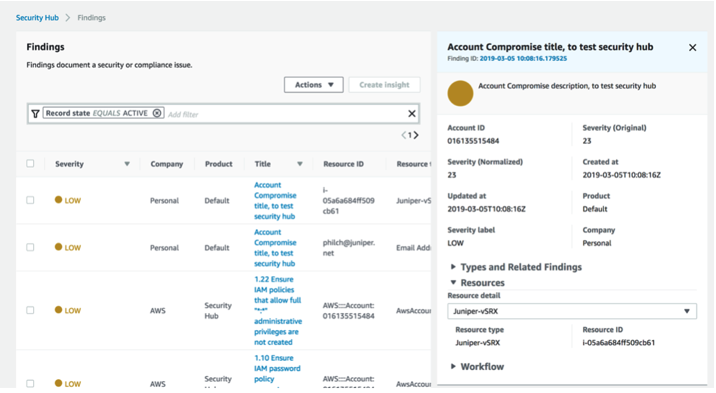
You can view the security findings posted from vSRX Virtual Firewall on the Security Hub console.