ON THIS PAGE
Example: Configure IP Monitoring on SRX Series Firewalls with Chassis Cluster Enabled
This example shows how to monitor SRX Series Firewalls with chassis cluster enabled.
Requirements
-
You need two SRX5800 Services Gateways with identical hardware configurations, one SRX Series Firewall and one Ethernet Switch.
-
Physically connect the two SRX5800 Firewalls (back-to-back for the fabric and control ports) and ensure that they are the same models. Configure/add these two devices in a cluster.
Overview
IP address monitoring checks end-to-end reachability of configured IP address and allows a redundancy group to automatically fail over when not reachable through the child link of redundant Ethernet interface (known as a reth) interface. Redundancy groups on both devices in a cluster can be configured to monitor specific IP addresses to determine whether an upstream device in the network is reachable.
When you configure multiple IP addresses on the reth Interface in a chassis cluster setup, IP monitoring uses the first IP address from the list of IP addresses configured for that reth interface on the primary node, and the first IP address from the list of secondary IP addresses configured for that reth interface on the backup node. The first IP address is the one with smallest prefix (netmask).
This example shows how to set up IP monitoring on an SRX Series Firewall.
IP monitoring is not supported on an NP-IOC card.
IP monitoring does not support MIC online/offline status on SRX Series Firewalls.
Topology
Figure 1 shows the topology used in this example.
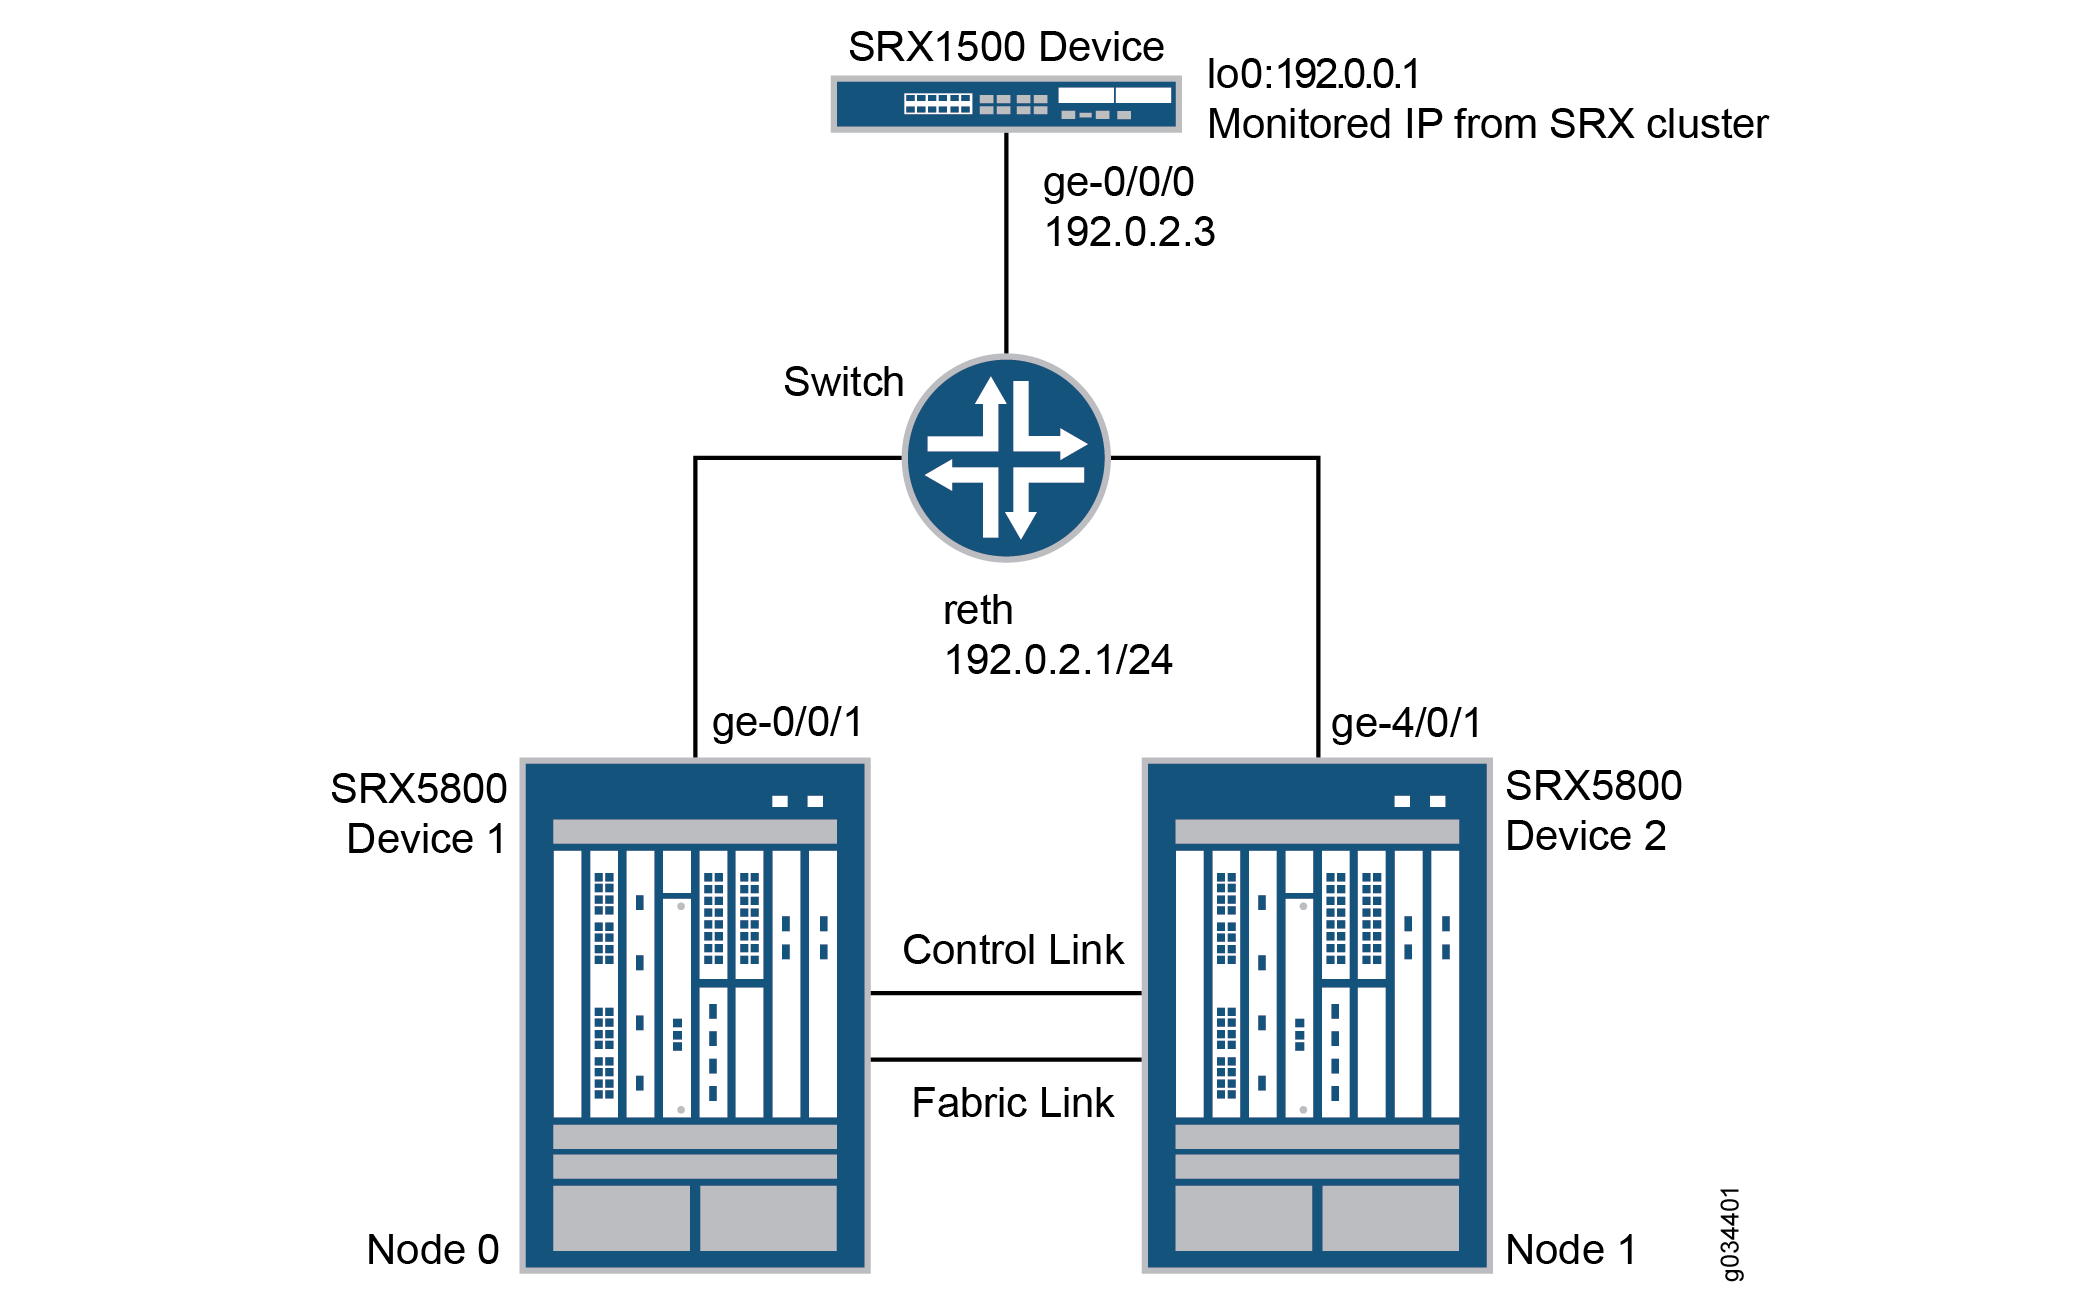
In this example, two SRX5800 devices in a chassis cluster are connected to an SRX1500 device through an Ethernet switch. The example shows how the redundancy groups can be configured to monitor key upstream resources reachable through redundant Ethernet interfaces on either node in a cluster.
Configuration
CLI Quick Configuration
To quickly configure this example, copy the
following commands, paste them into a text file, remove any line breaks,
change any details to match your network configuration, copy and paste
the commands into the CLI at the [edit] hierarchy level,
and then enter commit from configuration mode.
set chassis cluster reth-count 1
set chassis cluster redundancy-group 0 node 0 priority 254
set chassis cluster redundancy-group 0 node 1 priority 1
set chassis cluster redundancy-group 1 node 0 priority 200
set chassis cluster redundancy-group 1 node 1 priority 199
set chassis cluster redundancy-group 1 ip-monitoring global-weight 255
set chassis cluster redundancy-group 1 ip-monitoring global-threshold 80
set chassis cluster redundancy-group 1 ip-monitoring retry-interval 3
set chassis cluster redundancy-group 1 ip-monitoring retry-count 10
set chassis cluster redundancy-group 1 ip-monitoring family inet 192.0.0.1 weight 80
set chassis cluster redundancy-group 1 ip-monitoring family inet 192.0.0.1 interface reth0.0 secondary-ip-address 192.0.2.2
set interfaces ge-0/0/1 gigether-options redundant-parent reth0
set interfaces ge-4/0/1 gigether-options redundant-parent reth0
set interfaces reth0 redundant-ether-options redundancy-group 1
set interfaces reth0 unit 0 family inet address 192.0.2.1/24
set routing-options static route 192.0.0.1/32 next-hop 192.0.2.3
Configuring IP Monitoring on SRX Series Firewall
Step-by-Step Procedure
The following example requires you to navigate various levels in the configuration hierarchy. For instructions on how to do that, see Using the CLI Editor in Configuration Mode in the Junos OS CLI User Guide .
To configure IP monitoring on an SRX Series Firewall:
-
Specify the number of redundant Ethernet interfaces.
{primary:node0}[edit] user@host# set chassis cluster reth-count 1 -
Specify a redundancy group's priority for primacy on each node of the cluster. The higher number takes precedence.
{primary:node0}[edit] user@host# set chassis cluster redundancy-group 0 node 0 priority 254 user@host# set chassis cluster redundancy-group 0 node 1 priority 1 user@host# set chassis cluster redundancy-group 1 node 0 priority 200 user@host# set chassis cluster redundancy-group 1 node 1 priority 199 -
Configure the redundant Ethernet interfaces to redundancy-group 1.
{primary:node0}[edit] user@host# set interfaces reth0 redundant-ether-options redundancy-group 1 user@host# set interfaces reth0 unit 0 family inet address 192.0.2.1/24 -
Assign child interfaces for the redundant Ethernet interfaces from node 0 and node 1.
{primary:node0}[edit] user@host# set interfaces ge-0/0/1 gigether-options redundant-parent reth0 user@host# set interfaces ge-4/0/1 gigether-options redundant-parent reth0 -
Configure the static route to the IP address that is to be monitored.
{primary:node0}[edit] user@host# set routing-options static route 192.0.0.1/32 next-hop 192.0.2.3 -
Configure IP monitoring under redundancy-group 1 with global weight and global threshold.
{primary:node0}[edit] user@host# set chassis cluster redundancy-group 1 ip-monitoring global-weight 255 user@host# set chassis cluster redundancy-group 1 ip-monitoring global-threshold 80 -
Specify the retry interval.
{primary:node0}[edit] user@host# set chassis cluster redundancy-group 1 ip-monitoring retry-interval 3 -
Specify the retry count.
{primary:node0}[edit] user@host# set chassis cluster redundancy-group 1 ip-monitoring retry-count 10 -
Assign a weight to the IP address to be monitored, and configure a secondary IP address that will be used to send ICMP packets from the secondary node to track the IP being monitored.
{primary:node0}[edit] user@host# set chassis cluster redundancy-group 1 ip-monitoring family inet 192.0.0.1 weight 80 user@host# set chassis cluster redundancy-group 1 ip-monitoring family inet 192.0.0.1 interface reth0.0 secondary-ip-address 192.0.2.2Note:-
The redundant Ethernet (reth0) IP address, 192.0.2.1/24, is used to send ICMP packets from node 0 to check the reachability of the monitored IP.
-
The secondary IP address, 192.0.2.2, should belong to the same network as the reth0 IP address.
-
The secondary IP address is used to send ICMP packets from node 1 to check the reachability of the monitored IP.
-
Verification
Confirm the configuration is working properly.
- Verifying Chassis Cluster Status— Before Failover
- Verifying Chassis Cluster IP Monitoring Status— Before Failover
- Verifying Chassis Cluster Status— After Failover
- Verifying Chassis Cluster IP Monitoring Status— After Failover
Verifying Chassis Cluster Status— Before Failover
Purpose
Verify the chassis cluster status, failover status, and redundancy group information before failover.
Action
From operational mode, enter the show chassis cluster
status command.
show chassis cluster status Cluster ID: 11 Node Priority Status Preempt Manual failover Redundancy group: 0 , Failover count: 0 node0 254 primary no no node1 1 secondary no no Redundancy group: 1 , Failover count: 0 node0 200 primary no no node1 199 secondary no no
Verifying Chassis Cluster IP Monitoring Status— Before Failover
Purpose
Verify the IP status being monitored from both nodes and the failover count for both nodes before failover.
Action
From operational mode, enter the show chassis cluster
ip-monitoring status redundancy-group 1 command.
show chassis cluster ip-monitoring status redundancy-group 1 node0: -------------------------------------------------------------------------- Redundancy group: 1 IP address Status Failure count Reason 192.0.0.1 reachable 0 n/a node1: -------------------------------------------------------------------------- Redundancy group: 1 IP address Status Failure count Reason 192.0.0.1 reachable 0 n/a
Verifying Chassis Cluster Status— After Failover
Purpose
Verify the chassis cluster status, failover status, and redundancy group information after failover.
If the IP address is not reachable, the following output will be displayed.
Action
From operational mode, enter the show chassis cluster
status command.
show chassis cluster status Cluster ID: 11 Node Priority Status Preempt Manual failover Redundancy group: 0 , Failover count: 0 node0 254 primary no no node1 1 secondary no no Redundancy group: 1 , Failover count: 1 node0 0 secondary no no node1 199 primary no no
Verifying Chassis Cluster IP Monitoring Status— After Failover
Purpose
Verify the IP status being monitored from both nodes and the failover count for both nodes after failover.
Action
From operational mode, enter the show chassis cluster
ip-monitoring status redundancy-group 1 command.
show chassis cluster ip-monitoring status redundancy-group 1 node0: -------------------------------------------------------------------------- Redundancy group: 1 IP address Status Failure count Reason 192.0.0.1 unreachable 1 unknown node1: -------------------------------------------------------------------------- Redundancy group: 1 IP address Status Failure count Reason 192.0.0.1 reachable 0 n/a