ON THIS PAGE
Example: Configure sFlow Technology to Monitor Network Traffic
This example describes how to configure and use sFlow technology to monitor network traffic.
Requirements
You can use routers and switches for the example using the following hardware and software components:
-
One EX Series switch running any supported Junos OS.
-
One MX Series router running any supported Junos OS.
-
One QFX Series switch running any supported Junos OS.
Topology
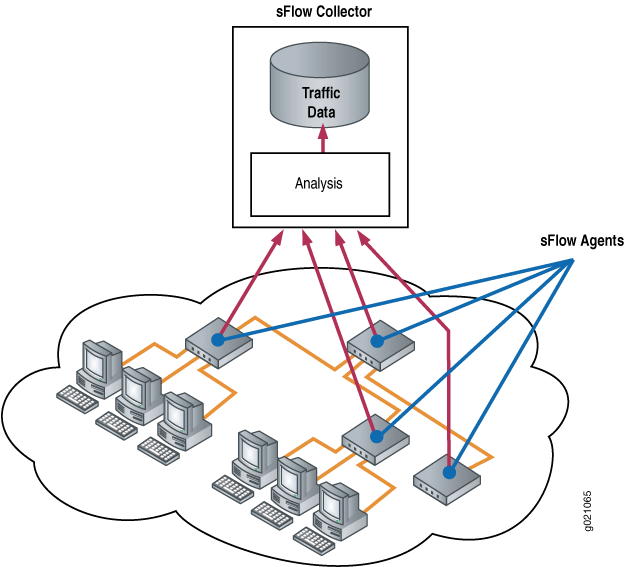
sFlow, a high-speed network monitoring technology, samples packets and transmits them in UDP datagrams to a collector, ensuring continuous traffic monitoring on all interfaces. You must enable sFlow monitoring on each interface individually. The sFlow agent on switches combines interface counters and flow samples, and forward raw packet headers to the collectors. The current version of sFlow is version 5 that transports the sampled data to the sFlow collector.
Figure 1 depicts the basic elements of the sFlow system.

Configuration
To configure sFlow technology, perform the following tasks:
CLI Quick Configuration
To quickly configure sFlow technology, copy the following commands and paste them into the switch terminal window:
[edit protocols]
set sflow collector 10.204.32.46 udp-port 5600
set sflow interfaces ge-0/0/0
set sflow polling-interval 20
set sflow sample-rate egress 1000
Procedure
Step-by-Step Procedure
To configure sFlow technology:
-
Configure the IP address and UDP port of the collector:
[edit protocols]
user@switch# set sflow collector 10.204.32.46 udp-port 5600
Note:You can configure a maximum of 4 collectors.
The default UDP port is 6343.
-
Enable sFlow technology on a specific interface:
[edit protocols sflow]
user@switch# set interfaces ge-0/0/0
Note:You cannot enable sFlow technology on a Layer 3 VLAN-tagged interface.
-
Specify in seconds how often the sFlow agent polls the interface:
[edit protocols sflow]
user@switch# set polling-interval 20
Note:The polling interval can be specified as a global parameter also. Specify 0 if you do not want to poll the interface.
-
Specify the rate at which egress packets must be sampled:
[edit protocols sflow]
user@switch# set sample-rate egress 1000
Note:You can specify both egress and ingress sampling rates. If you set only the egress sampling rate, the ingress sampling rate will be disabled.
Note:We recommend that you configure the same sampling rates on all the ports on a line card. If you configure different sampling rates are different, the lowest value is used for all ports. You could still configure different rates on different line cards.
- (Optional) Specify the sample size for the raw packet header.
[edit protocols sflow]
user@switch# set sample-size 135
Results
Check the results of the configuration:
[edit protocols sflow]
user@switch# show

polling-interval 20;
    sample-rate egress 1000;
    collector 10.204.32.46 {
        udp-port 5600;
    }
interfaces ge-0/0/0.0;
[edit protocols sflow]
user@router# show
polling-interval 20;
source-ip 45.1.1.1;
collector 45.1.1.100;
sample-size 135;
Verification
To confirm that the configuration is correct, perform these tasks:
- Verifying That sFlow Technology Is Configured Properly
- Verifying That sFlow Technology Is Enabled on the Specified Interface
- Verifying the sFlow Collector Configuration
Verifying That sFlow Technology Is Configured Properly
Purpose
Verify that sFlow technology is configured properly.
Action
Use the show sflow command:
user@switch> show sflow
sFlow: Enabled
Sample limit: 300 packets/second
Polling interval: 20 seconds
Sample rate egress: 1:1000: Enabled
Sample rate ingress: 1:2048: Disabled
Agent ID: 10.204.96.222
user@router> show sflow
sFlow                   : Enabled
Adaptive fallback       : False
Sample limit            : 2000 packets/second
Sample limit Threshold  : 0 packets/second
Polling interval        : 20 second
Sample rate egress      : 1:2048:Disabled
Sample rate ingress     : 1:2048:Disabled
Agent ID                : 10.204.96.222
Agent ID IPv6           : No valid agent IPv6
Source IP address       : 45.1.1.1
Source IPv6 address     : No valid source IPv6
Sample Size             : 128 Bytes
The sampling limit cannot be configured and is set to 300 packets/second per FPC.
Meaning
The output shows that sFlow technology is enabled and specifies the values for the sampling limit, polling interval, and the egress sampling rate.
Verifying That sFlow Technology Is Enabled on the Specified Interface
Purpose
Verify that sFlow technology is enabled on the specified interfaces and display the sampling parameters.
Action
Use the show sflow interface command:
user@switch> show sflow interface
Interface        Status      Sample rate    Adapted sample rate   Polling-interval
            Egress Ingress   Egress Ingress   Egress Ingress
ge-0/0/0.0  Enabled  Disabled  1000    2048    1000     2048            20
Meaning
The output indicates that sFlow technology is enabled on the ge-0/0/0.0 interface with an egress sampling rate of 1000, a disabled ingress sampling rate, and a polling interval of 20 seconds.
Verifying the sFlow Collector Configuration
Purpose
Verify the sFlow collector's configuration.
Action
Use the show sflow collector command:
user@switch> show sflow collector

Collector         Udp-port    No. of samples
 address
10.204.32.46      5600        1000
10.204.32.76      3400        1000
user@router> show sflow collector
Collector                                  Udp-port    Dscp     Forwarding-Class                No. of samples
 address
45.1.1.100                                 6343        0        best-effort                     0
Meaning
The output displays the IP address of the collectors and the UDP ports. It also displays the number of samples.
