Switch Metrics
Get familiar with the metrics that you can use to monitor your switches and address issues with excess APs, over-allocated PoE, low uptime, and more.
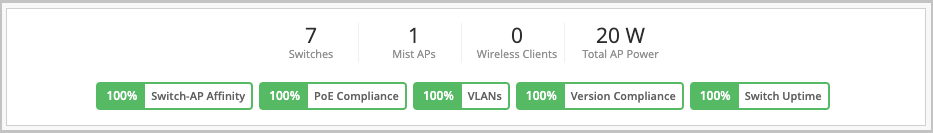
The metrics on the Switches page help you track the switch performance against certain compliance parameters.
To view switch metrics, click Switches on the left navigation pane on the Mist portal. Metrics for which there is no data appear grey (usually, because the feature has not been configured).
Here's a list of the switch metrics you can track:
-
Switch-AP Affinity—This indicator shows the weighted percentage of the switches for which the number of APs connected exceeds the threshold configured. By default, the Switch-AP Affinity threshold is set to 12 APs per switch. You can configure a threshold value for the number of APs per switch to be considered in the Switch-AP Affinity metric calculation. To configure the AP threshold, click the Switch-AP Affinity indicator, and then click the hamburger icon on the right of the Switch-AP Affinity section.
-
PoE Compliance—This indicator shows the percentage of APs that have the required 802.3at power. PoE compliance is impacted when the APs draw more power from the switch than what is allocated.
-
VLANs—This indicator shows the percentage of APs for which all the wired VLANs are active. Click this indicator to view the list of switches and APs that have inactive or missing VLANs, along with the port information.
-
Version Compliance— This indicator shows the percentage of switches that have the same Junos software version (per switch model). To achieve 100 percent version compliance, you must ensure that all the switches in your site run the same Junos version per switch model.
-
Switch Uptime—This indicator shows the percentage of time a switch was up during the past seven days, averaged across all switches. Click this indicator to view the list of switches that had less than 100 percent uptime during the past 7 days.
You can click each of the switch metric indicators to get a filtered view and quickly access each device dashboard.
For more details on the switch metrics, watch the following video:
The Switches tab is where you can get all the wired health metrics. Switches in grey are being discovered, while green indicates that the switch is online and fully managed by the Juniper Mist cloud. The metrics at the top provide a high-level sense of how the switches below are doing.
Non-Juniper switches are still accounted for and can get wired visibility via LLDP by connecting a Juniper access point and MARVIS. These health metrics include switch AP affinity, meaning do you have too many APs connected to a switch? PoE compliance, are the APs getting enough power? Other metrics shown include VLANs, version compliance, and switch uptime. Aside from the list view, you can also choose to see the switches in a topology or location view.
The topology view is an interactive way to see all your switches and the APs connected to them. The location view shows a map of where all the switches are located. Whether you have Juniper EXs or third-party platforms, Wired Assurance delivers the wired visibility and health metrics to give you a good pulse on how the network is doing.