QBA Exporatory Interface
Juniper Apstra release 5.0 introduces an exploratory analytics interface that enables you to explore and visualize data sets using the Query-Based Analytics (QBA) language. This feature enables you to analyze large sets of data and discover correlations or previously unknown data patterns about key aspects of your network infrastructure.
This feature has been classified as a Juniper Apstra Technology Preview feature. These features are "as is" and voluntary use. Juniper Support will attempt to resolve any issues that customers experience when using these features and create bug reports on behalf of support cases. However, Juniper may not provide comprehensive support services to Tech Preview features.
For additional information, refer to the Juniper Apstra Technology Previews page or contact Juniper Support.
Query-Based Analytics Overview
Juniper Apstra release 5.0 enhances IBA with the introduction of a Query-Based Analytics (QBA) interface. QBA is a unified-query interface for interacting with various data sources within Apstra. Apstra generates various kinds of data about the Datacenter (DC). This data is stored in different databases, either in-memory or on-disk. The interface lets you query and associate data from different sources for troubleshooting or data analytics.
The QBA Exploratory Interface is a GUI tool that lets you perform your own data analysis with powerful queries and data visualization options using QBA. You can use the exploratory interface to systematically build queries, then choose an intuitive visualization option. After Apstra visualizes the data, you can experiment with various transformations (statistical operators) on the data to shape and manipulate the data as you see fit.
For example, let’s say you’re interested in the average TX utilization of a switch. Using the interface, you can visualize this metric in many different aggregation intervals, from a maximum of 30 days all the way down to the minute. You can limit your queries to certain interfaces and system IDs (system_id). After you submit the query, the query visualization tab on the right-hand side of the page populates. You can select from the following visualization options:
-
Line Chart: Visualizes changes in numeric values over intervals of time. Data points are connected with straight lines.
-
Area Chart: Visualizes changes in numeric values over intervals of time. Similar to a line chart, but the space between the x-axis and the plotted line is filled in.
-
Stacked Area Chart: Visualizes changes in groups of data over intervals of time. Similar to an area chart, except the data for each group is displayed, or stacked, on top of each other.
-
Scatterplot: Visualizes the relationship between two numeric values. The x-axis represents the value of the first data point, and the y-axis represents the value of the second data point.
-
Pie Chart: Visualizes percentages (portions) of data in relation to a whole value (100%).
-
Donut Chart: Visualizes the value of different portions of data in relation to a whole.
You can also view the data with the following output options:
-
Table
-
Time-Series Table
-
JSON
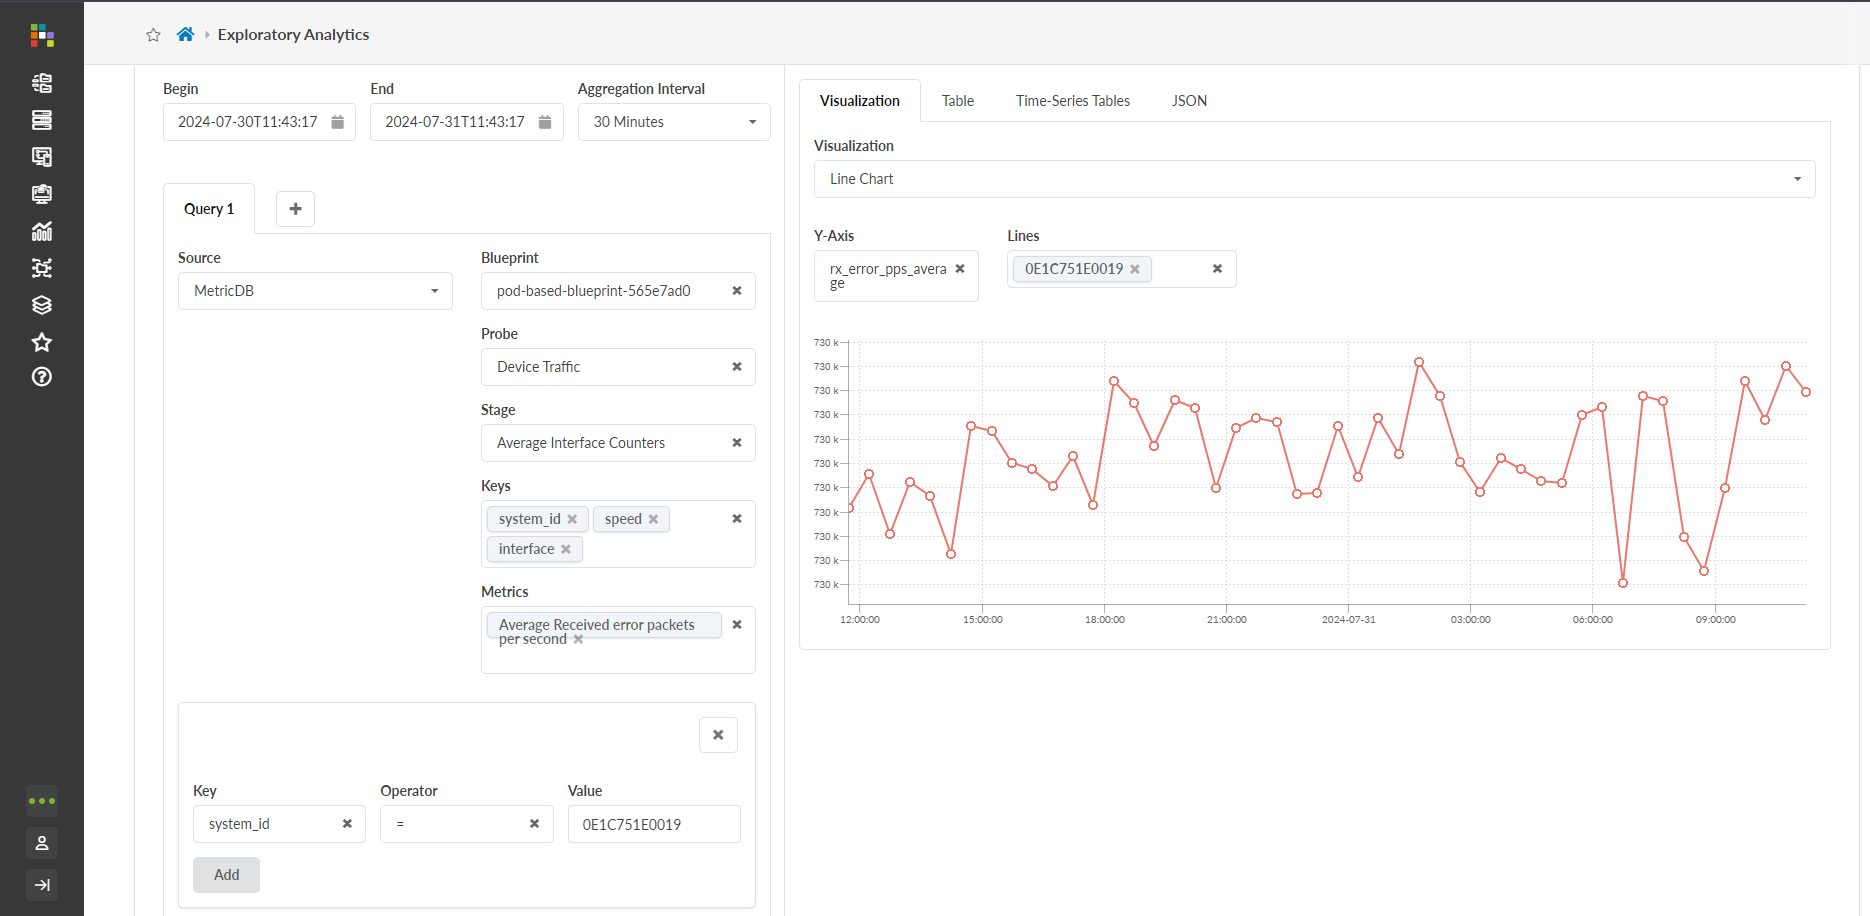
After selecting a visualization method, you can manipulate the chart by selecting system ID’s of devices you are interested in. You can also choose different x-axis and y-axis options. Selecting the Show Trend Line option plots the points of the chart with a line for better trend visualization.
Query Sources
With the exploratory interface, you can query different types of data from different sources across your managed devices.
MetricDb
MetricDb is a Juniper Apstra proprietary time-series database. Apstra components such as IBA, Audit, Anomaly, and System-Resource-Monitoring use MetricDb to store time-series/historic data about various aspects of the DC. This data includes network-traffic features (i.e. interface-counters, ecmp-imbalance etc.), device-health features (i.e. CPU usage), memory usage, temperature, power, transceiver stats, Controller features (i.e. audit, anomalies etc). When querying MetricDb, the ‘locator’ attribute specifies which of the previously mentioned graph sources to use. We recommend that you use ‘operational’ graph for QBA queries.
Graph
Apstra Graph database (Blueprint) is a knowledge-base of the running-state of the DC. Graph represents a single source of truth regarding infrastructure, policies, constraints etc. Apstra maintains the following copies of the graph:
-
Config: Captures user intent in the form of security policies, preferred routes, network requirements etc.
-
Staging: Represents the config graph plus the translation of the intent into automated administrative tasks across the DC.
-
Operational: Captures the current running state of the DC.
The following is an example graph query:
graph_query = {
    "name": "graph",
    "from": {
        "source": "persisted_sysdb_files",
        "locator": ["{}/{}".format(base_dir, sysdb_stem),
                    blueprint_id,
                    "operation"]
    },
    "filter": "node('system', name='system', role=is_in(['leaf', 'spine']), deploy_mode='deploy').out('part_of_pod').node('pod', name='pod')",
    "select": {
        "keys": {
            "system_id": ["system", "system_id"],
        },
        "data": {
            "label": ["system", "label"],
            "role": ["system", "role"],
            "deploy_mode": ["system", "deploy_mode"],
            "pod_label": ["pod", "label"],
        }
    }
}
Note that the ‘locator’ parameter generally refers to “operational” graph. For more information about graph, see Graph.
As an example, let’s build a query that fetches data from these two data sources. Let’s say we want to improve the current DC inventory of optical transcievers, and gain insight into the most efficient maintenance windows for optical transceivers. We suspect that by visualizing temperature trends of the transceivers, we may be able to learn more and leverage this knowledge to anticipate failures or compare vendors.
We don't necessarily have a clear idea of what we're looking for, but we want to explore the data. We know that the Apstra IBA “Optical-transceiver” probe monitors various stats like temperature, power etc. from all optical transceivers in the DC. Within the stage of this probe, metricDb is enabled and collecting historical data. We can use the ‘2min-avg’ stage metric to collect ‘model’, ‘vendor’, and ‘temperature’ data. Additionally, we can customize this data fo rour needs using ‘hostname’, ‘role’, ‘label', and ‘ipv4_addr’ information about the system from Graph.
By combining these two data sources, we can classify the data per (system, interface) pair and plot a the trend of temperature variables over the last week, month, or year, based on data availability. The Exploratory interface tool is the GUI-based builder for queries like this. The example below shows this query in JSON format.
Advanced users might choose to bypass the Exploratory interface and make direct updates to the query instead. In such cases, you can run queries manually using ‘/api/qba/query’ rest-api endpoint. Note that this query comprises three subqueries:
-
Subquery for MetricDb metric ‘Optical probe, 2min-avg’ stage
-
Graph subquery
-
Final subquery that combines the prior two subquery results to form the final, aggregated results
This query output can be plotted as a line graph to visualize trends. After the data is visualized, you can explore the information as you see fit. You might compare the data based on vendor, or any number of optical transceiver stats.
query = [
    # metric db query
    {
        # sub query can be referenced by name
        "name": "xcvr_metricdb",
        "from": {
            "source": "metricdb",
            "locator": ["iba", "sf-pod", "xcvr_probe", "2min-avg"],
            "between": {
                "begin": "2022-08-20T05:00:00",
                "end": "2022-08-27T05:00:00",
                "aggregation_interval": 3600
            }
        },
        "select" : {
            "keys": {
                "system": "system",
                "interface": "interface",
            },
            "data": {
                "model": "model",
                "vendor": "vendor",
                "temp": "temperature"
            }
        },
        "filter": [
            "or",
            ["=", "vendor", "juniper"],
            ["=", "vendor", "arista"]
        ],
    },

    # graph query
    {
        # sub query can be referenced by name
        "name": "graph",
        "from": {
            "source": "graph",
            "locator": ["sf-pod", "operational"]
        },
        "select" : {
            "keys": {
                "system_id": ["@", "system", "system_id"],
                "ifc_name": ["@", "interface", "if_name"]
            },
            "data": {
                "hostname": ["@", "system", "hostanme"],
                "role": ["@", "system", "role"],
                "label": ["@", "interface", "label"],
                "ipv4_addr": ["@", "interface", "ipv4_addr"]
            }
        },
        "filter": "node('system', name='system', system_id=not_none())."
              "out('hosted_interfaces')."
              "node('interface', name='interface')",
        "ordered": [
            {"system_id": "ascending"},
            {"ifc_name": "ascending"}
        ]
    },

    # To combine the above two query results, and show how
    # each interface’s temperature is trending using simple
    # linear regression. And sort the result in descending
    # order, i.e. the one with faster rising temperature
    # is placed in the front.
    {
        "from": [
            {   # result of xcvr metricdb probe query
                "source": "query",
                "name": "xcvr_metricdb"
            },
            {   # result of graph query
                "source": "query",
                "name": "graph",
                "join": {
                    "system_id": "system",
                    "ifc_name": "interface"
                }
            }
        ],
        "select" : {
            "keys": {
                "system_id": ["@", "xcvr_metricdb", "system"],
                "ifc_name": ["@", "xcvr_metricdb", "interface"]
            },
            "data": {
                "temp_trend": ["slr", ["@", "xcvr_metricdb", "temp"]],
                "Hostname": ["@", "graph", "hostname"],
                "Ipv4_addr": ["@", "graph", "ipv4_addr"]
            }
        },
        "ordered": [{"temp_trend|coef": "descending"}]
    }
]
Use the Exploratory Interface
Use the following steps to build and visualize a query with the QBA Exploratory Interface. The interface is the GUI tool that builds the query step-by-step. At each step, it lets you to build a subquery, run it, and visualize the intermediate data. You can create a chain of subqueries that transform the data shape and size to arrive at final subquery that summarizes the final data visualization. In the following steps, we use a ‘Traffic data trend analysis’ use-case to demonstrate GUI components.
-
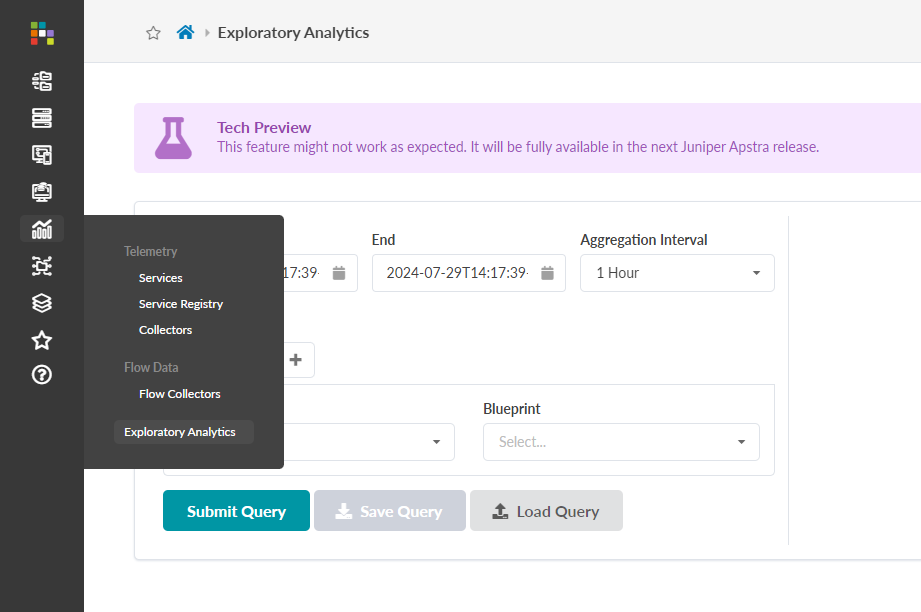
From the Apstra GUI, navigate to the interface under Analytics >
Exploratory Analytics.
-
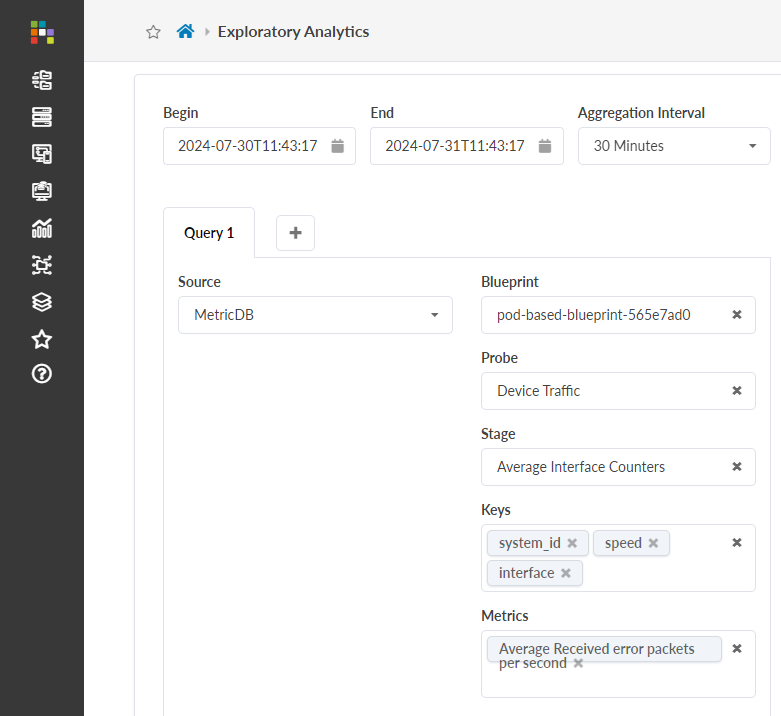
Select one or more Metrics to visualize from the dropdown.
-
(Optional) Add a Filter to narrow down the query results.
The available options are:
-
Key: An attribute that identifies a row in the resulting chart.
-
Operator: A connector that defines two conditions of a query.
-
Value: A user-defined string.
For example, the Filter
system_id = 0E1C751E0019limits the query output to the device associated with thatsystem_idvalue.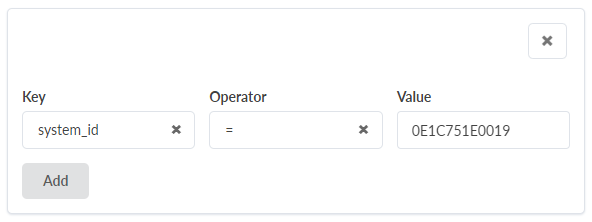
-
-
Click Submit Query, and select a Visualization option from
the dropdown on the visualization pane.
-
(Optional) Add a Transformation to the query output.
A transformation is an operation performed in the middle of a data processing pipeline. In QBA, transformations perform grouping or aggregation operations on an input table (the initial query output). The newly-aggregated data is shown in an output table.Let's use the query we've previously built above, shown in Table view, as an input table. Without any applied transformations, the input table has five columns with many rows. These rows indicate the "Average Received error packets per second (rx_error_pps_average)" for each interface associated with our specified
system_id, at a given timestamp.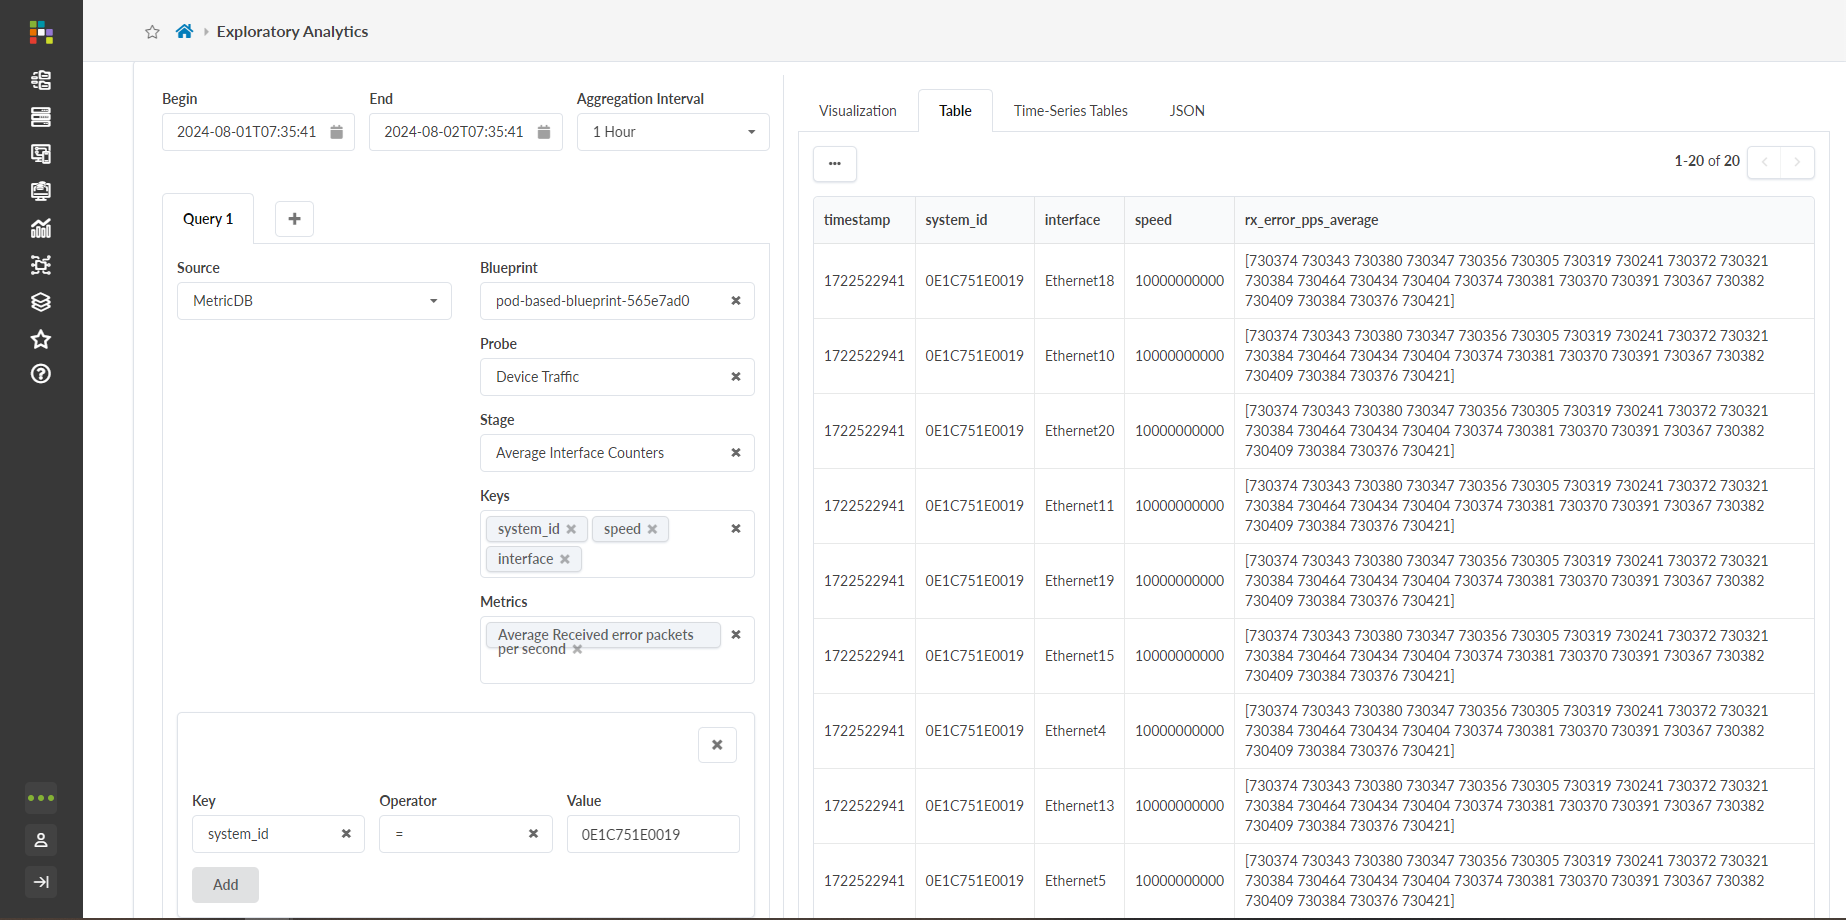 Transformations condense and filter the cells in the output table, based on data from the example input table above.
-
Simple Linear Regression (SLR): Models the linear relationship between two variables. Use SLR to predict the value of an independent variable based on the value of a dependent variable. In this example, the dependent variable (x-axis) is the average received error packets per second. The independent variable (y-axis) is the interface type. Applying an SLR transformation results in the following output:
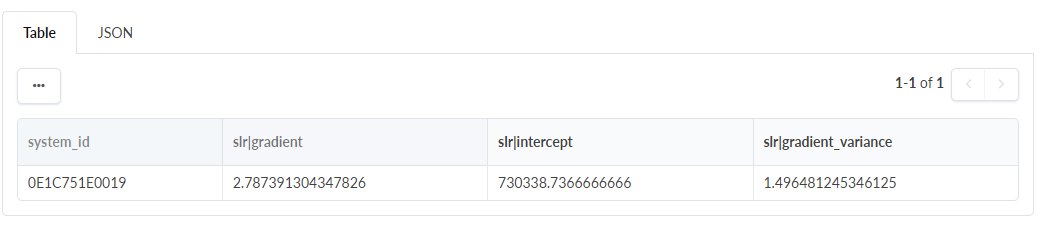
Note the table elements:
-
slr|gradient: The gradient of the regression line. Represents the rate of change of the average received error packets per second for a one-unit change in interface type.
-
slr|intercept: Where the regression line intercepts the y-axis. The value of the dependent variable when the independent variable is 0.
-
slr|gradient_variance: The variance of the gradient, or the uncertainty in the gradient estimate.
-
-
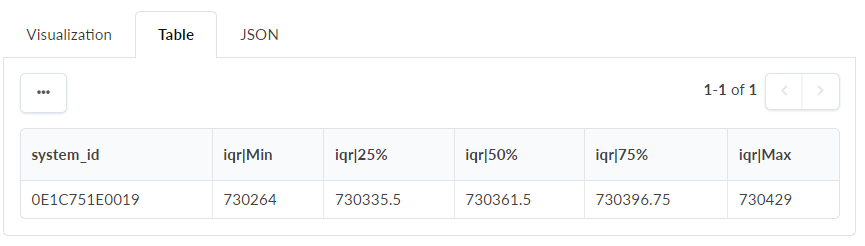
Interquartile Range (IQR): The amount of spread in the middle half (50%) of a distribution of data. Calculates the IQR on the specified column (Value) and returns five numeric columns:
-
min
-
25%
-
50%
-
75%
-
max
-
-
Most Recent: Returns the last value in the "rx_error_pps_average" column.
-
Statistical Measures: Calculates the statistics (“min”, “max”, “mean”, “median”, “mode”, standard deviation (“stddev”)) for the "rx_error_pps_average" column for each row in the input table.
-
Covariance: Calculates the covariance between the two specified columns and returns a single numeric column.
-
Count: Counts the number of rows with similar keys and stores the final count as a single variable.
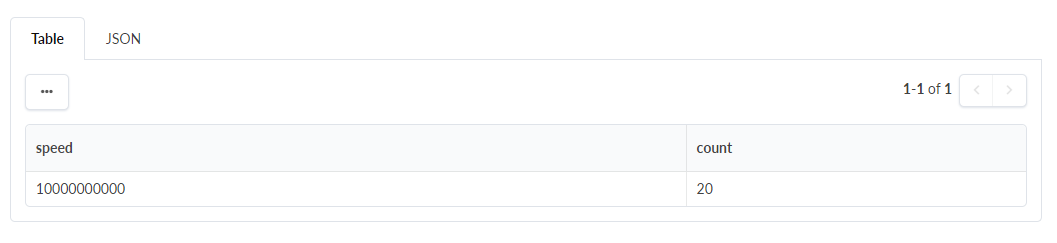
If we add a Count transformation and select a Value of the speed column, the output table is vertically condensed to display a single row with an aggregated value of interfaces with a given speed.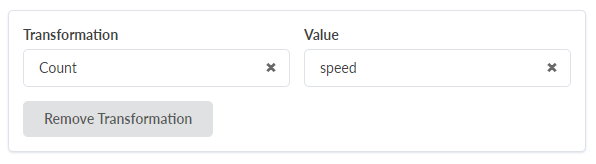
-