NSX-T Integration
VMware NSX-T Integration Overview
You can integrate NSX-T with Apstra software to help deploy fabric VLANs that are needed for deploying NSX-T in the data center or for providing connectivity between NSX-T overlay networks and fabric underlay networks. You can accelerate NSX-T deployments by making sure the fabric is ready in terms of LAG, MTU and VLAN configuration as per NSX-T transport node requirements. This feature also helps network operators with fabric visibility in terms of seeing all the NSX-T VMs, VM ports, and physical gateway ports. NSX-T integration helps identify issues on the fabric and on the virtual infrastructure. It eliminates manual config validation tasks between the NSX-T nodes side and the ToR switches.
When NSX-T VM is attached into VLAN Transport, VM query shows TOR switch/interface information together. When NSX-T VM is attached into Overlay Transport, VM query doesn't show TOR switch/interface information. Be sure to add ESXi host in generic systems, not external generic systems.
You can create Virtual Infra Managers for NSX-T Manager version 3.2.x using DVS mode. You can also add multiple Virtual Infra Managers per blueprint. This is useful when you have multiple NSX-T Managers or multiple vCenter Servers hosted in the same fabric blueprint. You'll need to provide the vCenter compute managers information (address and credentials) when you add the NSX-T Virtual Infra.
Supported Version in 5.0.0
VMware NSX/NSX-T Manager version 4.1.X
Supported Configurations
-
vCenter as virtual manager in one blueprint
-
Standalone NSX-T manager as virtual manager with vCenters added to it in one blueprint
- NSX-T Edge VM migration is supported only within a rack. Attempting to migrate between racks results in BGP disruption. You can migrate the NSX-T Edge VM from the ESXi host connected to leaf pair (that is, ToR-Leaf and ToR-Right) to the other ESXi host which is connected to single leaf with the rack.
Enable NSX-T Integration
We recommend that you create a user profile dedicated to managing NSX-T integration activities.
-
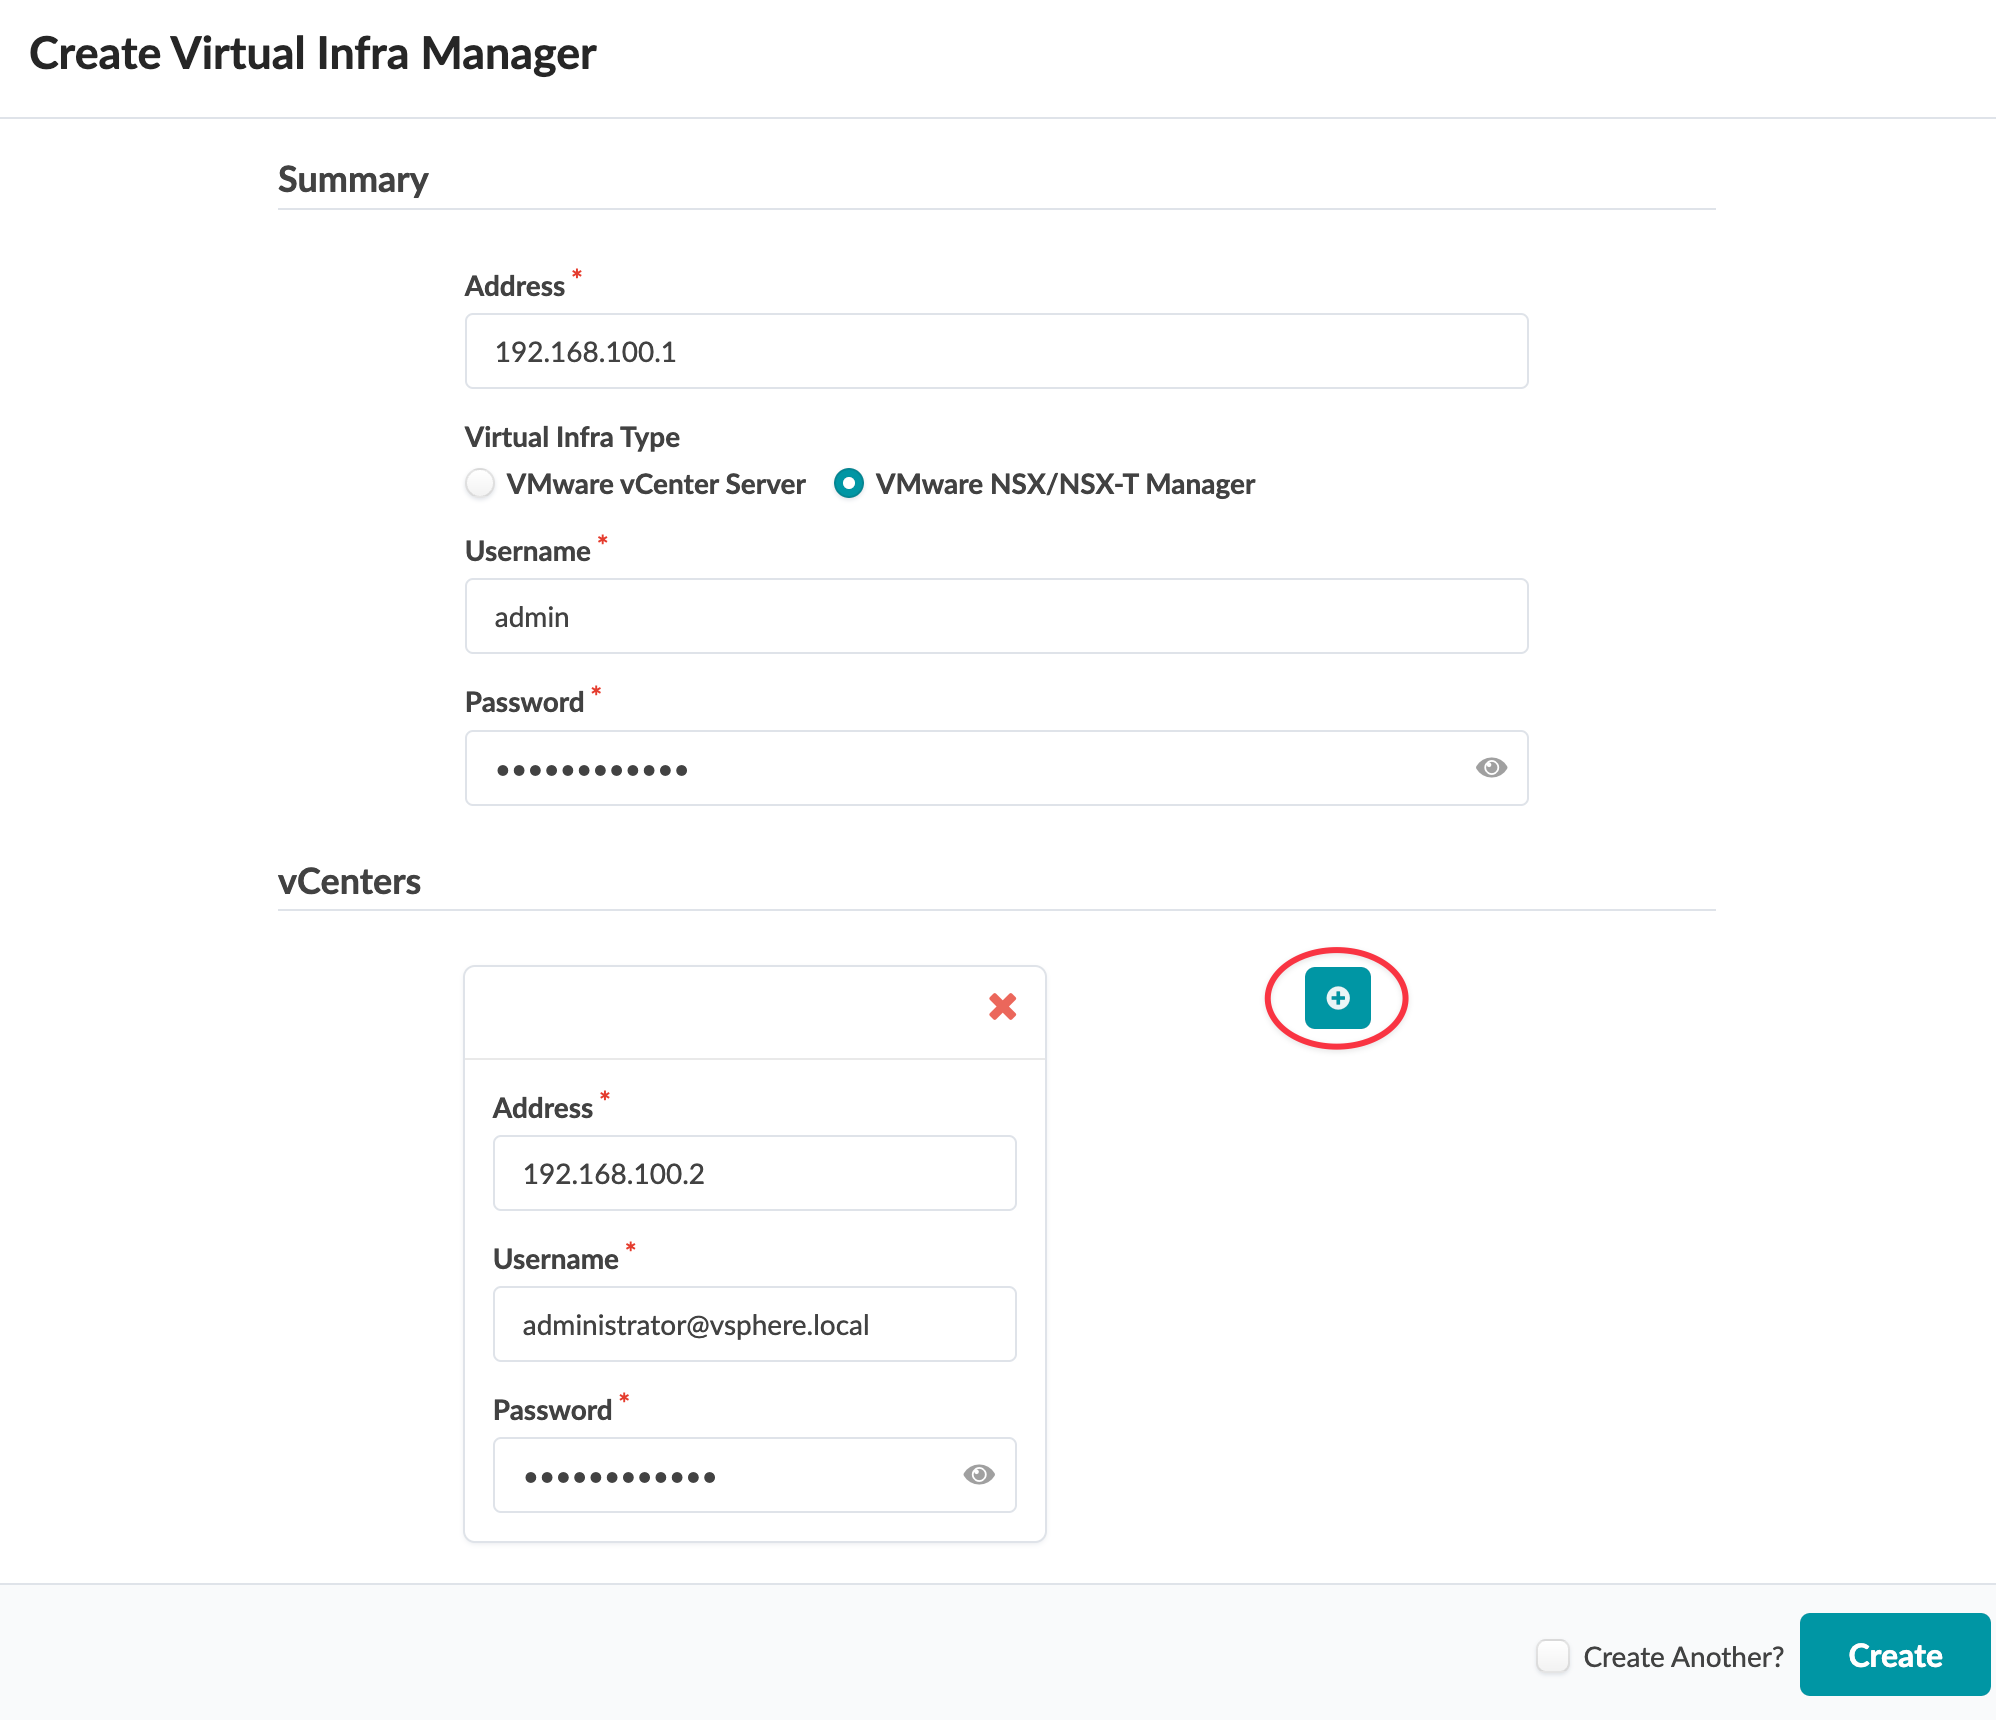
From the left navigation menu, navigate to External Systems >
Virtual Infra Managers and click Create Virtual
Infra Manager.
 The Create Virtual Infra Manager dialog opens.
 -
Enter the NSX/NSX-T manager IP address (or DNS name), select
VMware NSX/NSX-T Manager for Virtual Infra
Type and enter a username and password.
-
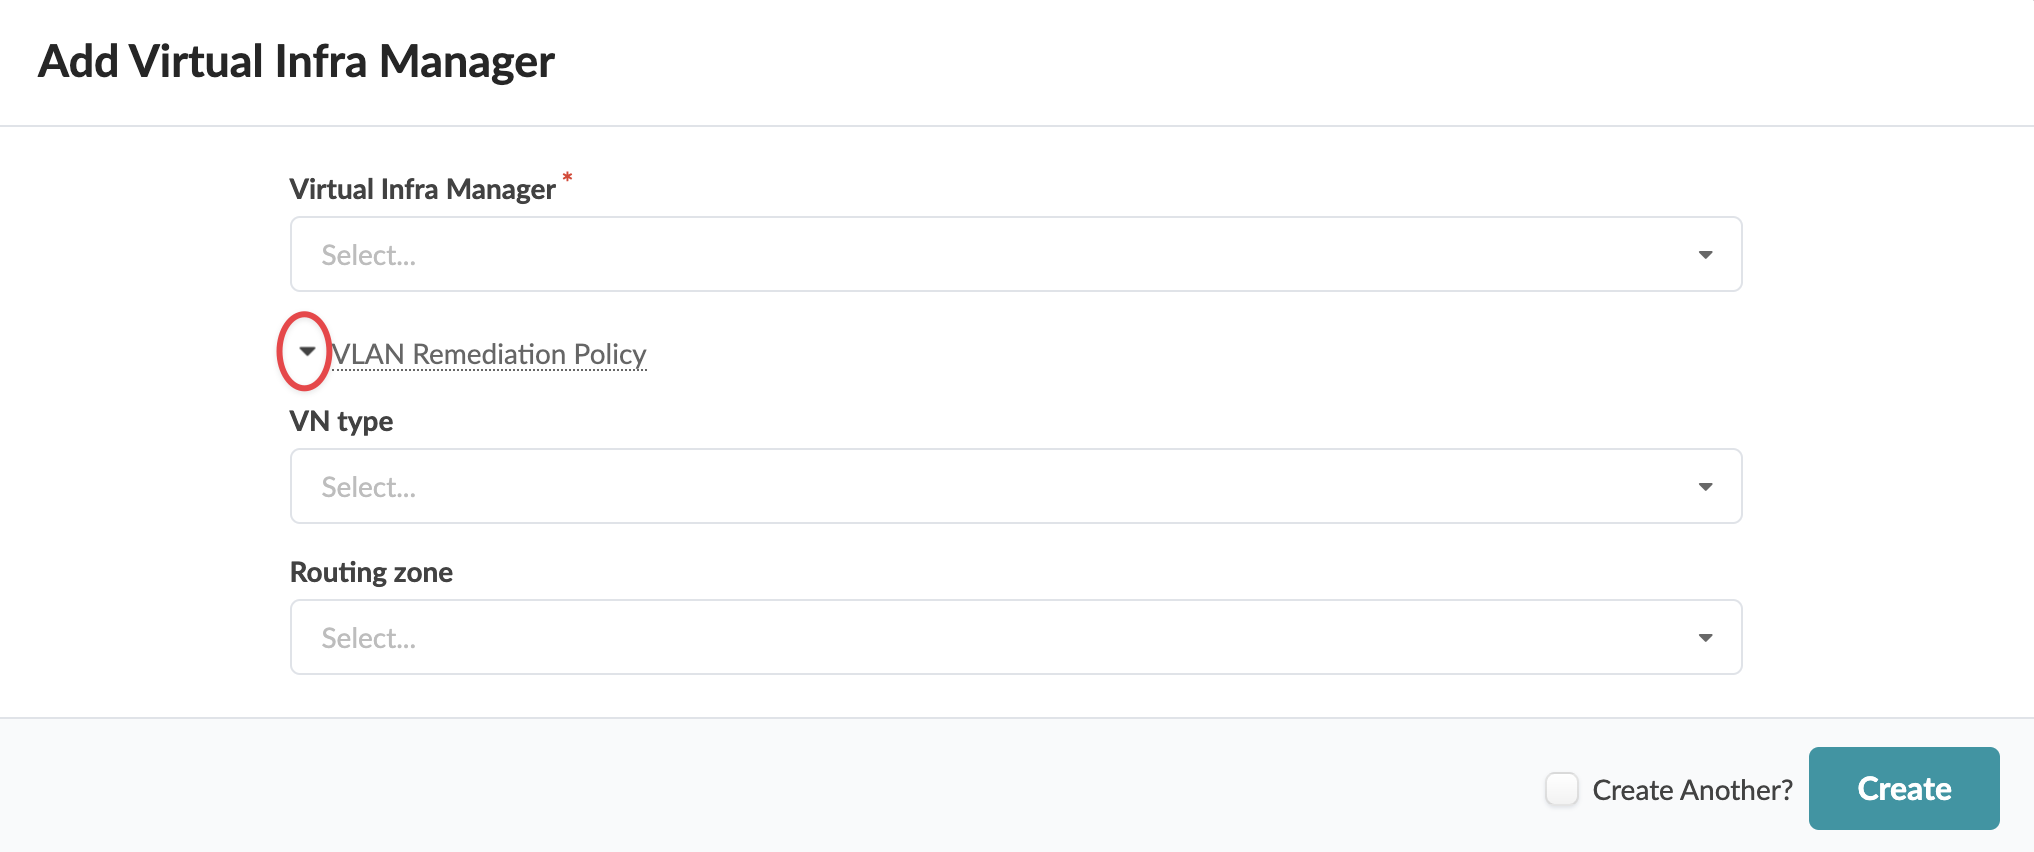
When NSX-T is connected, from the blueprint, navigate to Staged
> Virtual > Virtual Infra and click Add
Virtual Infra.
 The Add Virtual Infra Manager dialog opens.
 -
Select the NSX-T manager from the Virtual Infra
Manager drop-down list, then click VLAN Remediation
Policy to expose additional fields.
-
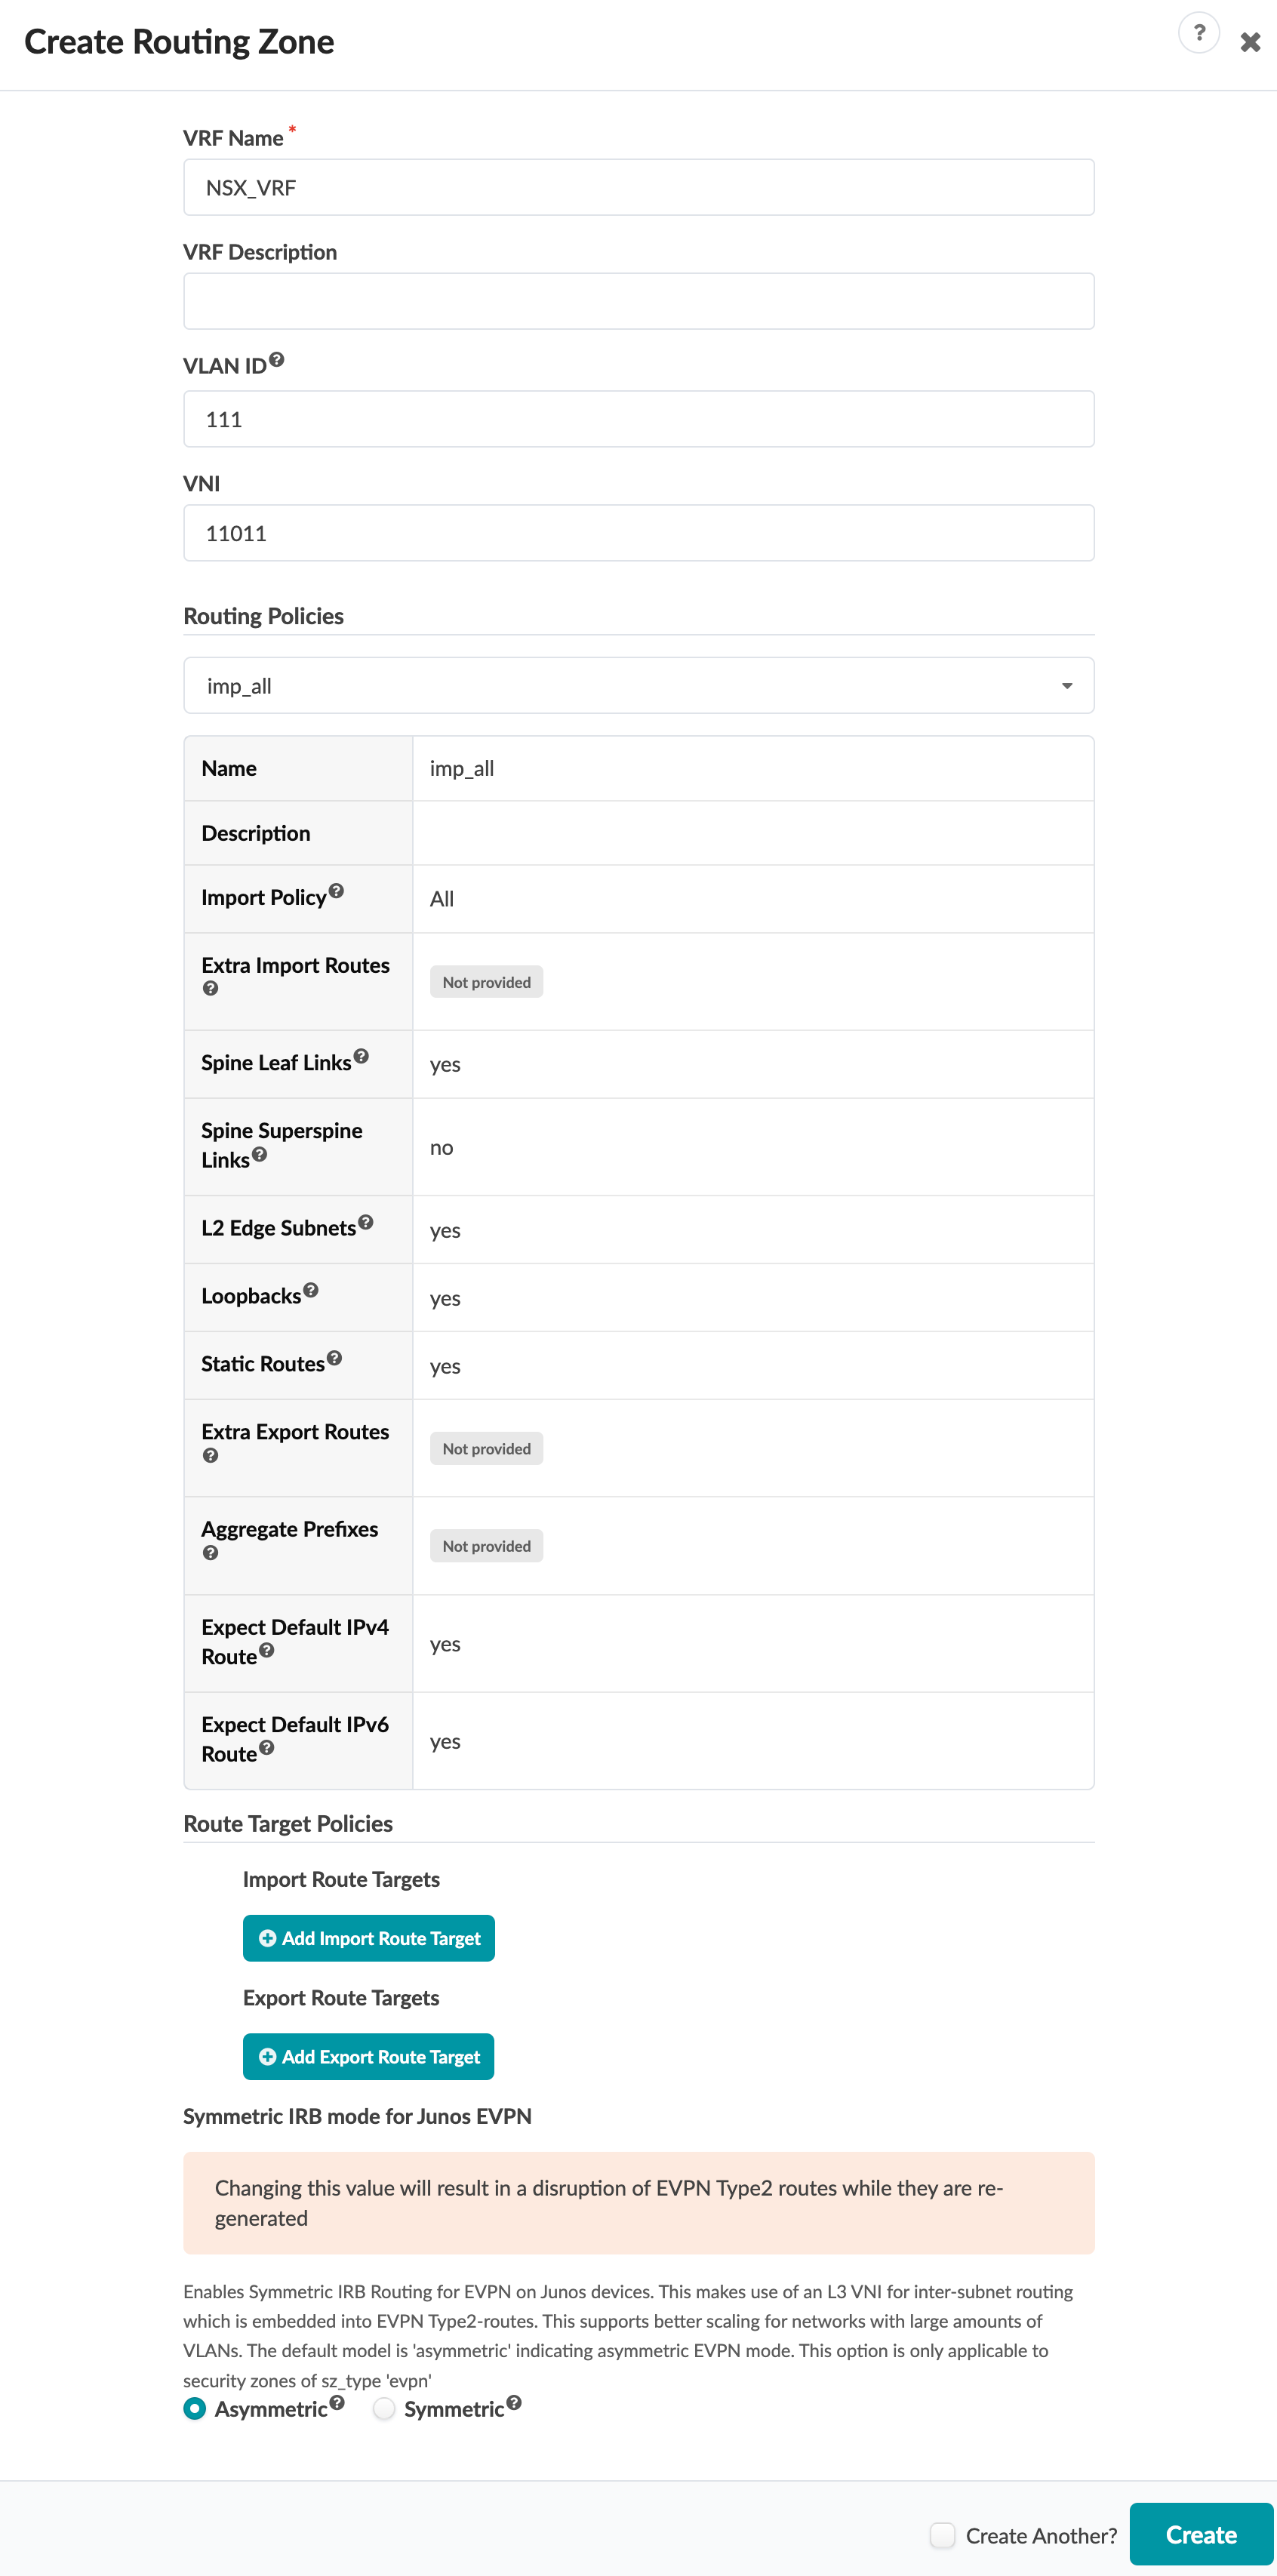
Create a Routing Zone in the blueprint and specify
the VLAN ID, VNI and
Routing Policies. Routing Zone maps to a VRF on
which BGP peering towards NSX-T Edge node is established.
-
For the GENEVE Tunnels to come up between the Transport Nodes in NSX-T,
connectivity must be established via Juniper Apstra Fabric. This will be
ensured by creating VXLAN VN in Apstra and assigning correct port mapping in
ToR leaf devices towards Transport Node. VLAN ID for Overlay VXLAN VN
defined in Apstra must match the one mapped in Overlay Profile in NSX-T for
Transport Nodes. Also, the same IP subnet as that of the TEP Pool in NSX
will be used.
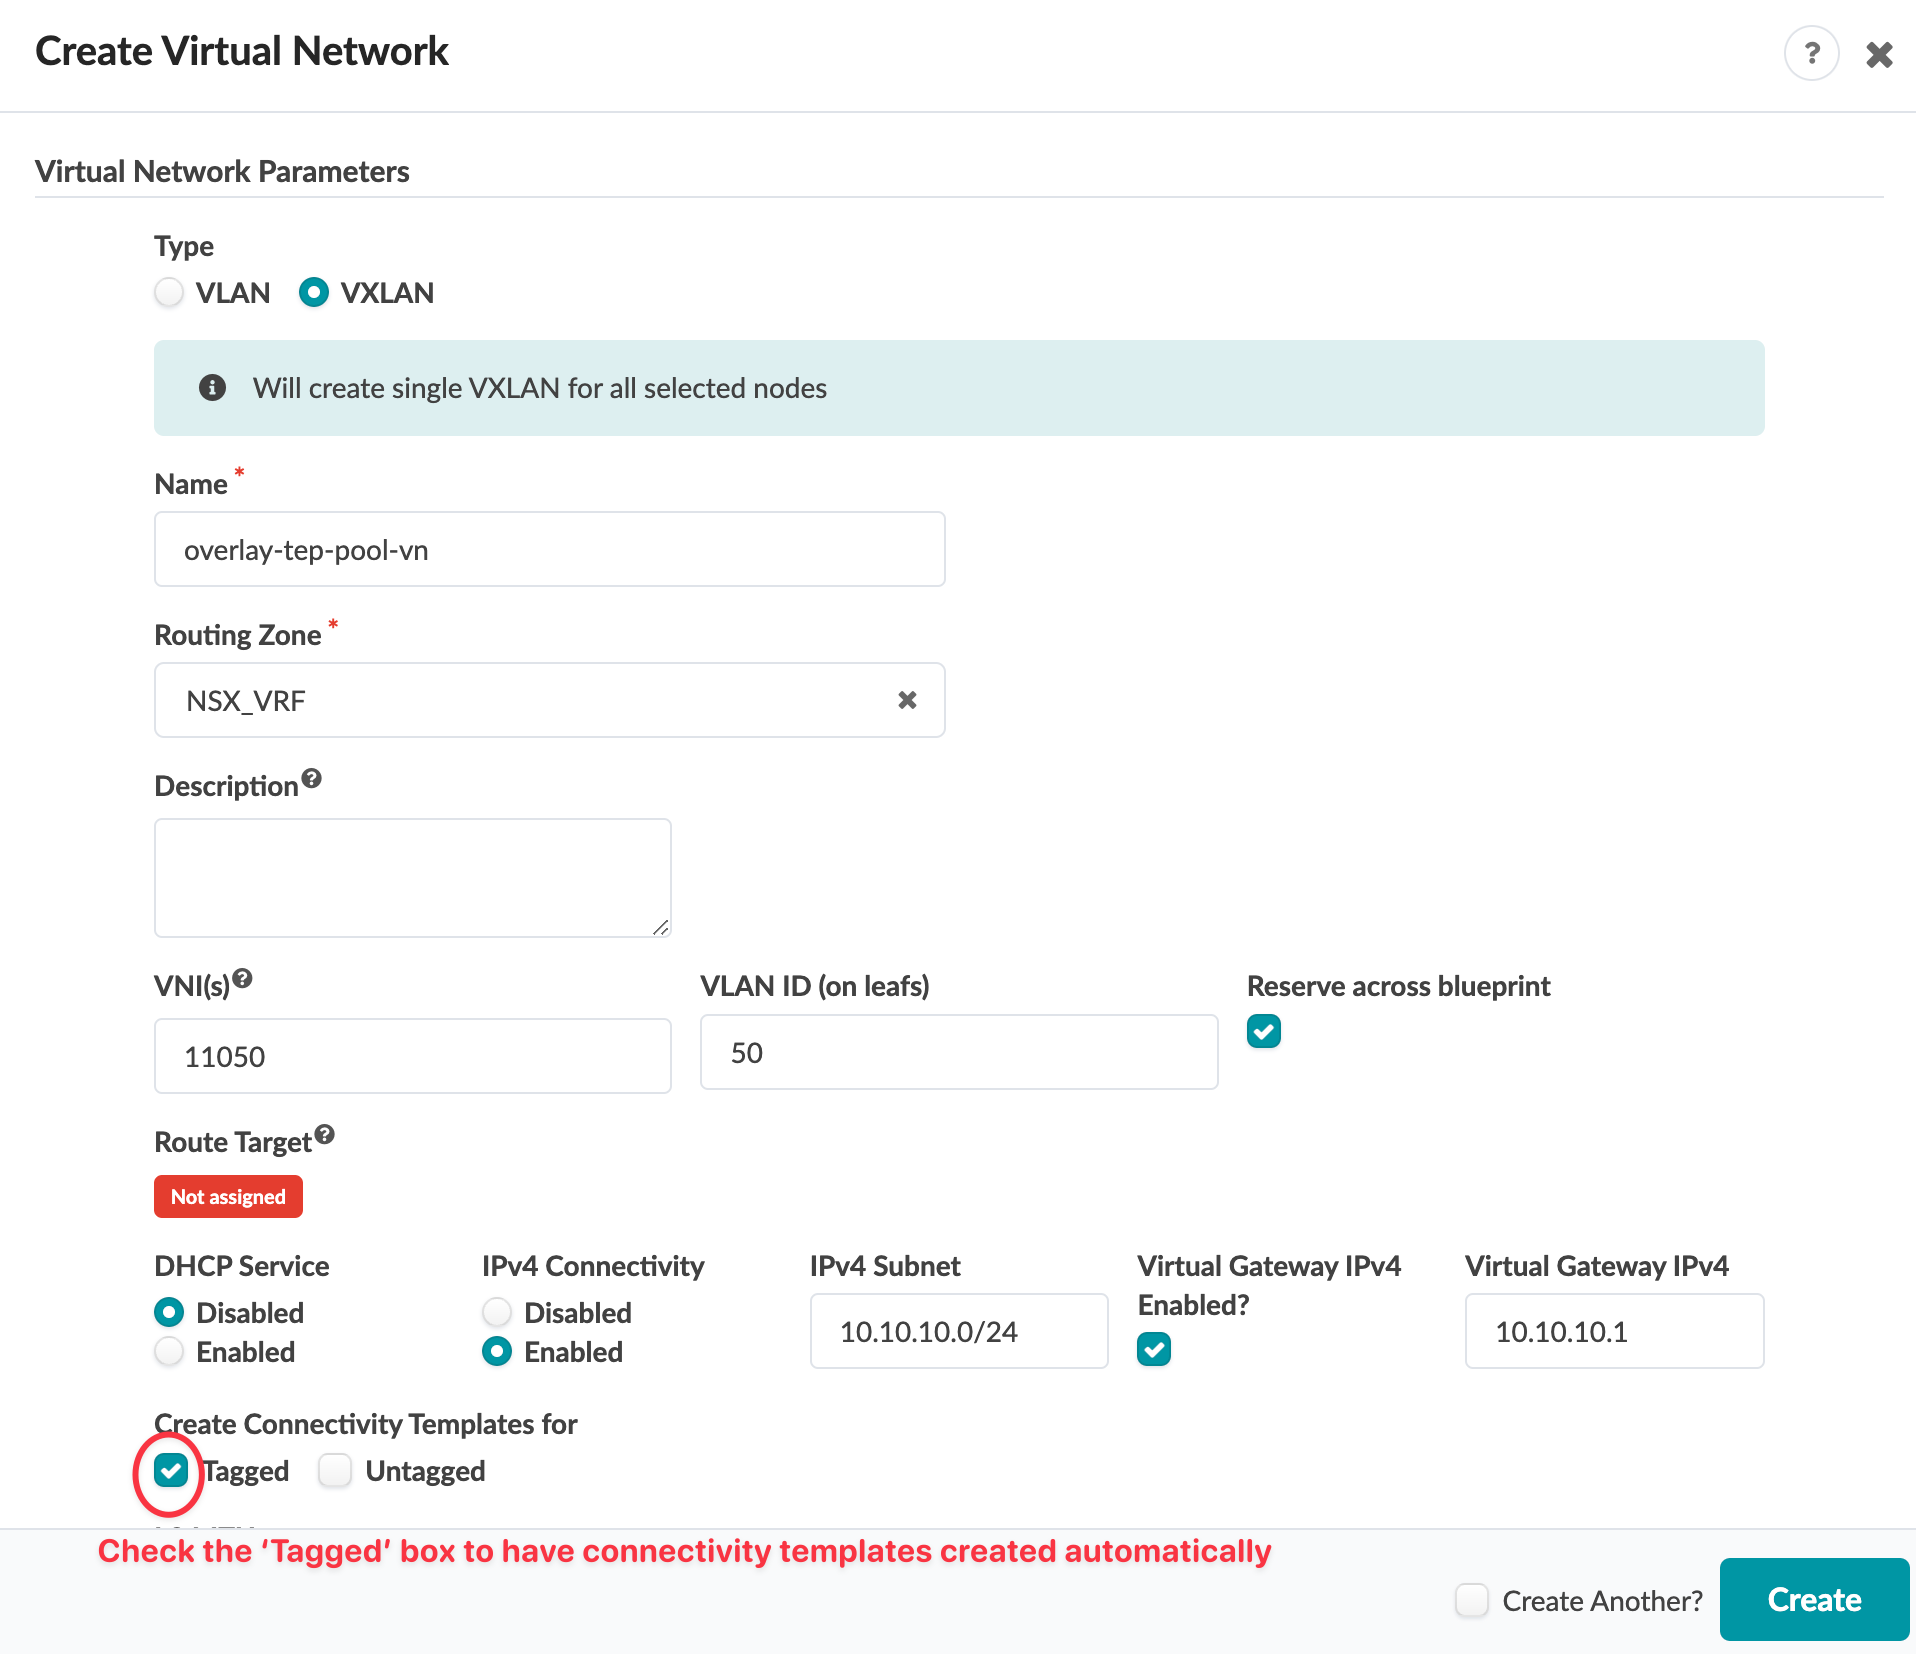
-
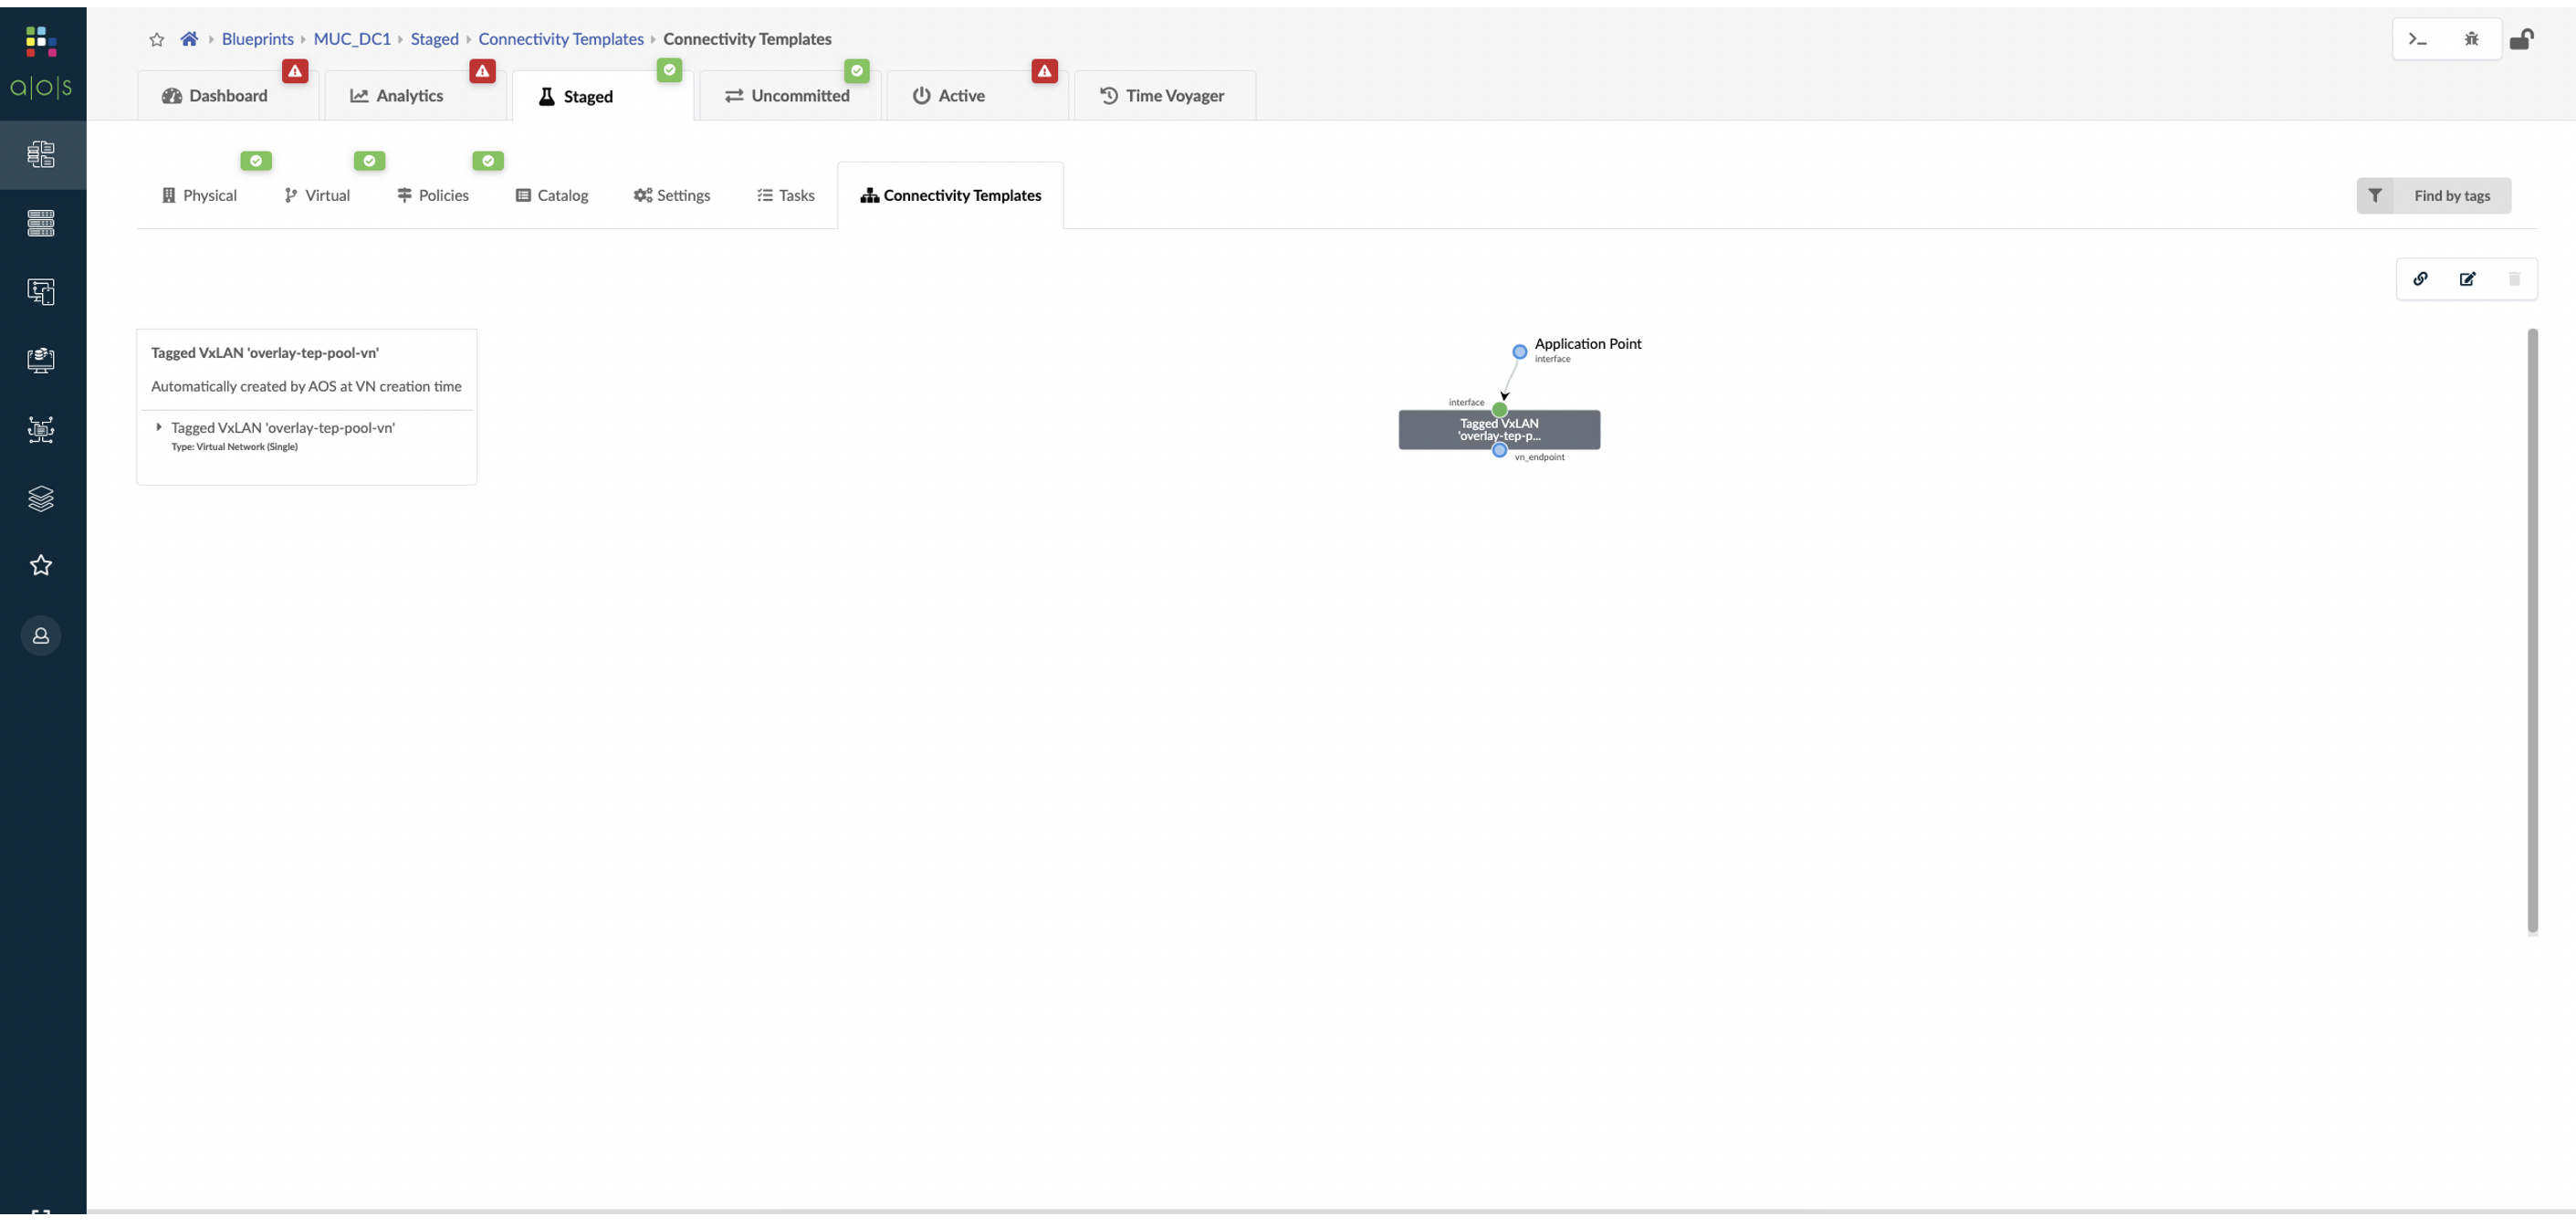
Since we checked the box to Create Connectivity Template
for in last step during VXLAN VN creation in Apstra a
Connectivity Template of type Virtual
Network is automatically created under Blueprints
> Staged > Connectivity Templates as shown below:
-
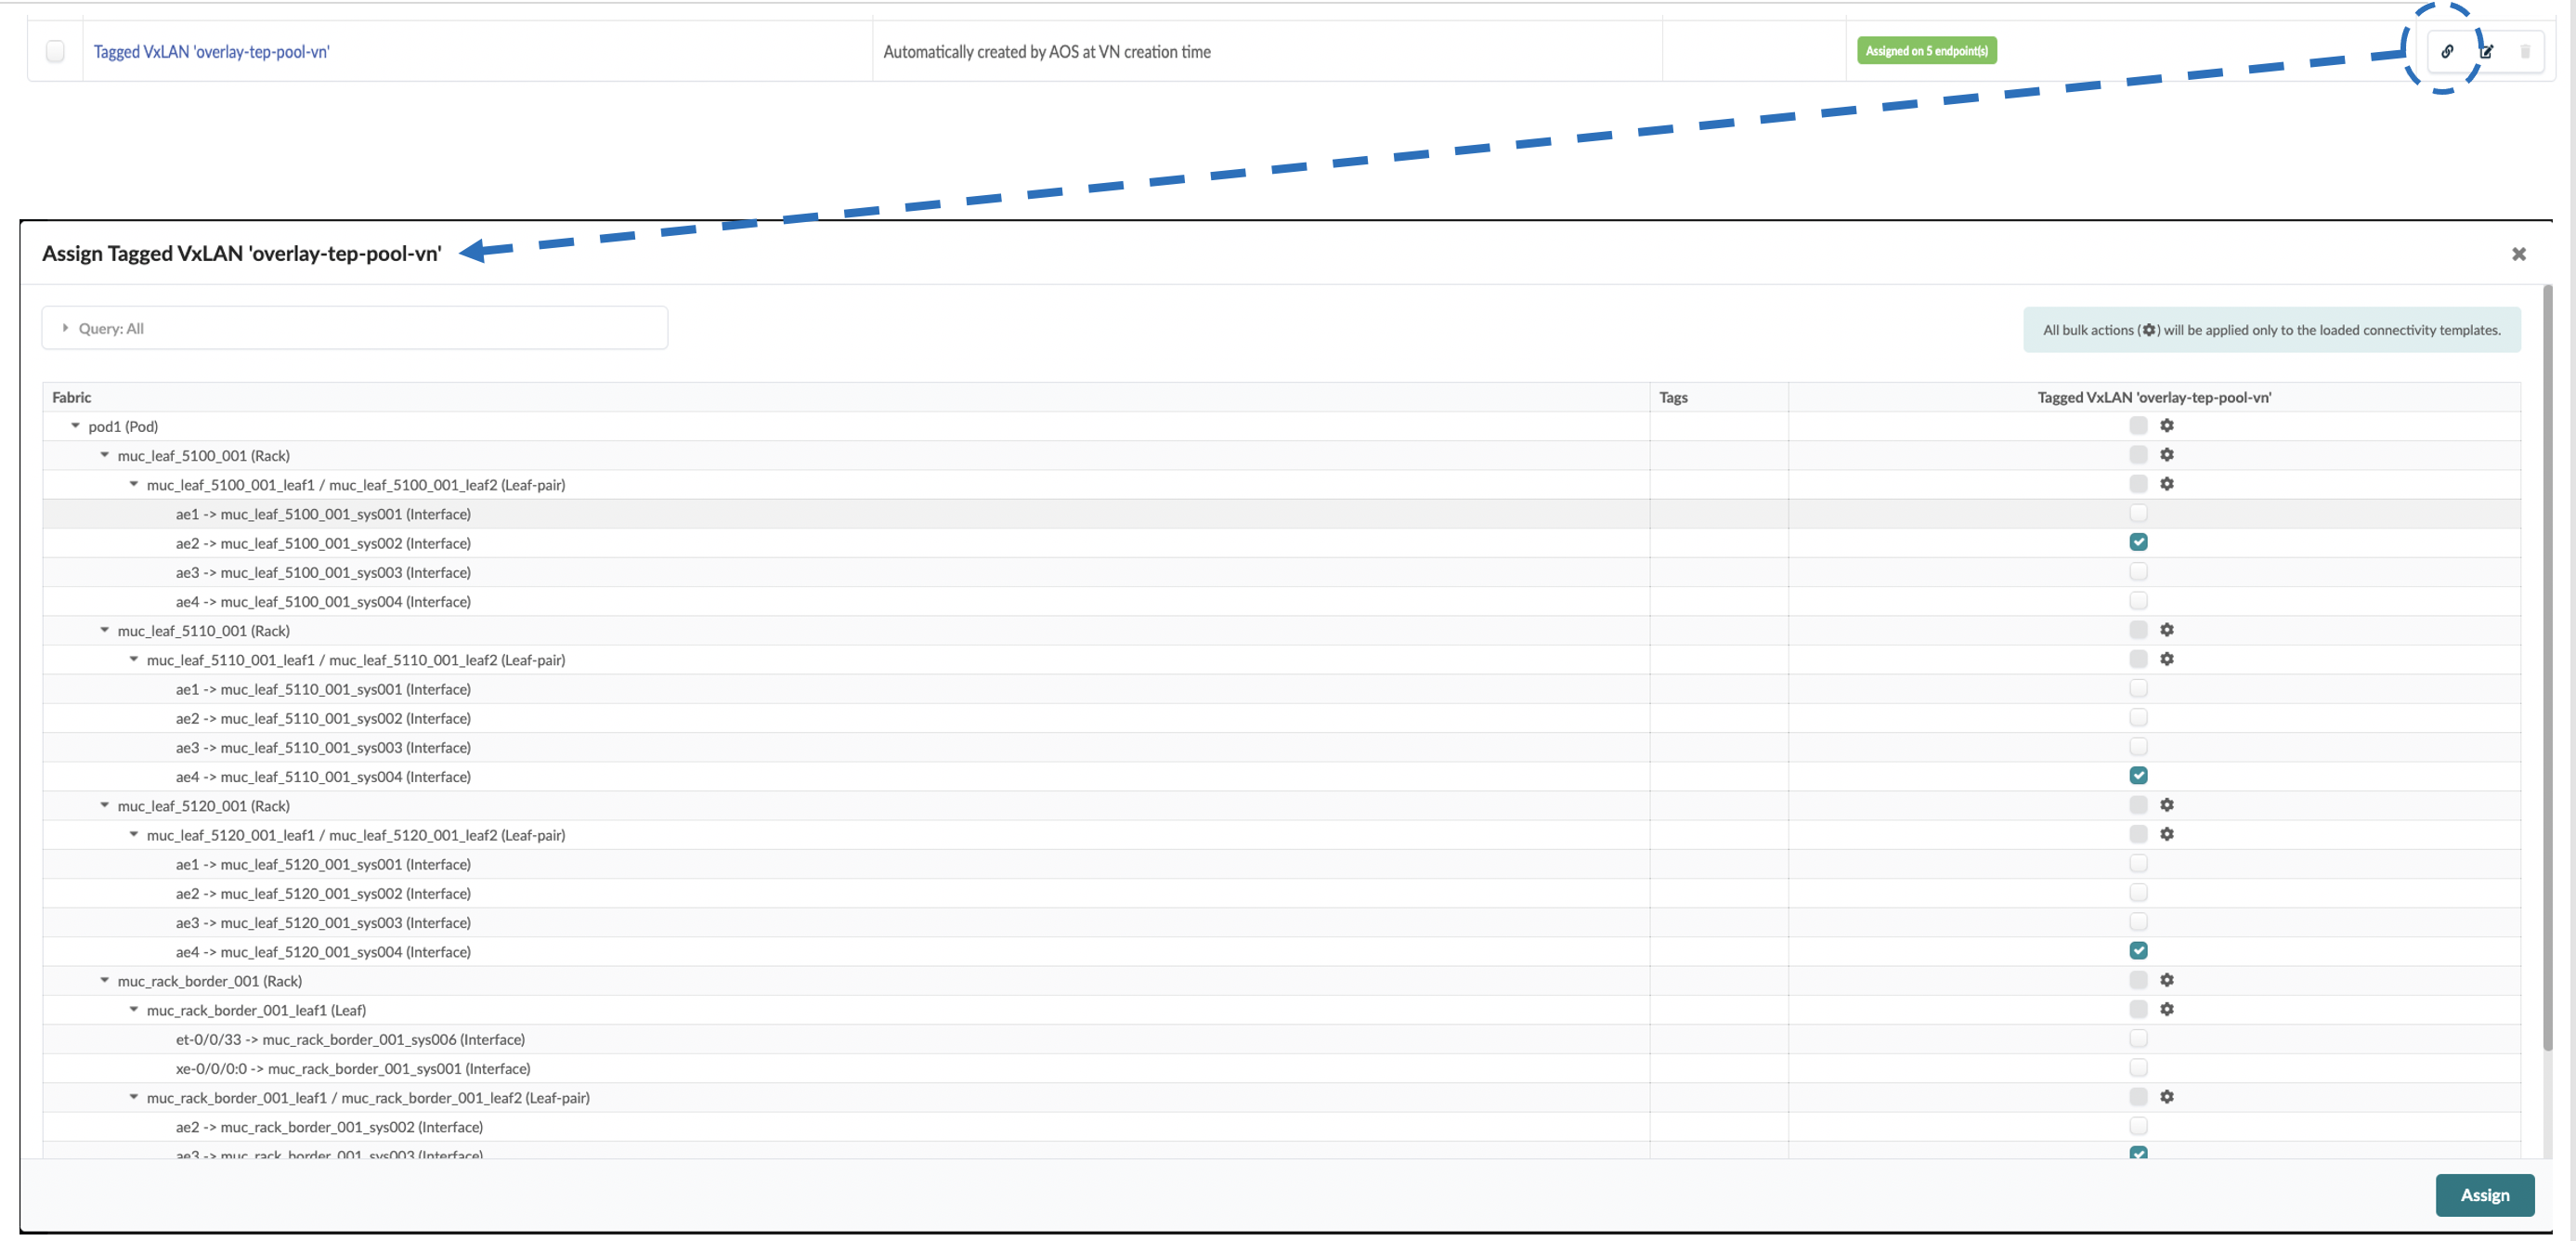
Assign the interfaces to the Connectivity Template
created above towards Transport nodes in NSX-T side.
-
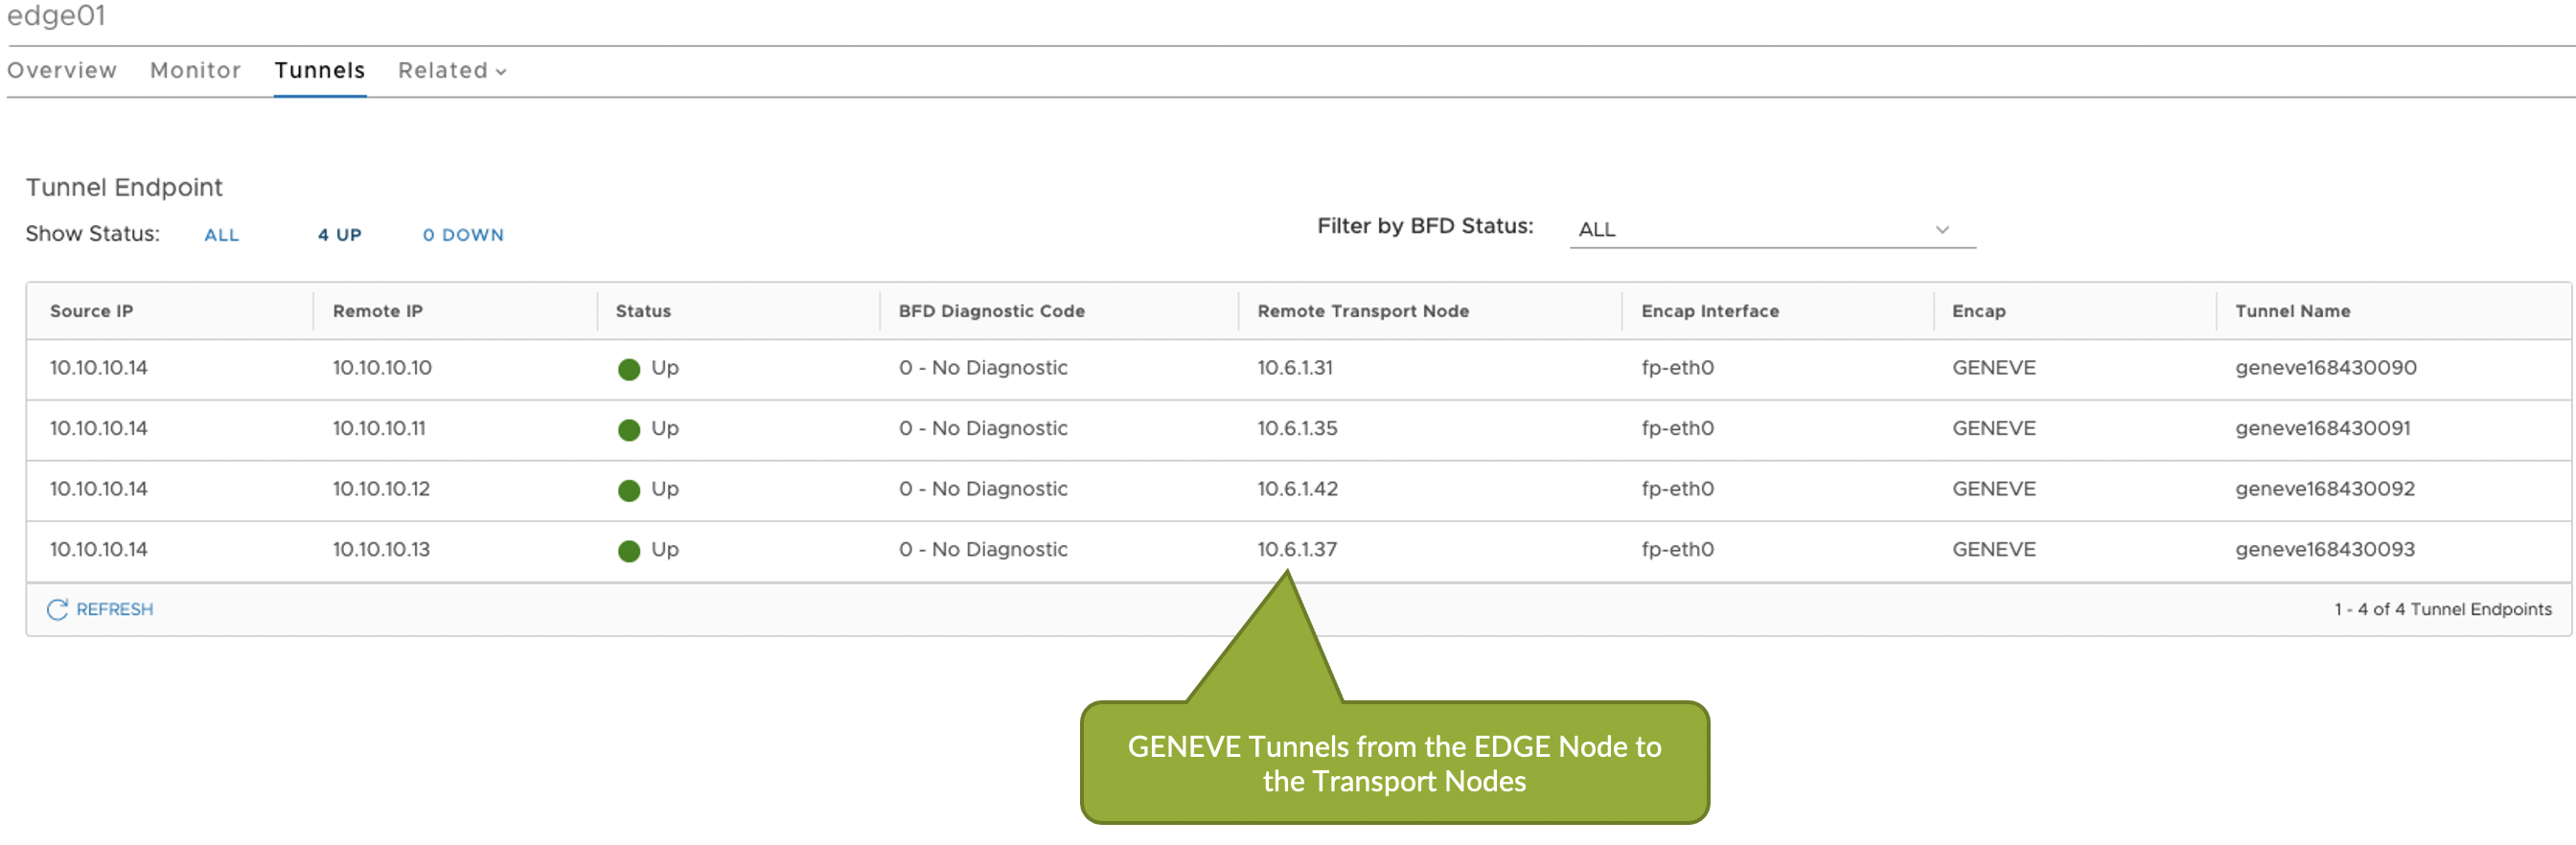
Once the configuration is rendered towards devices we can observe GENEVE
Tunnels between Transport and Edge nodes are UP in NSX-T Manager.
 Note:
Note:When you install the NSX Edge as a virtual appliance or host Transport Node, use the default uplink profile. If the Failover teaming policy is configured for an uplink profile, then you can only configure a single active uplink in the teaming policy. Standby uplinks are not supported and must not be configured in the failover teaming policy.
Virtual Infrastructure Visibility
When you've successfully integrated NSX-T, you have visibility of NSX-T VMs and transport nodes in the virtual infrastructure. You can query the status of the VMware fabric health.
To see a list of the VMs connected to the hypervisor, navigate to the dashboard and
scroll to fabric health for VMware option. 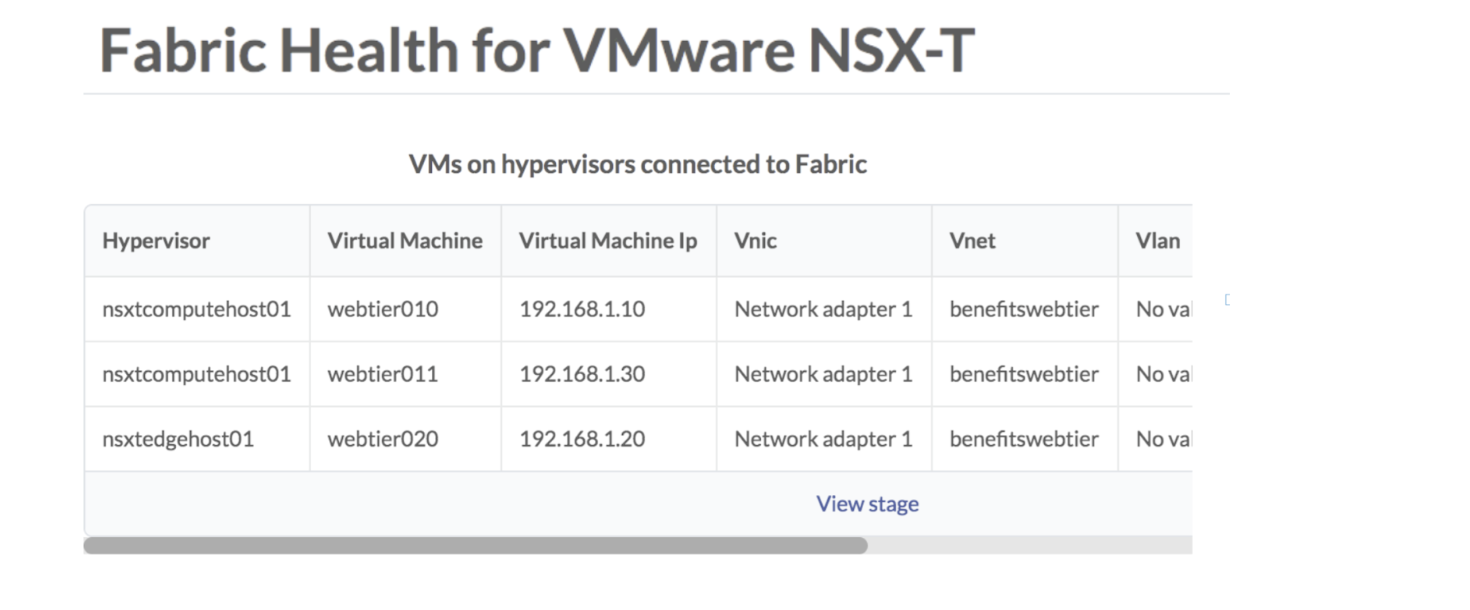
You can also query VMs that are hosted on hypervisors connected to ToR leaf devices.
From the blueprint, navigate to Active > Query > VMs.
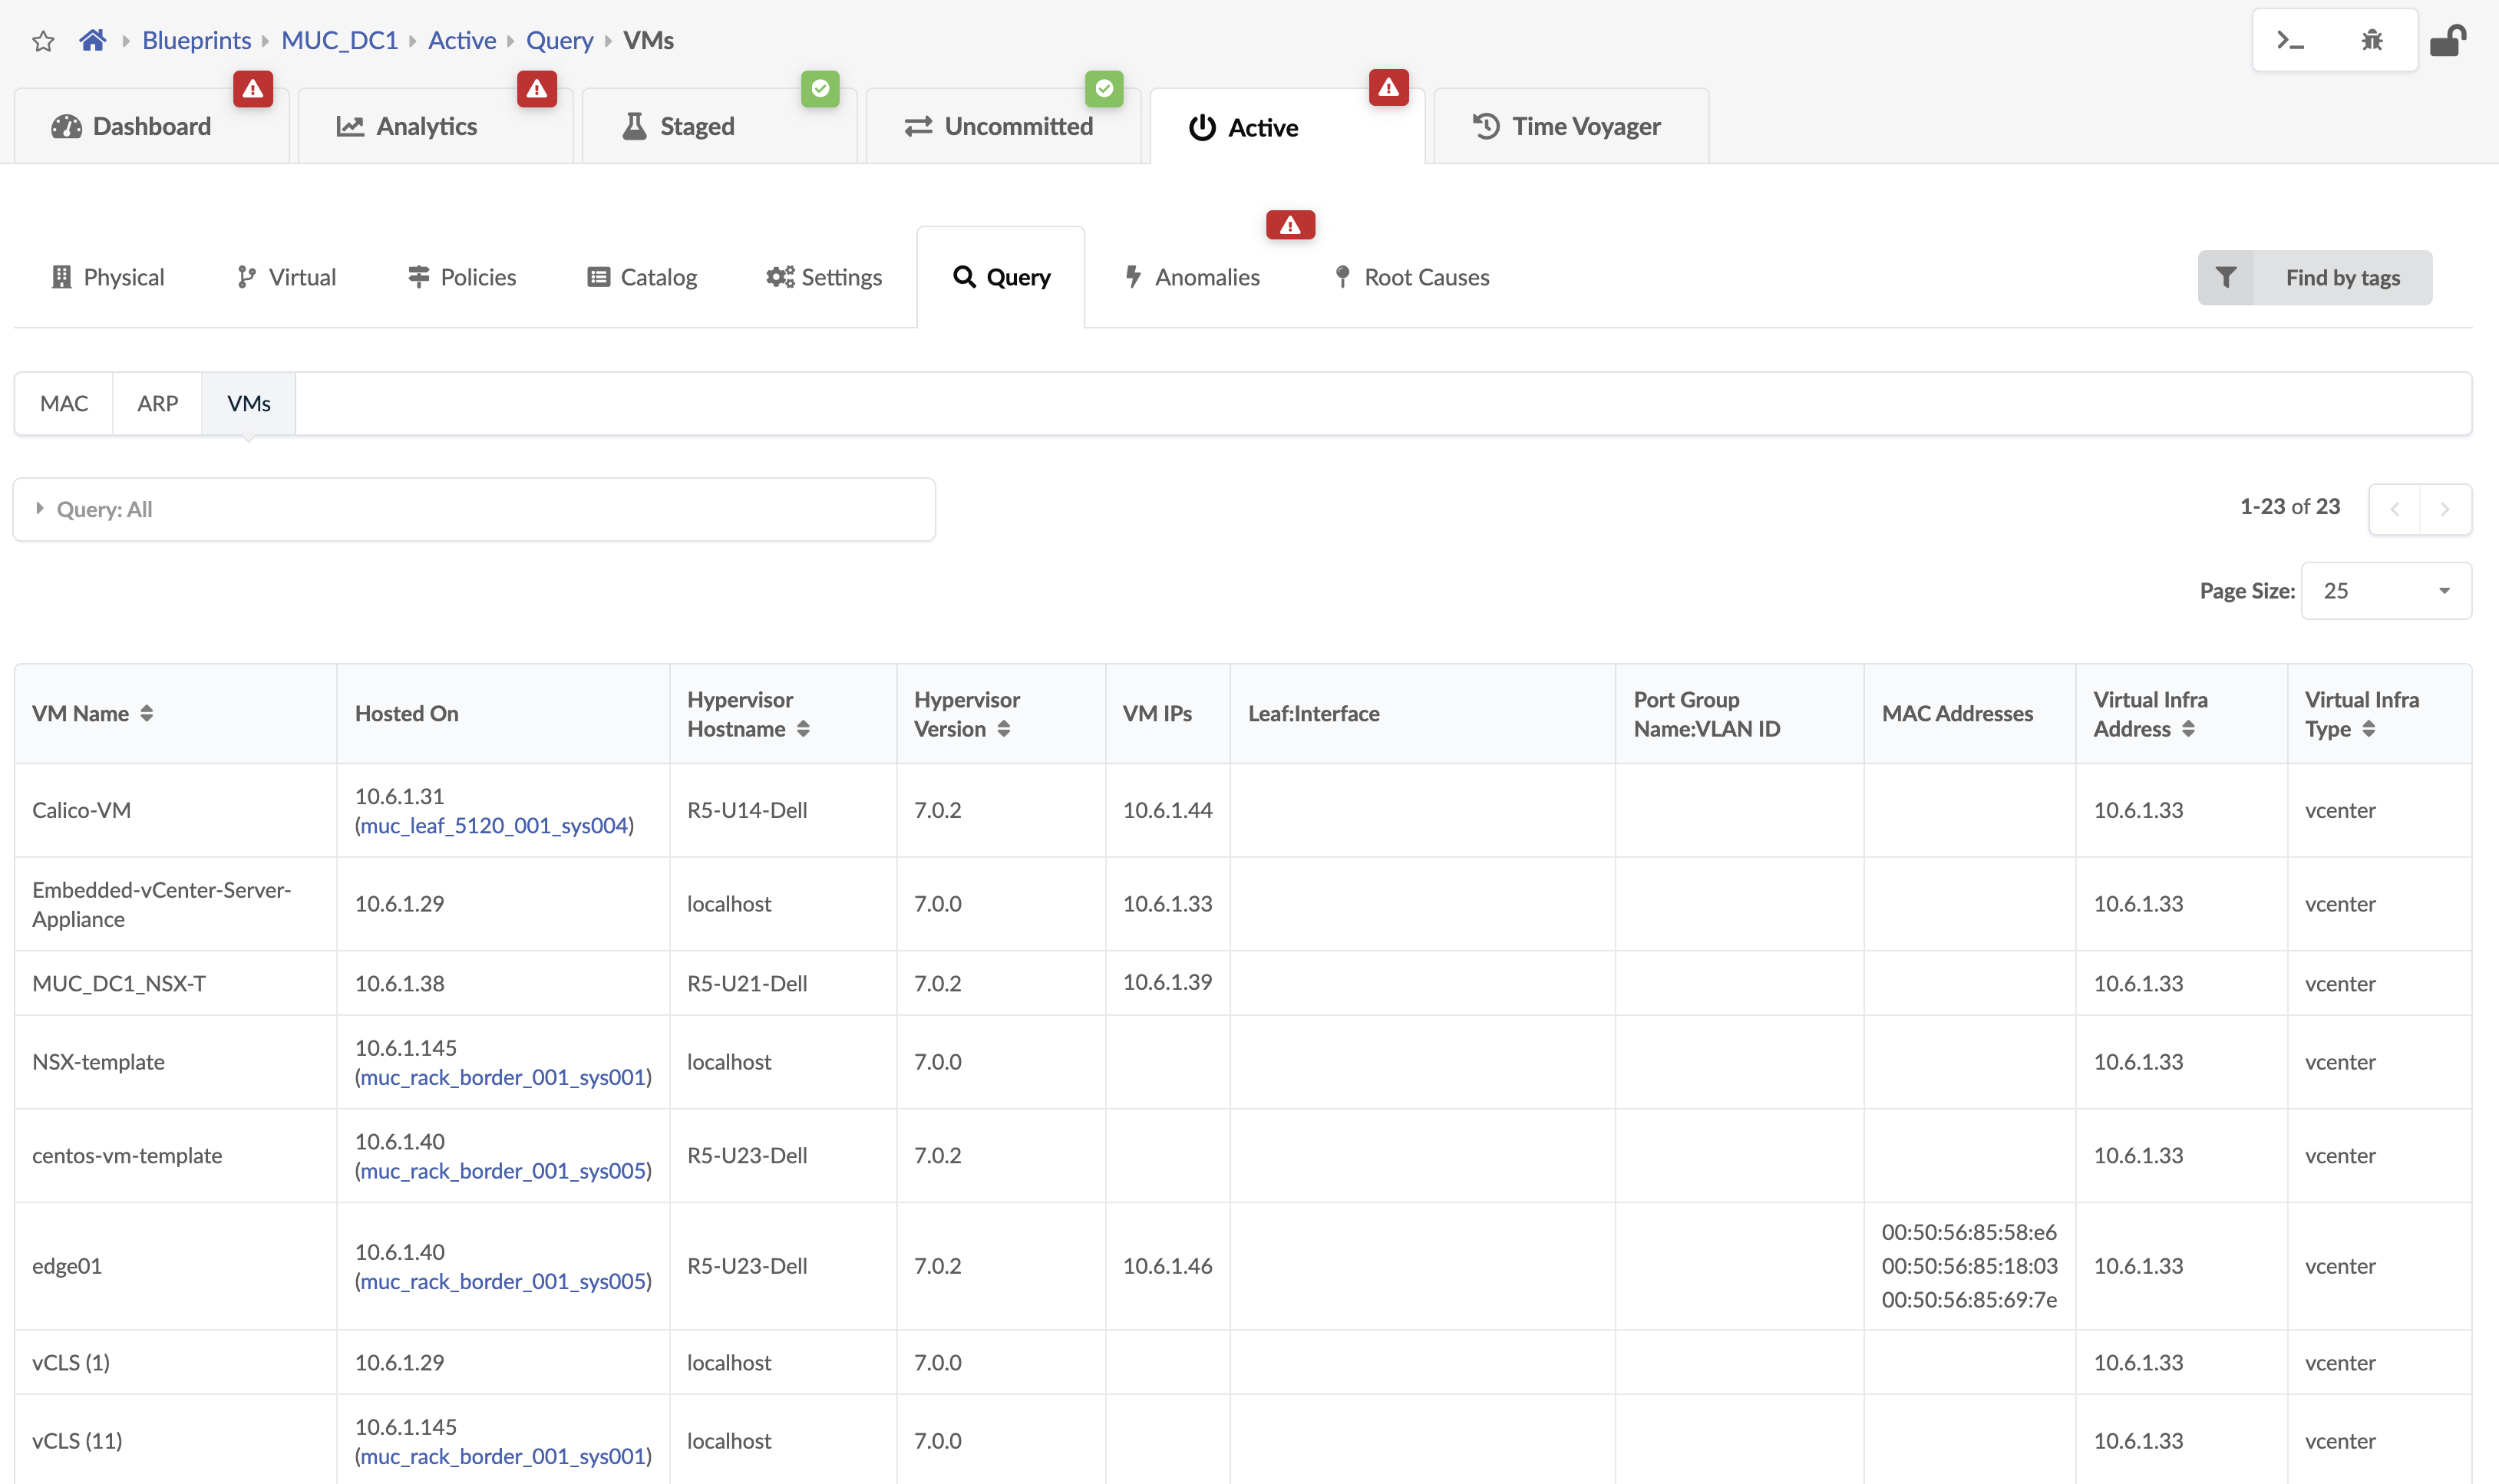
VMs include the following details:
| Parameter | Description |
|---|---|
| VM Name | The Virtual Machine name which is hosted on NSX managed hypervisor. |
| Hosted On | The ESXi host on which Virtual Machine is hosted. |
| Hypervisor Hostname | The hypervisor hostname on which Virtual Machine is hosted and is connected to the leaf TORs in a fabric. |
| Hypervisor Version | The software version of OS running on the hypervisor. |
| VM IP | The IP address as reported by NSX-T after the installation of VM tools. If the IP address is not available this field is empty. Apstra displays VM IP if the IP address is available on installation VM tools on the VM. |
| Leaf:Interface | System ID for the interface on the leaf to which ESXi host is connected and on which VM resides. |
| Port Group Name:VLAN ID | The VLAN ID which NSX-T port groups are using. Overlay VM to VM traffic in a NSX-T enabled Data Center tunnels between transport nodes over this Virtual network. |
| MAC Addresses | MAC address of the VM connected to the Apstra Fabric. |
| Virtual Infra address | IP address of the NSX-T infra added to a Blueprint |
To search for nodes in the physical topology that have VMs, navigate to
Active > Physical and select Has
VMs? from the Nodes drop-down list. 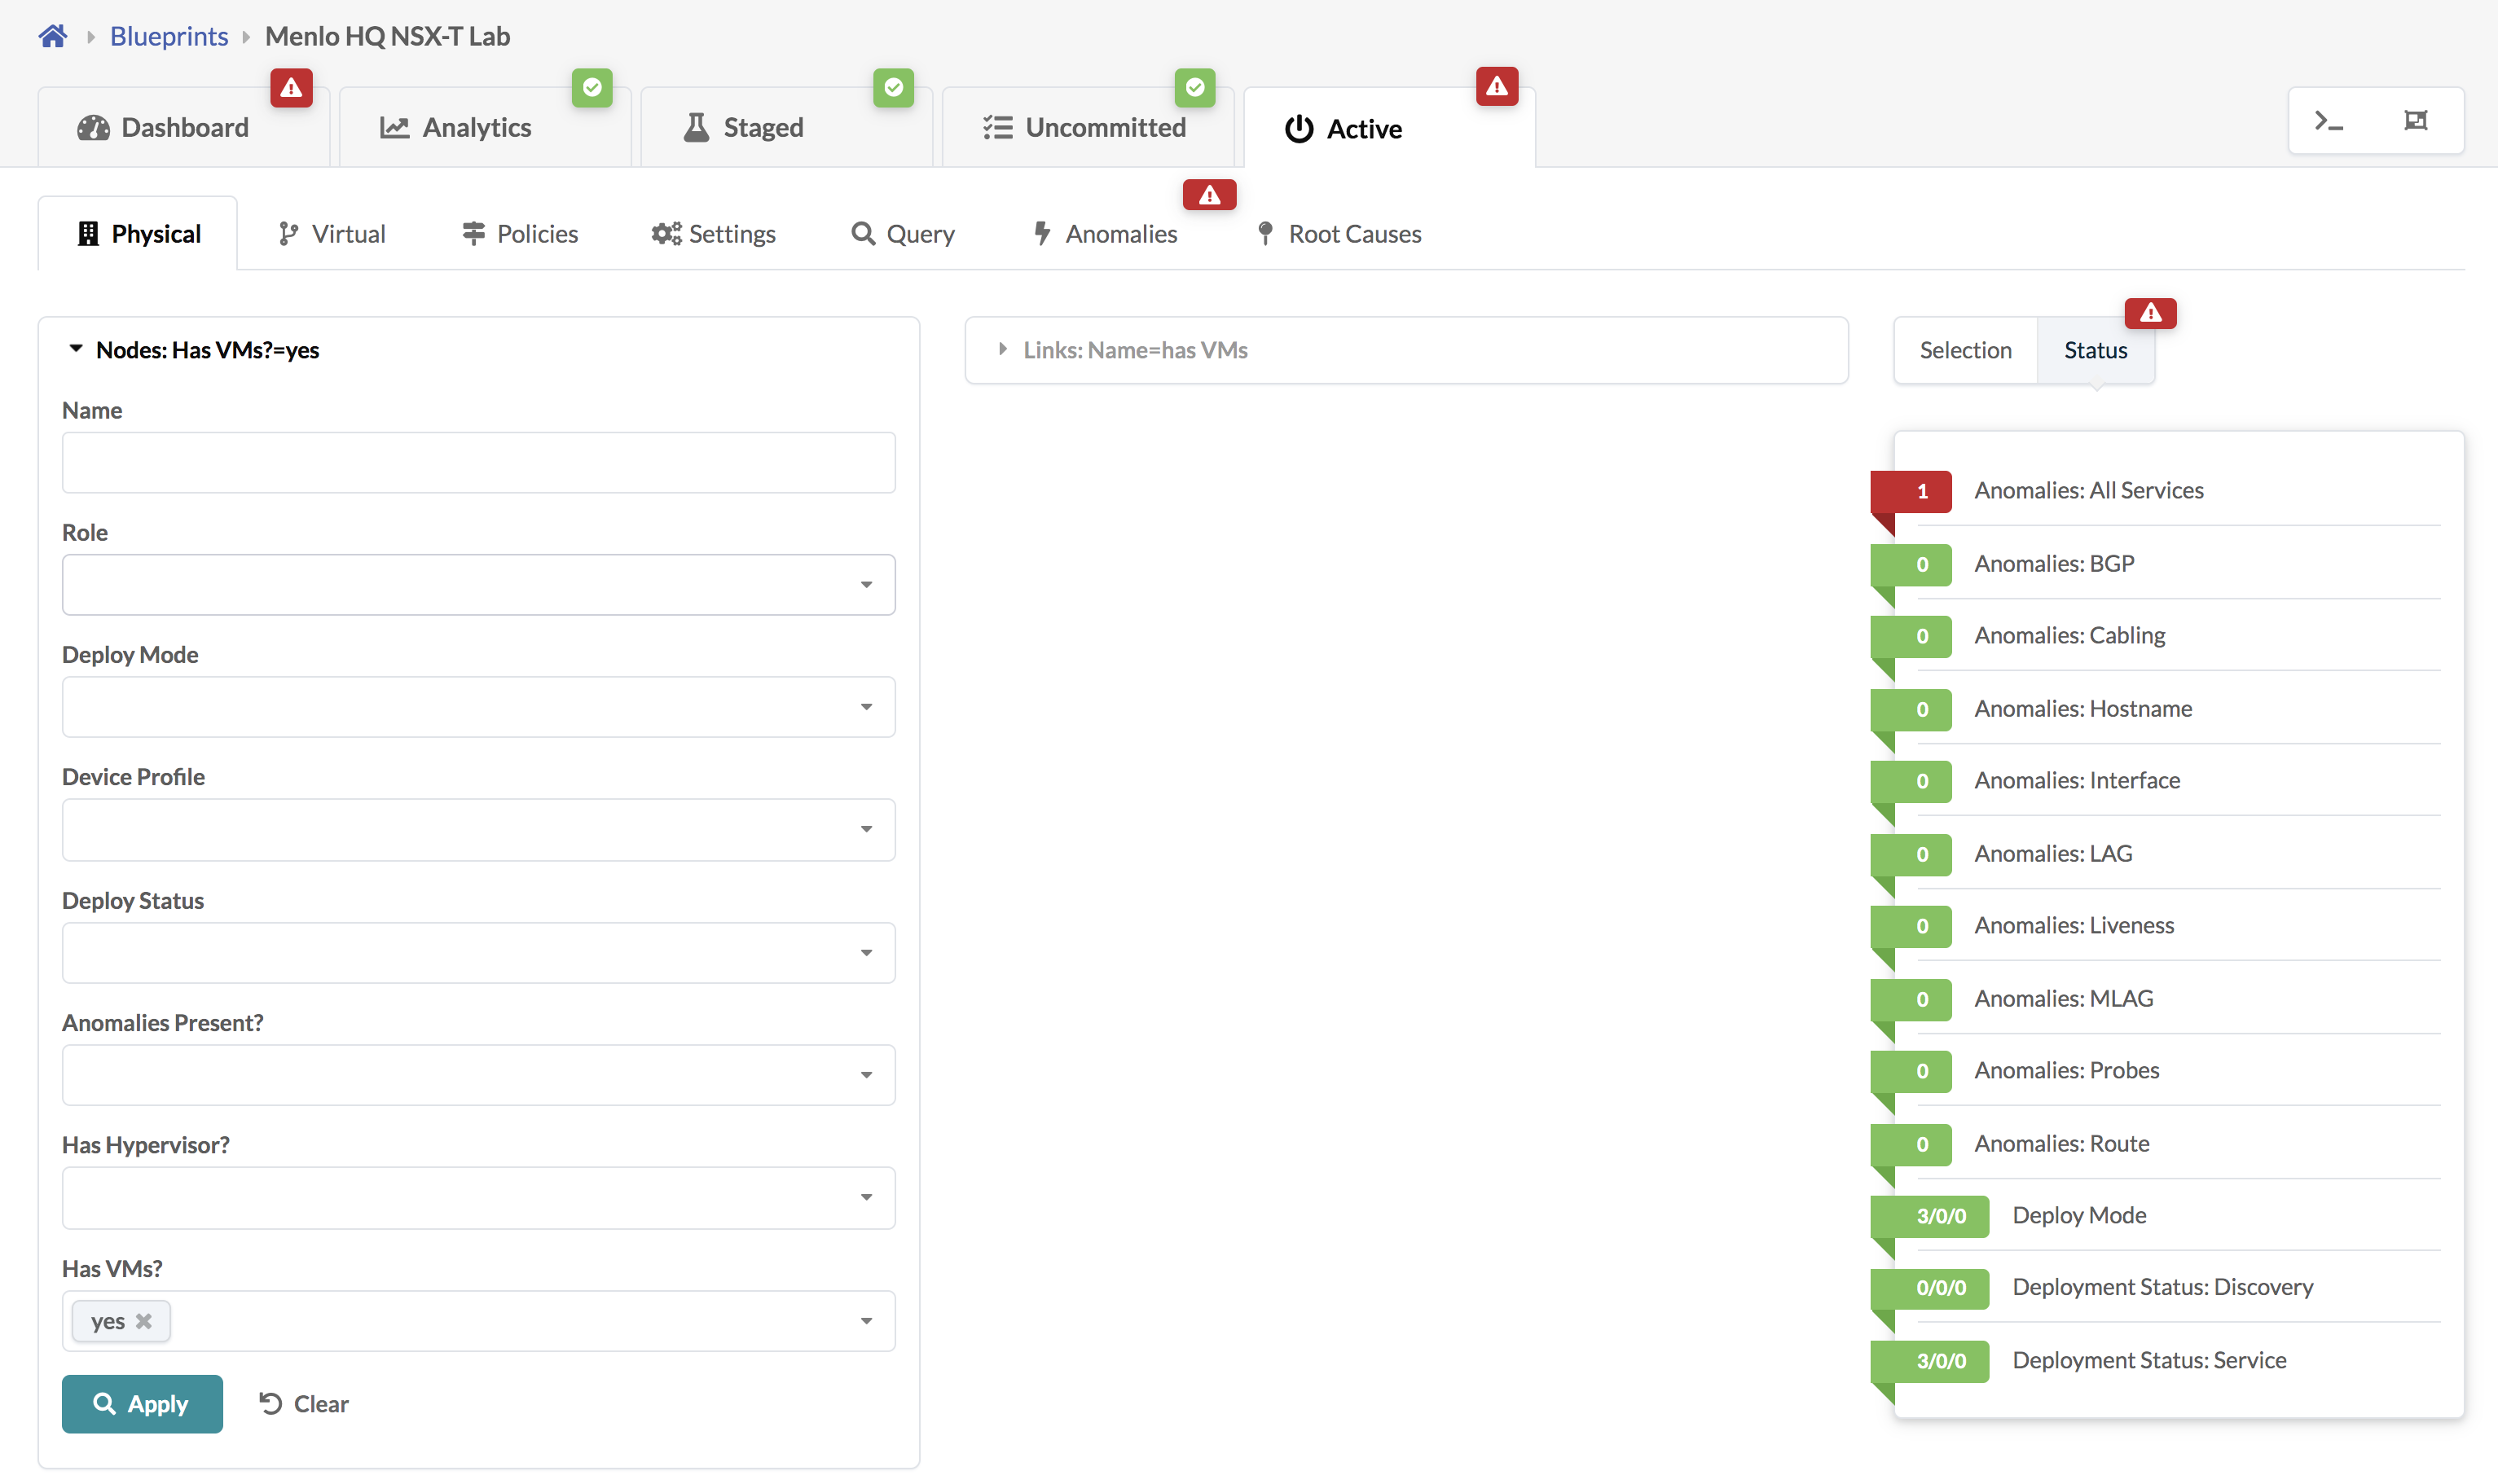
If the VM is moved from one Transport node to another in NSX-T it can be visualized
in Apstra under Active > Physical > Nodes > Generic System
(Node_name). Select the VMs tab as shown
below: 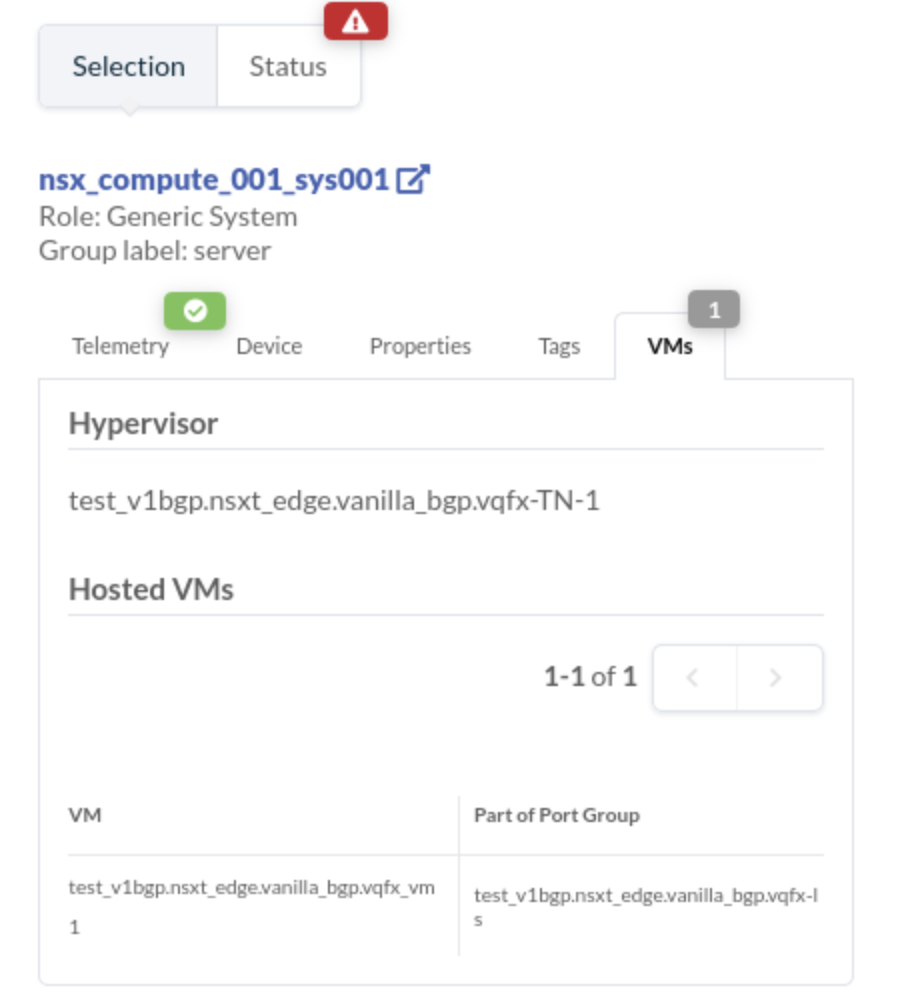
Validate Virtual Infra Integration
You can validate virtual infra with intent-based analytics. Apstra validates BGP
session towards NSX-T Edge. If BGP neighborship in NSX-T Manager is deleted, then
respective anomalies are displayed in the Apstra dashboard.

Two predefined analytics dashboards (as listed below) are available that instantiate predefined virtual infra probes.
Virtual Infra Fabric Health Check Dashboard
- Hypervisor MTU Mismatch Probe
- Hypervisor MTU Threshold Check Probe
- Hypervisor & Fabric LAG Config Mismatch Probe
- Hypervisor & Fabric VLAN Config Mismatch Probe
- Hypervisor Missing LLDP Config Probe
- VMs without Fabric Configured VLANs Probe
Virtual Infra Redundancy Check Dashboard
See Also
Disable Virtual Infra Integration
To disable virtual infra integrations, delete them from the blueprint and external systems.
- From the blueprint, navigate to Staged > Virtual > Virtual Infra and click the Delete button for the virtual infra to disable.
- Click Uncommitted (top menu) and commit the deletion.
- From the left navigation menu, navigate to External Systems > Virtual Infra Managers and click the Delete button for the virtual infra to disable.