BGP Global Summary
To access the BGP Global section, navigate to Routers > Router Name > Insights page. Then click the BGP tab in the Routing Protocols section.
You can view BGP global summary of a router in the BGP Global section. You can view Routing Tables, BGP peers chart, and Routing Table Stats chart on this section to understand the status of all BGP peers and BGP sessions of a router.
As multiple peers can add routes to the same RIB, peers are not considered for the global view. So, the data displayed in BGP Global section are aggregated and are global for the selected RIB.
The BGP Global section is updated every three minutes. Click the refresh icon to trigger a manual refresh, if needed.
Routing Tables
The Routing Tables chart displays the total number of paths and number of active paths in the routing tables of a router.
You can search and filter the table by using keywords. Click the search icon (magnifying glass), enter the search term in the text box, and press Enter. The search results are updated in the table. You can also sort the columns in the table by header. Click any column header to sort its entries.
Table 1 displays the fields in The Routing Tables chart.
|
Field |
Description |
|---|---|
|
Table |
Default routing tables defined in Junos OS software. |
|
Total Paths |
Total number of paths. |
|
Active Paths |
Number of active paths for destinations. An active path is a route that is selected as the best path. |
BGP Peers Graph
The BGP Peers time series graph displays the status of BGP peers of a router, in a give time range. Select a routing table from the routing table drop-down list. BGP Peers graph displays data for the selected routing table.
You can move the slider across the graph. A pop-up on the slider displays the number of established peers and down peers for that period. As you move the slider along the graph, you can see the slider of the Router Events graph also move, simultaneously.
Using this feature, you can visually correlate a router event (from the Router Events graph) to the status of a peer. For example, you can perform a root cause analysis about a BGP session if all the peers go down, suddenly in an interval. See the data in the Router Events graph for the same interval, to see if any router event triggered this scenario.
You can view the graph legend below the graph to interpret the plotted lines. Click the expand icon for an enlarged view of the graph.
Routing Table Statistics
The Routing Table Stats time series graph displays details of routing table prefixes of a router, in a give time range. You can view the count of active prefixes and total prefixes on the graph. Select a routing table from the routing table drop-down list. The Routing Table Stats graph displays data for the selected routing table.
Active prefixes is the number of prefixes received from a peer that are active in the routing table. Total prefixes is the total number of prefixes including active prefixes, received prefixes, accepted prefixes, and advertised prefixes.
You can move the slider across the graph. A pop-up on the slider displays the count of total prefixes and active prefixes for that time period. As you move the slider along the graph, you can see the slider of the Router Events graph also move, simultaneously.
Using this feature, you can visually correlate a router event (from the Router Events graph) to the status of a peer. For example, you can perform a root cause analysis about a BGP session. View the graph to see when a maximum prefix limit is reached. Then, see the data in the Router Events graph for the same interval, to see if any router event triggered this scenario. Possible events for this scenario could include recent policy changes (RFC8212) or a sudden increase or decrease in the accepted or rejected routes.
You can view the graph legend below the graph to interpret the plotted lines. Click the expand icon for an enlarged view of the graph.
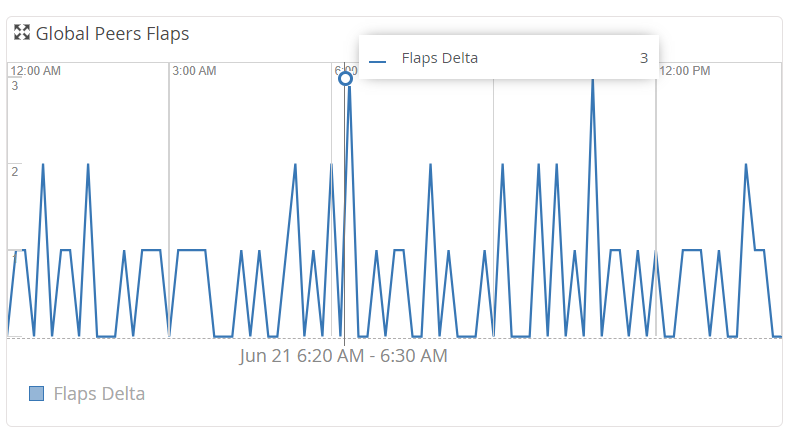
Global Peers Flaps
The Global Peers Flaps graph displays a summary view of the peers flaps across the device, in the form of a time series graph. The graph displays flap count delta, which is the difference between the current and the previous flap count. Flap count delta indicates the stability of peers.
You can move the slider across the graph. A pop-up on the slider displays the flap count delta for that time period. As you move the slider along the graph, you can see the slider of the Router Events graph also move, simultaneously.
Using this feature, you can visually correlate a router event (from the Router Events graph) to a peak in the router flaps delta value. For example, you can analyze a BGP route flapping situation by investigating router events that might have occurred in the same interval.
Flap count is the total number of BGP session flaps from a router.
If the flaps count delta is zero, Global Peers Flaps graph will not display any data along the y-axis.
Click the expand icon for an enlarged view of the graph.