Router Interface Queues
To access the Router Interface Queues section, navigate to Organization > Inventory > Routers > Router Name > Router Insights or Routers > Router Name > Router Insights.
The Router Interface Queues section on the Router Insights page enables you to monitor traffic in the network. You can monitor packet drops on all interface queues of a router and view the class of service (CoS) affected by the packet drops. The section also provides insights into queue depth utilization which can further be used to prevent packet drops.
By default, the Router Interface Queues section displays the Total Interfaces Drop Packets Rate graph. Select an interface from the Interfaces drop-down list to view graphs specific to an interface.
Total Interfaces Drop Packets Rate
The Total Interfaces Drop Packets Rate graph displays aggregated packet drops (aggregated RED drops and tail drops) across all queues, for an interface, in packets per second (pps). The aggregated packet drops are represented in a time series graph. Select All Interfaces from the Interfaces drop-down list. The Total Drop Packets Rate graph displays packet drops for all the interfaces.
The Total Interfaces Drop Packets Rate graph presents a global view of the packet drops across all queues and enables you to debug these packet drops. For example, if you see packet drops on an interface in the Total Interfaces Drop Packets Rate, follow this procedure to debug the issue further:
-
Select the interface (interface on which you see packet drops) from the Interfaces drop-down list.
-
View the Total Drop Packets Rate graph for the selected interface to understand the affected class of service.
The standard KPI for routing is no drop on network control queue, and minimal to no drop on all other queues.
You can move the slider across the graph. A pop-up on the slider displays the number of packet drops for all interfaces, for that period. As you move the slider along the graph, you can see the slider of the Router Events chart also move, simultaneously.
This feature serves as an indicator to the performance of the router. You can correlate the data in the graph to specific router events that might have occurred during the same interval. You can use this information to investigate the reason for occurrence of these events and remediate actions in case of unexpected events.
Refer the color-coded legend below the graph to understand packet drops on each interface. The graph legends are clickable. Click a legend to display or hide its data on the graph. Use this feature to filter and view only the desired interface's data and to visually compare packet drops on the interfaces.
Click the expand icon for an enlarged view of the graph.
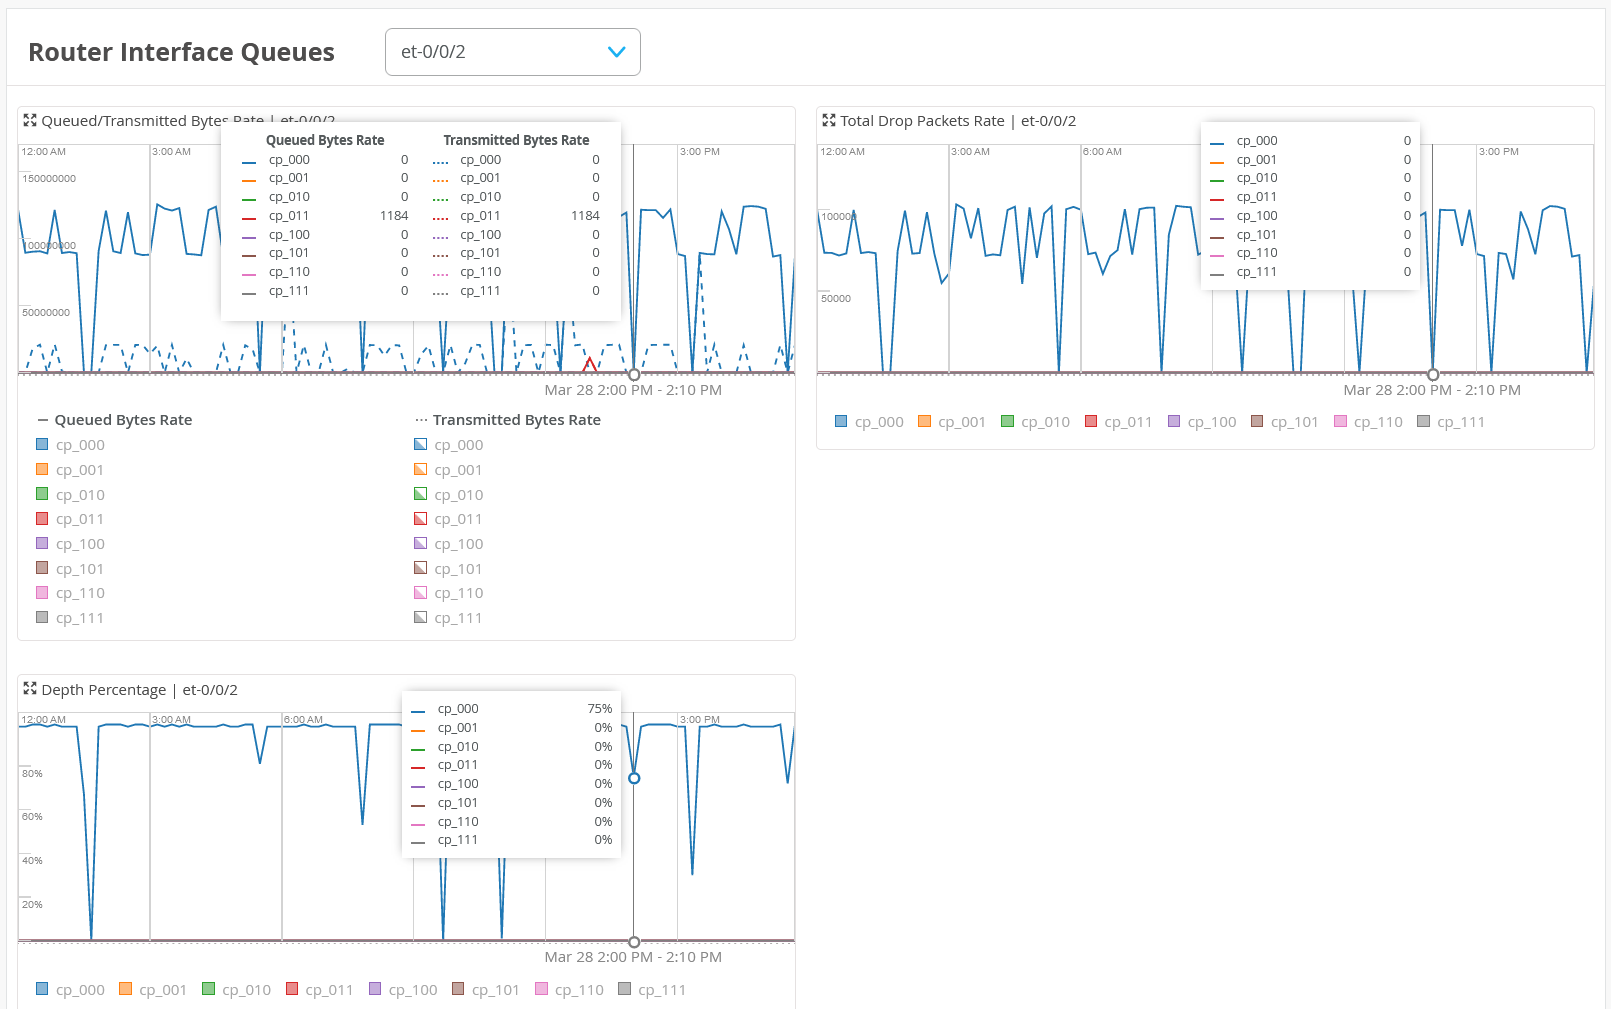
Queued or Transmitted Bytes Rate
To view the Queued or Transmitted Bytes Rate graph, navigate to Routers > Router Name > Router Insights. Select an interface from the Interfaces drop-down list.
The Queued or Transmitted Bytes Rate graph displays queued bytes rate and transmitted bytes rate on a single time series graph. Select an interface from the Interfaces drop-down list. The Queued or Transmitted Bytes Rate graph displays data for the selected interface.
You can move the slider across the graph. A pop-up on the slider displays the queued bytes rate and transmitted bytes rate of all forwarding classes, for that period. As you move the slider along the graph, you can see the slider of the Router Events chart also move, simultaneously.
This feature serves as an indicator to the performance of the router. You can correlate the data in the graph to specific router events that might have occurred during the same interval.
Refer the color-coded legend below the graph to understand how the interface is performing. Solid lines and dotted lines in the graph represent queues bytes rate and transmitted bytes rate, respectively.
The solid line and the dotted line must track each other. Divergence of these lines from each other indicates that the queue is building up.
The color-coded forwarding class legends are clickable. Click a legend to display or hide its data on the graph. Use this feature to filter and view only the desired forwarding class’s data and to visually compare queues bytes rate with the transmitted bytes rate of a forwarding class.
Click the expand icon for an enlarged view of the graph.
Depth Percentage
To view the Depth Percentage graph, navigate to Routers > Router Name > Router Insights. Select an interface from the Interfaces drop-down list.
The Depth Percentage Rate graph displays queue depth utilization of all queues for an interface. Select an interface from the Interfaces drop-down list. The Depth Percentage Rate graph displays the percentage of queue depth utilization over time, for the selected interface. Administrators can use queue depth utilization information to prevent packet drops.
Queue depth is the amount of queue buffer that is in occupation at an instance. This is an indicator of the amount of data that is present in a queue at that point in time. The amount of data present is in the units of bytes.
The Depth Percentage graph displays queue depth utilization percentage (ranging from 0 through 100) which is calculated as
Percentage of Queue Depth Utilization = (Current Queue Depth Utilization / Maximum Queue Depth Utilization) * 100
You can move the slider across the graph. A pop-up on the slider displays the percentage of queue depth utilization for the interface, for that period. As you move the slider along the graph, you can see the slider of the Router Events chart also move, simultaneously.
This feature serves as an indicator to the performance of the router. You can correlate the data in the graph to specific router events that might have occurred during the same interval. Use this feature to ascertain how router events (for example, port down, CoS configuration change and so on) can impact congestion on the interface queues.
Refer the color-coded legend below the graph to understand packet drops on the interface. The graph legends are clickable. Click a legend to display or hide its data on the graph. Use this feature to filter and view only the desired forwarding class' queue depth utilization.
Click the expand icon for an enlarged view of the graph.
Total Drop Packets Rate
To view Total Drop Packets Rate graph, navigate to Routers > Router Name > Router Insights. Select an interface from the Interfaces drop-down list.
The Total Drop Packets Rate graph displays packet drops (RED drops and tail drops) on an interface with the affected class of service (CoS), in a time series graph. The packet drops rate is represented in packets per second (pps). Select an interface from the Interfaces drop-down list. The Total Drop Packets Rate graph displays packet drops rate for the selected interface.
You can move the slider across the graph. A pop-up on the slider displays the number of packet drops for the interface, for that period. As you move the slider along the graph, you can see the slider of the Router Events chart also move, simultaneously.
This feature serves as an indicator to the performance of the router. You can correlate the data in the graph to specific router events that might have occurred during the same interval. Administrators can analyse packet drops with respect to the configured forwarding class' transmit rate or buffer size to modify CoS schedulers to improve throughput.
The standard KPI for routing is no drop on network control queue, and minimal to no drop on all other queues.
Refer the color-coded legend below the graph to understand packet drops on the interface. The graph legends are clickable. Click a legend to display or hide its data on the graph. Use this feature to filter and view only the desired class of service (CoS) that is affected by the packet drops.
Click the expand icon for an enlarged view of the graph.