Flow-Based Telemetry (EX4100, EX4100-F, and EX4400 Series)
Flow based telemetry (FBT) enables per-flow-level analytics, using inline monitoring services to create flows, collect them, and export them to a collector using the open standard IPFIX template to organize the flow.
FBT Overview
You can configure flow-based telemetry (FBT) for the EX4100, EX4100-F, and EX4400
Series switches. FBT enables per-flow-level analytics, using inline monitoring
services to create flows, collect them, and export them to a collector. With inline
monitoring services, you can monitor every IPv4 and IPv6 packet on both ingress and
egress directions of an interface. A flow is a sequence of packets that have the
same source IP, destination IP, source port, destination port, and protocol on an
interface. For each flow, the software collects various parameters and exports the
actual packet up to the configured clip length to a collector using the open
standard IPFIX template to organize the flow. Once there is no active traffic for a
flow, the flow is aged out after the configured inactive-timeout period (configure
the flow-inactive-timeout statement at the [edit services
inline-monitoring template template-name] hierarchy level). The
software exports a IPFIX packet periodically at the configured flow-export timer
interval. The observation domain identifier is used in the IPFIX packet to identify
which line card sent the packet to the collector. Once set, the software derives a
unique identifier for each line card based upon the system value set here.
- Benefits of FBT
- FBT Flow Export Overview
- Limitations and Caveats
- Licenses
- Drop Vectors (EX4100 and EX4100-F only)
Benefits of FBT
With FBT, you can:
- Count packet, TTL, and TCP window ranges
- Track and count Denial of Service (DoS) attacks
- Analyze the load distribution of ECMP groups/link aggregation groups (LAG) over the member IDs (EX4100 and EX4100-F only)
- Track traffic congestion (EX4100 and EX4100-F only)
- Gather information about multimedia flows (EX4100 and EX4100-F only)
- Gather information on why packets are dropped (EX4100 and EX4100-F only)
FBT Flow Export Overview
See Figure 1 for a sample template, which shows the information element IDs, names, and sizes:
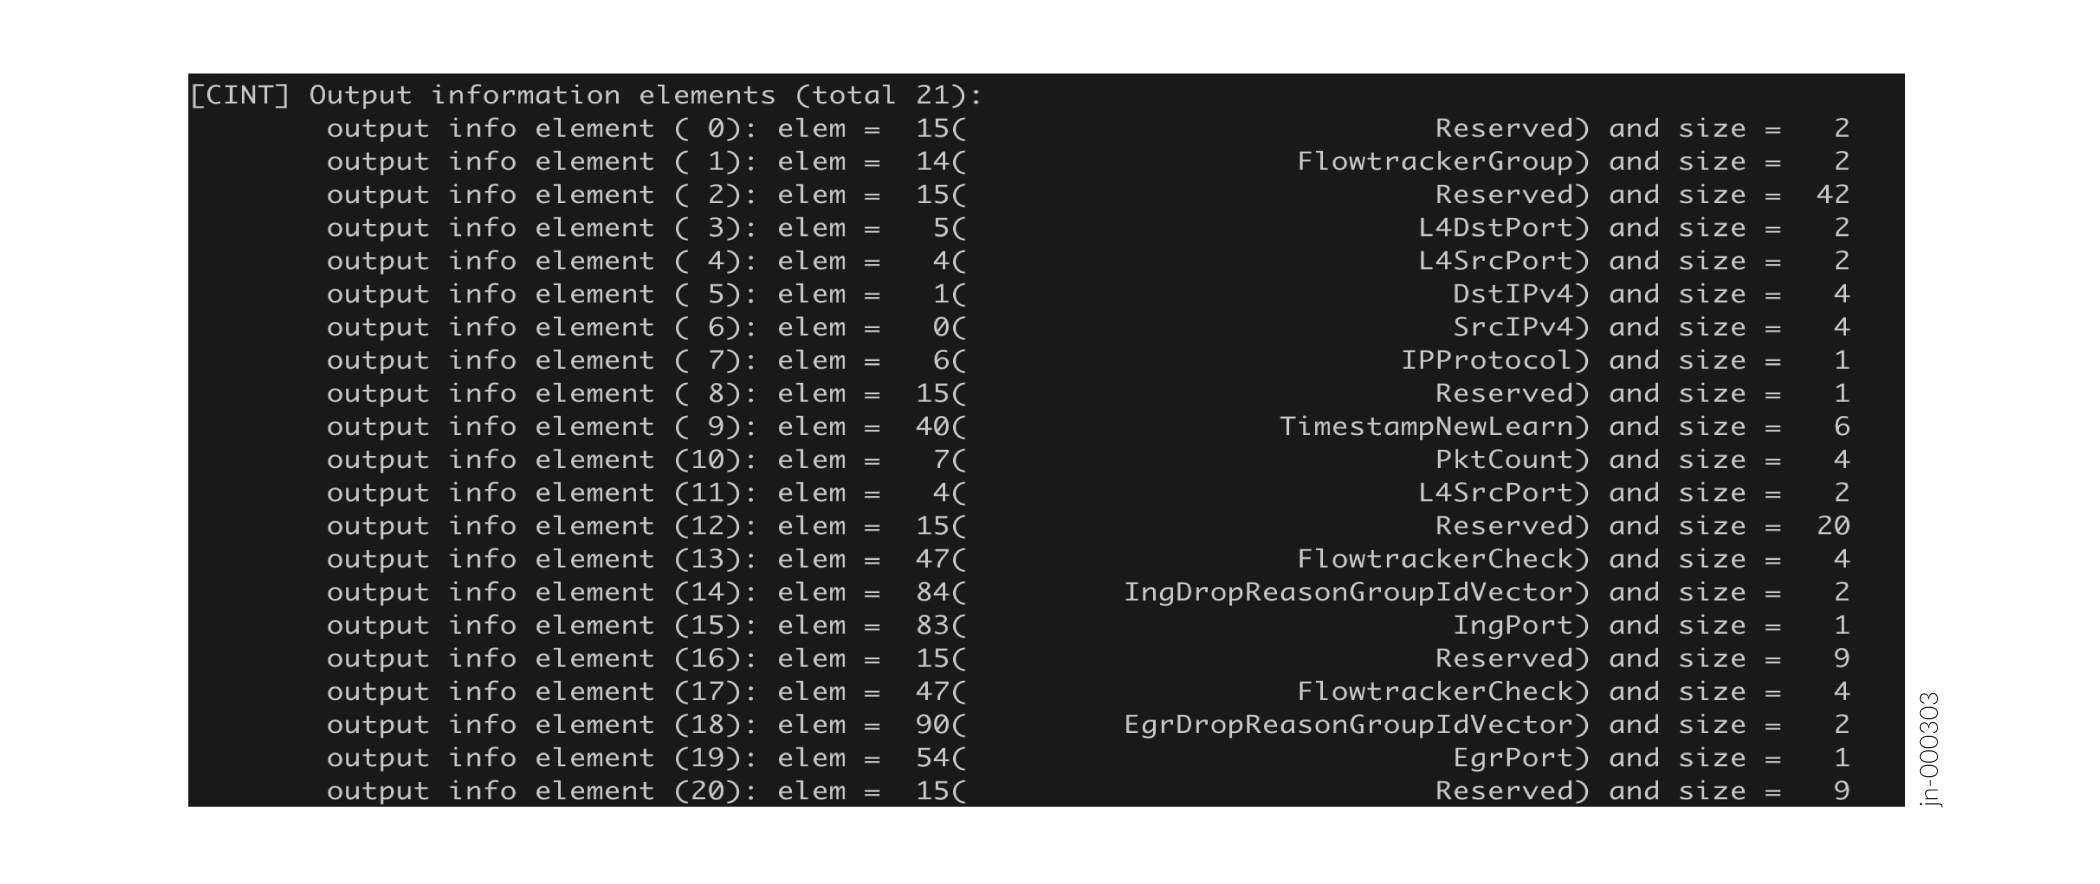
Figure 2 shows the format of a sample IPFIX data template for FBT:
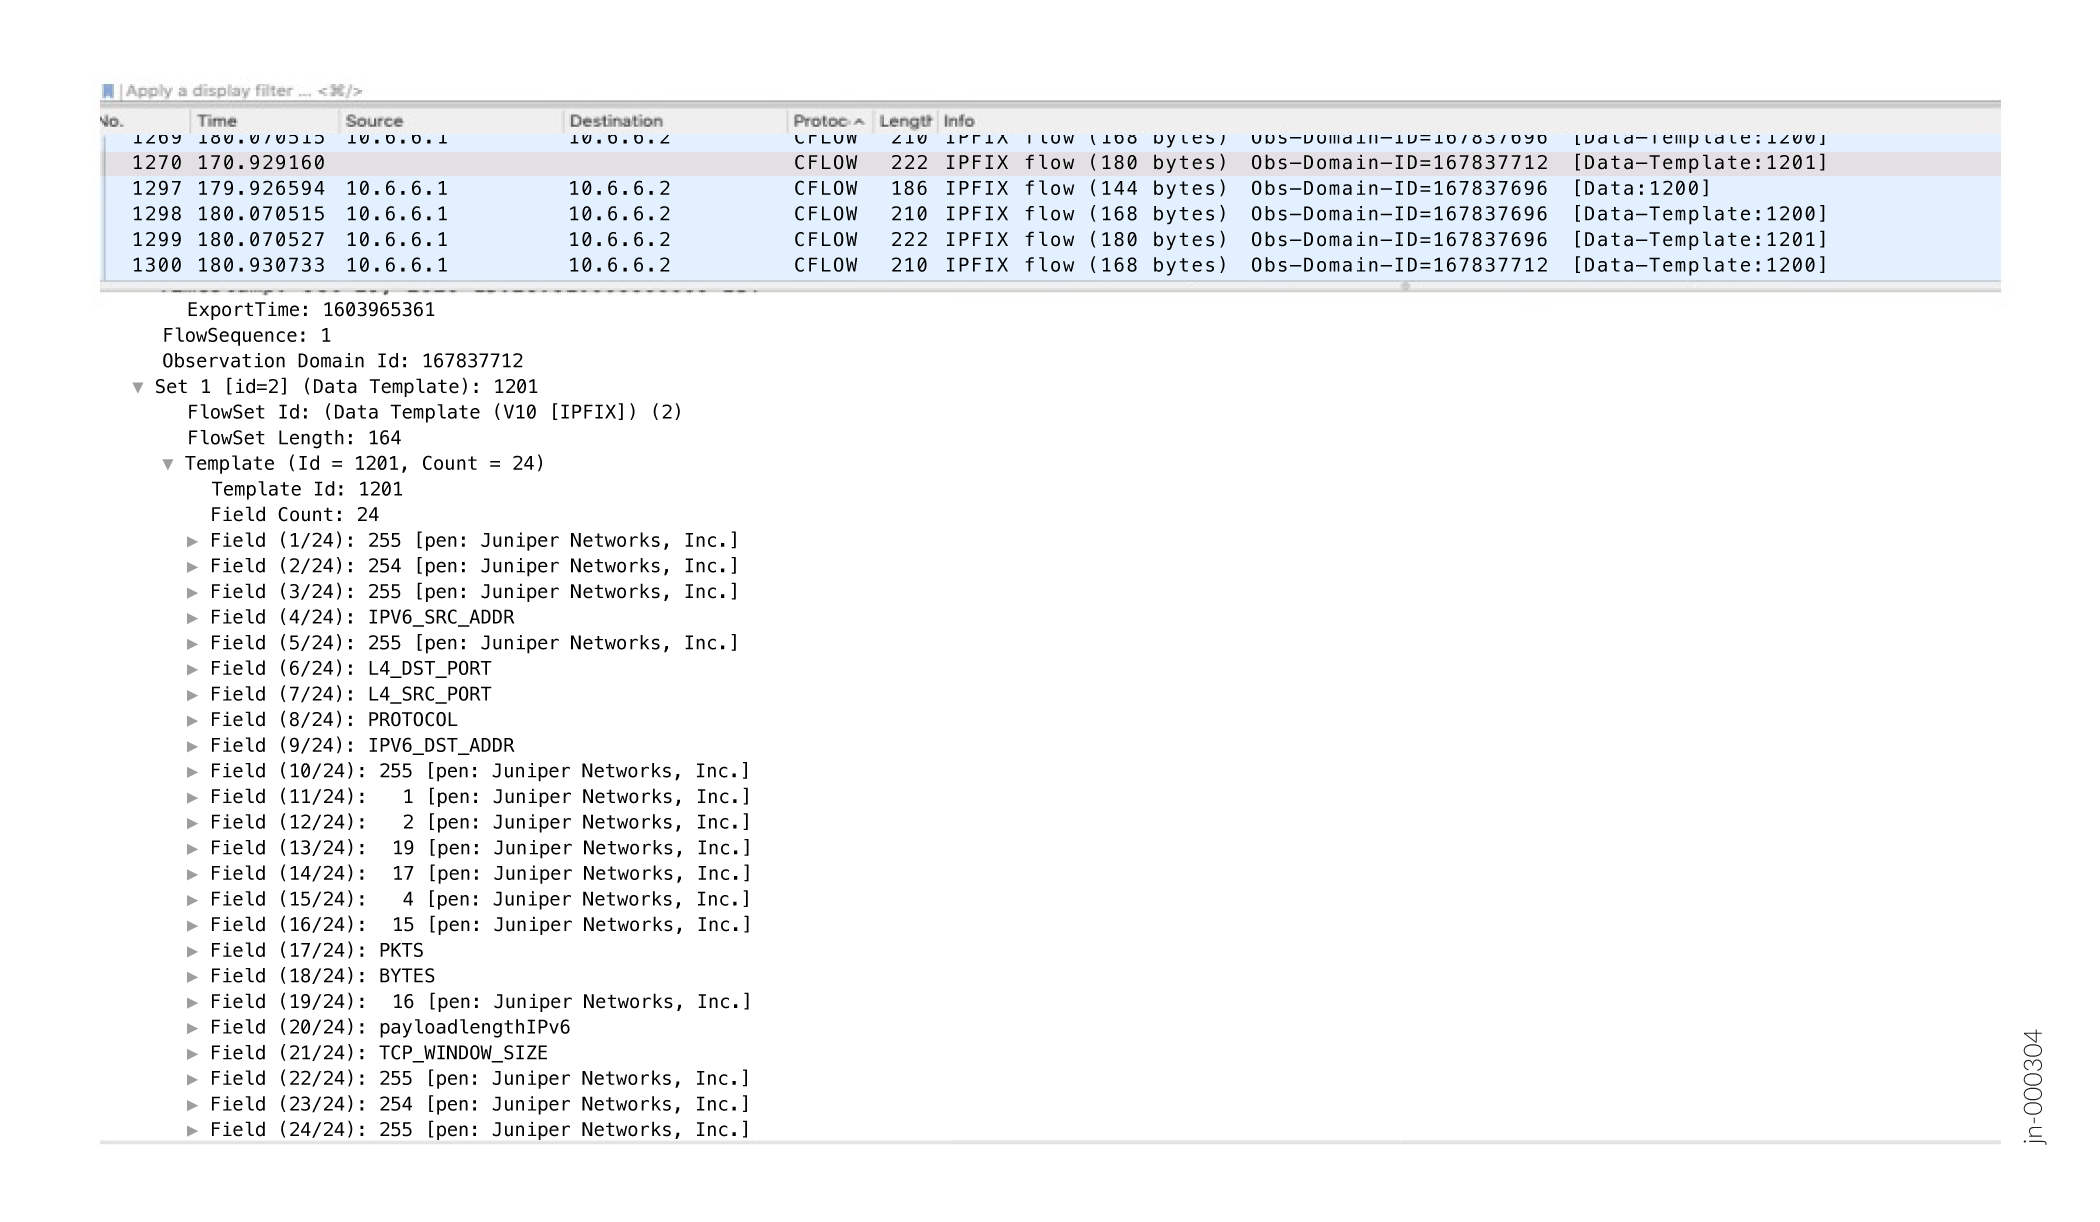
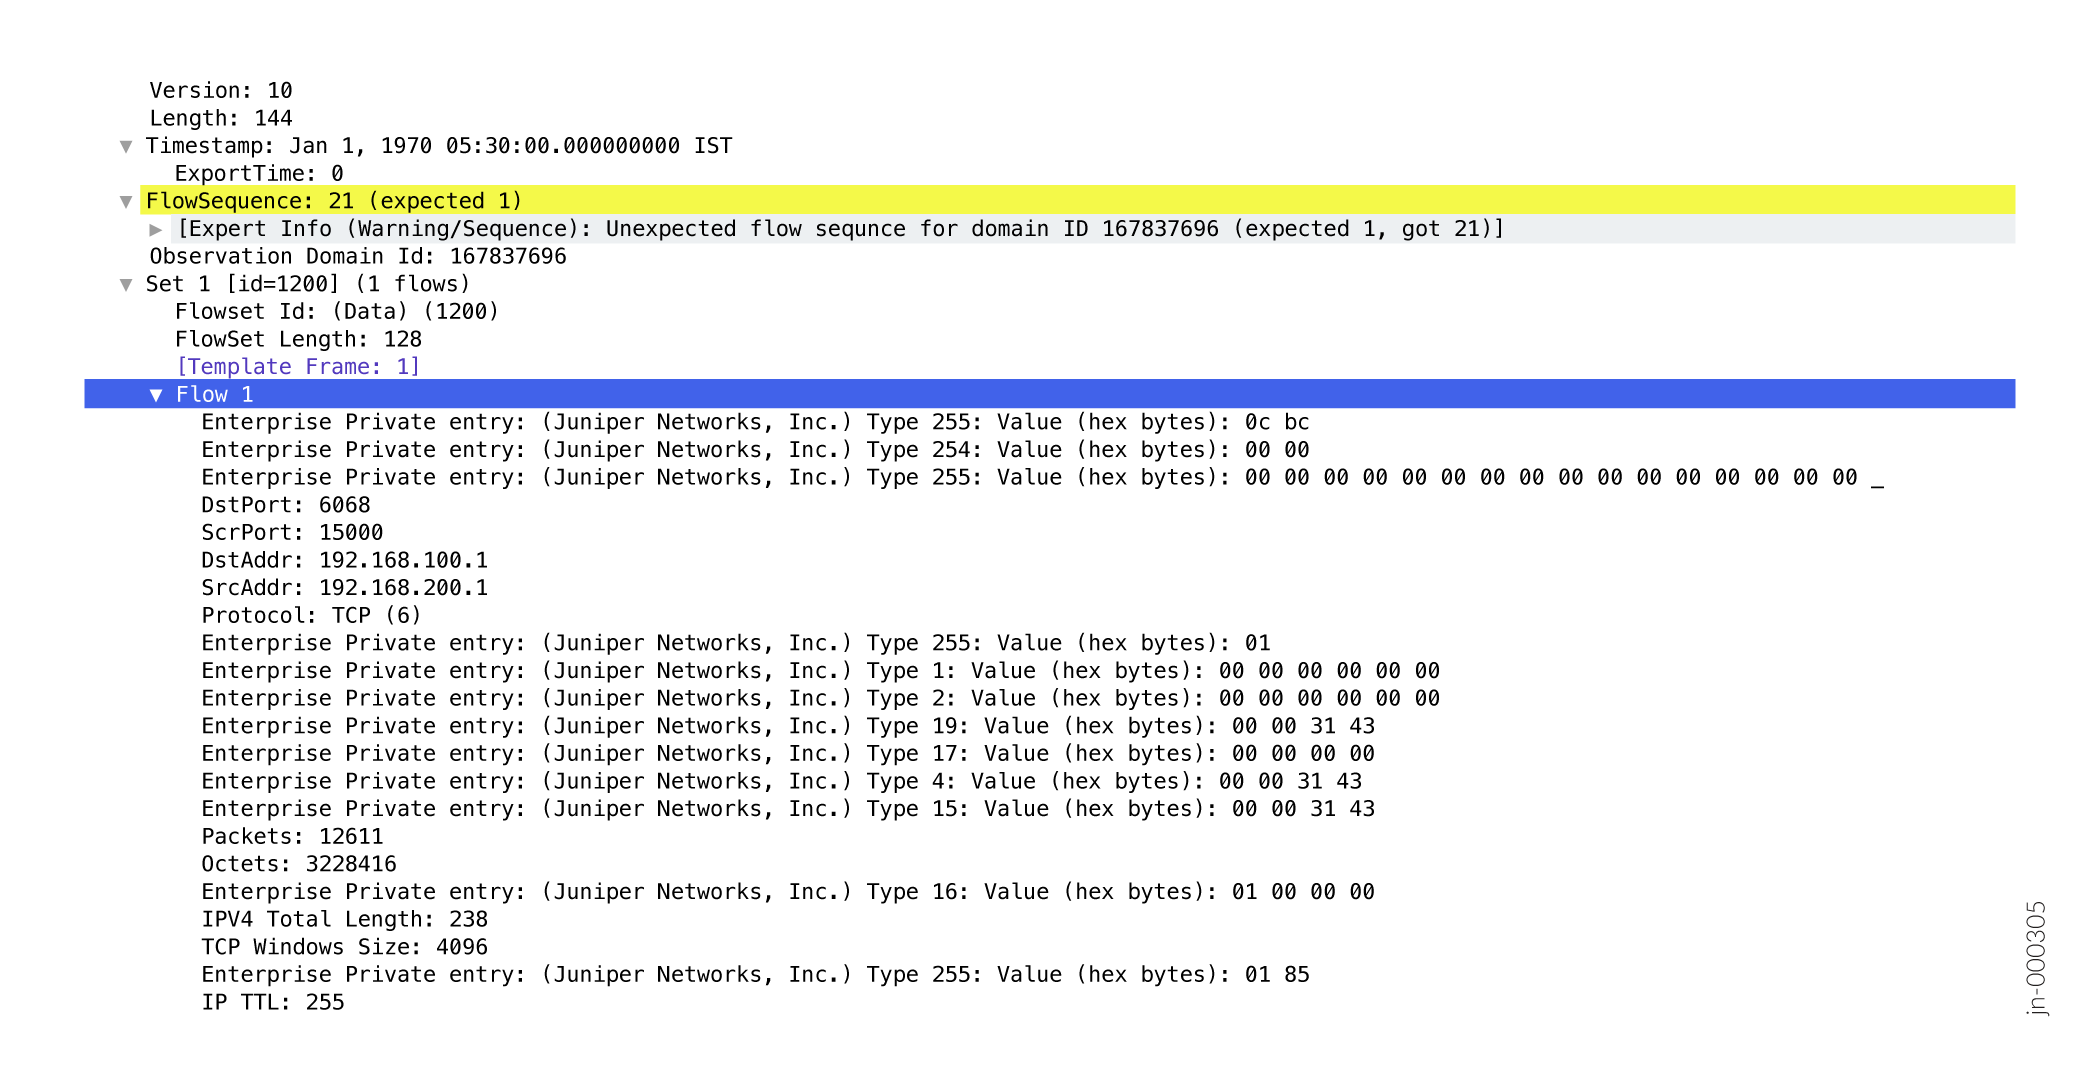
Figure 3 shows the format of a sample exported IPFIX flow for FBT:
| Element | Enterprise Element ID | Description |
|---|---|---|
|
TIMESTAMP_FLOWSTART_VAL |
1 |
Indicates the timestamp at which the TCP flow collection was started. |
|
TIMESTAMP_FLOWEND_VAL |
2 |
Indicates the timestamp at which the TCP flow collection was ended. |
|
TIMESTAMP_NEW_LEARN_VAL |
3 |
Timestamp when a new flow is learned in the flow table. |
|
PKT_RANGE_CNTR1_VAL |
4 |
Provides the number of packets in different size categories. User can opt for 4 categories or 6 categories under the template. The system categorises the packets into different size buckets accordingly and count. (counter-profile feature) |
|
PKT_RANGE_CNTR2_VAL |
5 |
Provides the number of packets in different size categories. User can opt for 4 categories or 6 categories under the template. The system categorises the packets into different size buckets accordingly and count. (counter-profile feature) |
|
PKT_RANGE_CNTR3_VAL |
6 |
Provides the number of packets in different size categories. User can opt for 4 categories or 6 categories under the template. The system categorises the packets into different size buckets accordingly and count. (counter-profile feature) |
|
PKT_RANGE_CNTR4_VAL |
7 |
Provides the number of packets in different size categories. User can opt for 4 categories or 6 categories under the template. The system categorises the packets into different size buckets accordingly and count. (counter-profile feature) |
|
PKT_RANGE_CNTR5_VAL |
8 |
Provides the number of packets in different size categories. User can opt for 4 categories or 6 categories under the template. The system categorises the packets into different size buckets accordingly and count. (counter-profile feature) |
|
PKT_RANGE_CNTR6_VAL |
9 |
Provides the number of packets in different size categories. User can opt for 4 categories or 6 categories under the template. The system categorises the packets into different size buckets accordingly and count. (counter-profile feature) |
|
PKT_RANGE_CNTR7_VAL |
10 |
Provides the number of packets in different size categories. User can opt for 4 categories or 6 categories under the template. The system categorises the packets into different size buckets accordingly and count. (counter-profile feature) |
|
PKT_RANGE_CNTR8_VAL |
11 |
Provides the number of packets in different size categories. User can opt for 4 categories or 6 categories under the template. The system categorises the packets into different size buckets accordingly and count. (counter-profile feature) |
|
MIN_PKT_LENGTH_VAL |
12 |
Provides the number of packets which have a size above the defined size. The configurable size range is between 64 and 9000 bytes. |
|
MAX_PKT_LENGTH_VAL |
13 |
Provides the number of packets which have a size below the defined size. The configurable size range is between 64 and 9000 bytes. |
|
TCP_WINDOW_RANGE_CNTR_VAL |
15 |
Counts the packets within the specified TCP window range. |
|
DOS_ATTACK_ID_VAL |
16 |
Reports the DDOS attack vector. |
|
TTL_RANGE1_CNTR_VAL |
17 |
Provides the number of packets within specific TTL value range. |
|
TTL_RANGE2_CNTR_VAL |
18 |
Provides the number of packets within specific TTL value range. |
|
DOS_ATTACK_PKT_CNTR_VAL |
19 |
Number of DDOS attack packets. |
|
CUSTOM_PKT_RANGE_START_VAL |
20 |
Provides the number of packets within the configured size
range. You can define the size range between 64 and 9000
bytes by configuring the |
|
CUSTOM_TTL_RANGE_START_VAL |
30 |
Provides the number of packets within the configured TTL
range. You can define the TTL range between 0 and 255 by
configuring the |
|
CUSTOM_TCP_WINDOW_RANGE_START_VAL |
40 |
Provides the number of packets within the configured TCP
window range. You can define the TCP window range between 0
and 65535 by configuring the
|
|
INTER_ARRIVAL_TIME |
50 |
The time difference between two consecutive packets at ingress (per flow). |
|
INTER_DEPARTURE_TIME |
51 |
The time difference between two consecutive packets at egress (per flow). |
|
CHIP_DELAY |
52 |
The amount of time the packet takes to transit the ASIC. |
|
SHARED_POOL_CONGESTION |
53 |
Shared pool congestion level |
|
QUEUE_CONGESTION_LEVEL |
54 |
Queue congestion level |
|
INGRESS_DROP_REASON |
55 |
The reason the packet is dropped at ingress. |
|
INGRESS_DROP_REASON_PKT_CNTR_VAL |
56 |
Number of packets dropped at ingress. |
|
EGRESS_DROP_REASON |
57 |
The reason the packet is dropped at egress. |
|
EGRESS_DROP_REASON_PKT_CNTR_VAL |
58 |
Number of packets dropped at egress. |
|
AGGREGATE_INTF_MEMBER_ID |
59 |
ID for a member of a link aggregation group (LAG) or an equal-cost multipath (ECMP) group |
|
AGGREGATE_INTF_GROUP_ID |
60 |
ID for a link aggregation group (LAG) |
|
MMU_QUEUE_ID |
61 |
Indicates the queue ID to which the packet belongs. |
|
UNKNOWN_ID_VAL |
254 |
Not applicable to customer. Internal to Juniper. |
|
RESERVED_ID_VAL |
255 |
Not applicable to customer. Internal to Juniper. |
When you create a new inline monitoring services configuration or change an existing one, the software immediately sends the periodic flow export of the data template to the respective collectors, instead of waiting until the next scheduled send time.
Limitations and Caveats
- IRB interfaces are supported. Starting in Junos OS Release 25.2R1 L2 firewall filters are supported.
- Only 8 inline-monitoring instances and 8 collectors per instance are supported.
- Flow records are limited to 128 bytes in length.
- The collector must be reachable through either the loopback interface or a network interface, not only through a management interface.
-
You can configure a collector only within the same routing instance as the data. You cannot configure a collector within a different routing instance.
- You cannot configure an option template identifier or a forwarding class.
- The IPFIX Option Data Record and IPFIX Option Data Template are not supported.
- Feature profiles are not supported on EX4400 switches.
- If you make any changes to the feature-profile configuration, you must reboot the device.
- (EX4100 and EX4100-F only) If you configure any of the congestion or egress features in the feature profile for an inline-monitoring instance, you cannot configure a counter profile for a template in that instance.
- (EX4100 and EX4100-F only) Because the congestion and egress features collect a lot of data, you can only configure 4 or 5 of these features per inline-monitoring instance.
- (EX4100 and EX4100-F only) For multicast flow tracking, one ingress copy can produce multiple egress copies. All copies may update the same entry. Therefore, you can track the aggregate results of all copies of the same multicast flow.
Licenses
You must get a permanent license to enable FBT. To check if you have a license
for FBT, issue the show system license command in operational
mode:
user@host> show system license
License usage:
                                 Licenses     Licenses    Licenses    Expiry
  Feature name                       used    installed      needed
  Flow Based Telemetry                  1            1           0    permanent
Licenses installed:
  License identifier: XXXXXXXXXXXXXX
  License version: 4
  Order Type: commercial
  Valid for device: XXXXXXXXXXXX
  Features:
    Flow Based Telemetry - License for activating Flow Based Telemetry
      Permanent
For the EX4100 and EX4100-F switches, you need license S-EX4100-FBT-P. For the EX4400 switches, you need license S-EX-FBT-P.
Drop Vectors (EX4100 and EX4100-F only)
FBT can report more than 100 drop reasons. Drop vectors are very large vectors, too large to be reasonably accommodated in a flow record. Therefore, the software groups and compresses the drop vectors into a 16-bit compressed drop vector, and then passes that drop vector to the flow table. The 16-bit compressed drop vector corresponds to a particular drop vector group. Table 2 and Table 3 describe how drop vectors are grouped together to form a particular 16-bit compressed drop vector.
| Group ID | Drop Reason |
|---|---|
| 1 |
MMU drop |
| 2 |
TCAM, PVLAN |
| 3 |
DoS attack or LAG loopback fail |
| 4 |
Invalid VLAN ID, invalid TPID, or the port is not in the VLAN |
| 5 |
Spanning Tree Protocol (STP) forwarding, bridge protocol data unit (BPDU), Protocol, CML |
| 6 |
Source route, L2 source discard, L2 destination discard, L3 disable, and so on. |
| 7 |
L3 TTL, L3 Header, L2 Header, L3 source lookup miss, L3 destination lookup miss |
| 8 |
ECMP resolution, storm control, ingress multicast, ingress next-hop error |
| Group ID | Drop Reason |
|---|---|
| 1 |
MMU unicast traffic |
| 2 |
MMU weighted random early detection (WRED) unicast traffic |
| 3 |
MMU RQE |
| 4 |
MMU multicast traffic |
| 5 |
Egress TTL, stgblock |
| 6 |
Egress field processor drops |
| 7 |
IPMC drops |
| 8 |
Egress quality of service (QoS) control drops |
Configure FBT (EX4100, EX4100-F, and EX4400 Series)
FBT enables per-flow-level analytics, using inline monitoring services to create
flows, collect them, and export them to a collector. A flow is a sequence of
packets that have the same source IP, destination IP, source port, destination
port, and protocol on an interface. For each flow, various parameters are
collected and sent to a collector using the open standard IPFIX template to
organize the flow. Once there is no active traffic for a flow, the flow is aged
out after the configured inactive-timeout period (configure the
flow-inactive-timeout statement at the [edit services
inline-monitoring template template-name] hierarchy level).
The software exports a IPFIX packet periodically at the configured flow-export
timer interval. The observation domain identifier is used in the IPFIX packet to
identify which line card sent the packet to the collector. Once set, the
software derives a unique identifier for each line card based upon the system
value set here.
To configure flow-based telemetry:
Change History Table
Feature support is determined by the platform and release you are using. Use Feature Explorer to determine if a feature is supported on your platform.
feature-profile name features
statement at the [edit inline-monitoring] hierarchy
level.