Inline Active Flow Monitoring on IRB Interfaces
You can perform inline active flow monitoring for IPv4 and IPv6 traffic on the integrated routing and bridging (IRB) interfaces on PTX Series routers.
Overview
On PTX Series routers, you can perform inline active flow monitoring for IPv4 and IPv6 traffic on the integrated routing and bridging (IRB) interfaces. Both IPFIX and version 9 templates for the flow monitoring are supported. For a description of the fields included in the templates, see Understand Inline Active Flow Monitoring.
Understand Inline Active Flow Monitoring on IRB interfaces
You can enable inline active flow monitoring by configuring the IPFIX or V9 templates on IRB interfaces.
- Sampling on an IRB Interface with Traffic Routed to a Tunnelled Core
- Layer 2 bridging and Layer 3 IP routing on an IRB interface
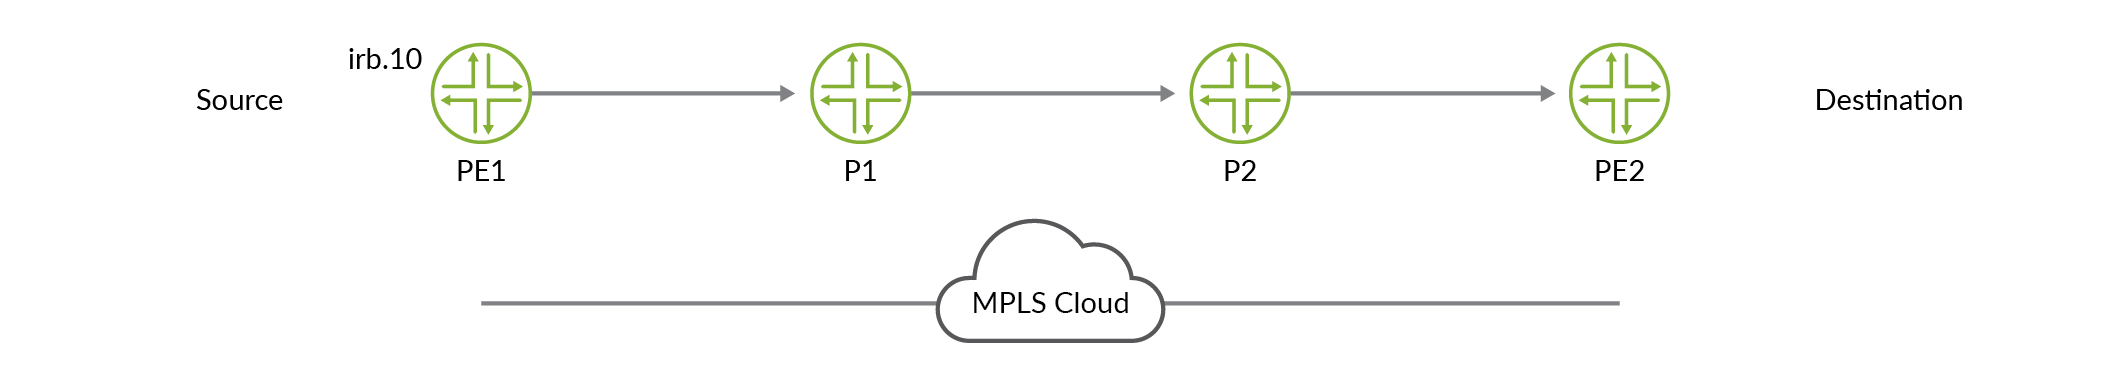
Sampling on an IRB Interface with Traffic Routed to a Tunnelled Core
Figure 1 illustrates sampling on an IRB interface where the traffic is routed to a tunnelled core, primarily an MPLS tunnel. The packets are entering irb.10 on which you can enable ingress sampling. The packets can be forwarded to a next hop which is not a part of any user-defined VLAN.
Layer 2 bridging and Layer 3 IP routing on an IRB interface
Figure 2 illustrates the topology where Layer 2 bridging and Layer 3 IP routing are supported on the same interface.
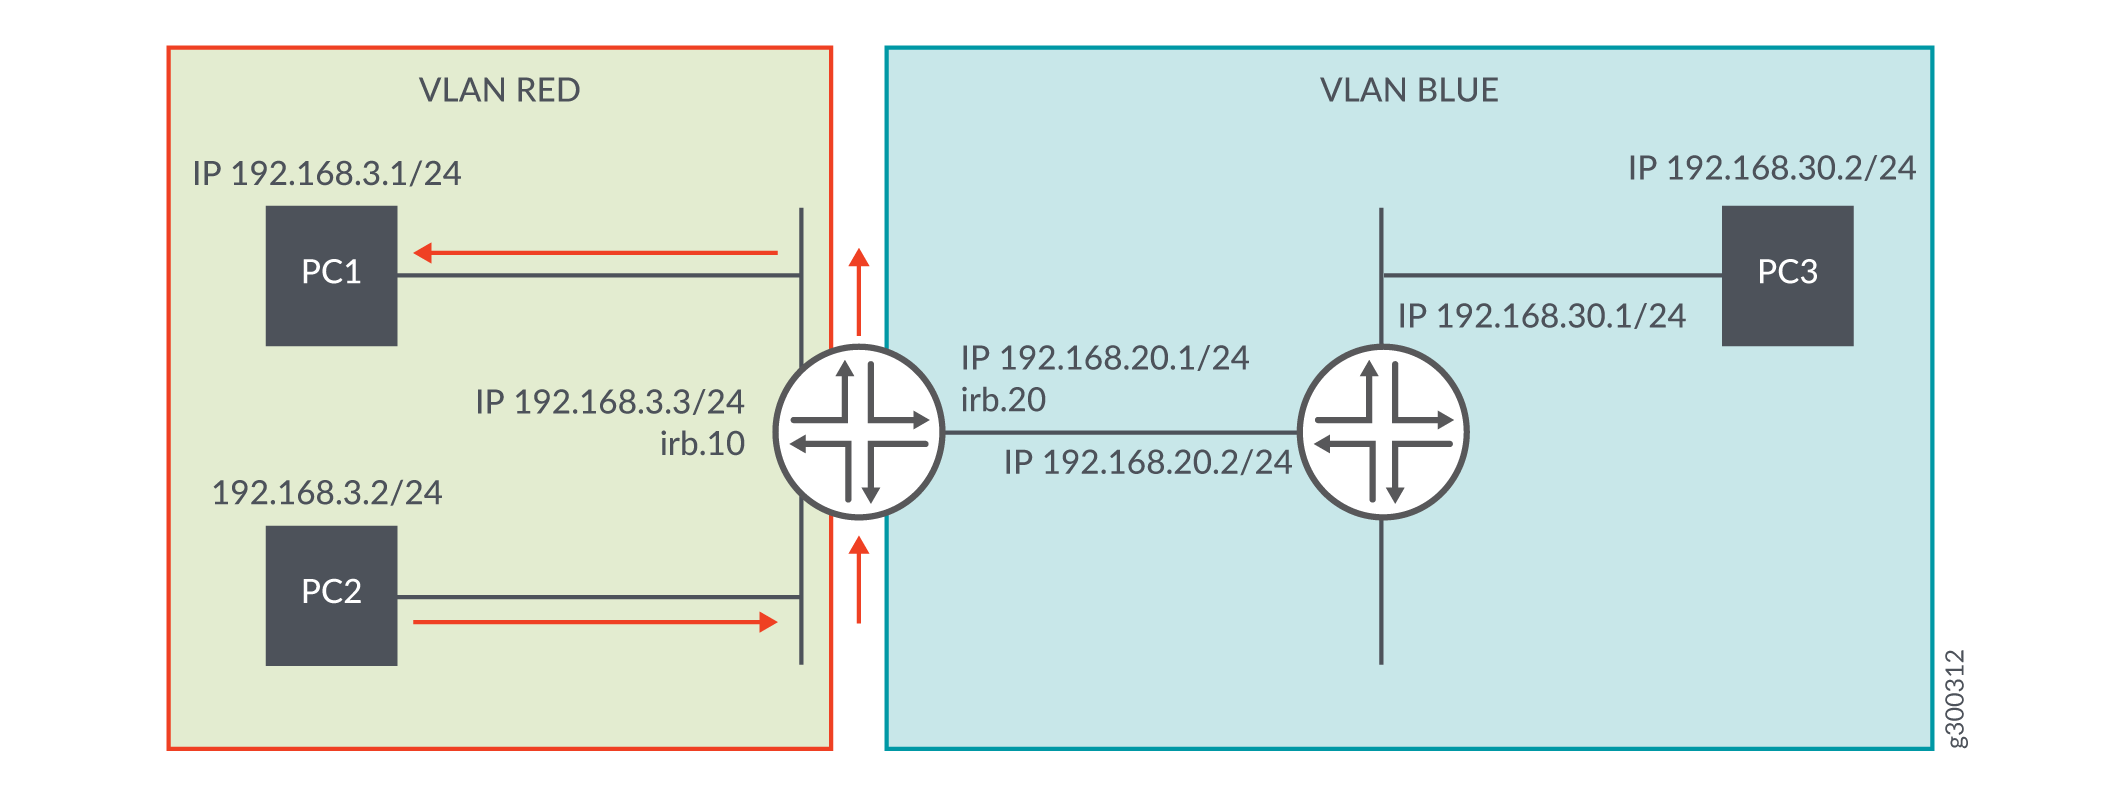
PC1 and PC2 are in VLAN RED (ID 10) and PC3 is in VLAN BLUE (ID 20).
For traffic moving from PC1 to PC3 or from PC2 to PC3, an IRB interface must be configured with a logical unit with an address in the subnet for VLAN RED and a logical unit with an address in the subnet for VLAN BLUE. The switch automatically directs routes to these subnets and uses these routes to forward traffic between VLANs. If traffic is flowing from VLAN RED to VLAN BLUE, you can configure ingress sampling on irb.10 and egress sampling on irb.20.
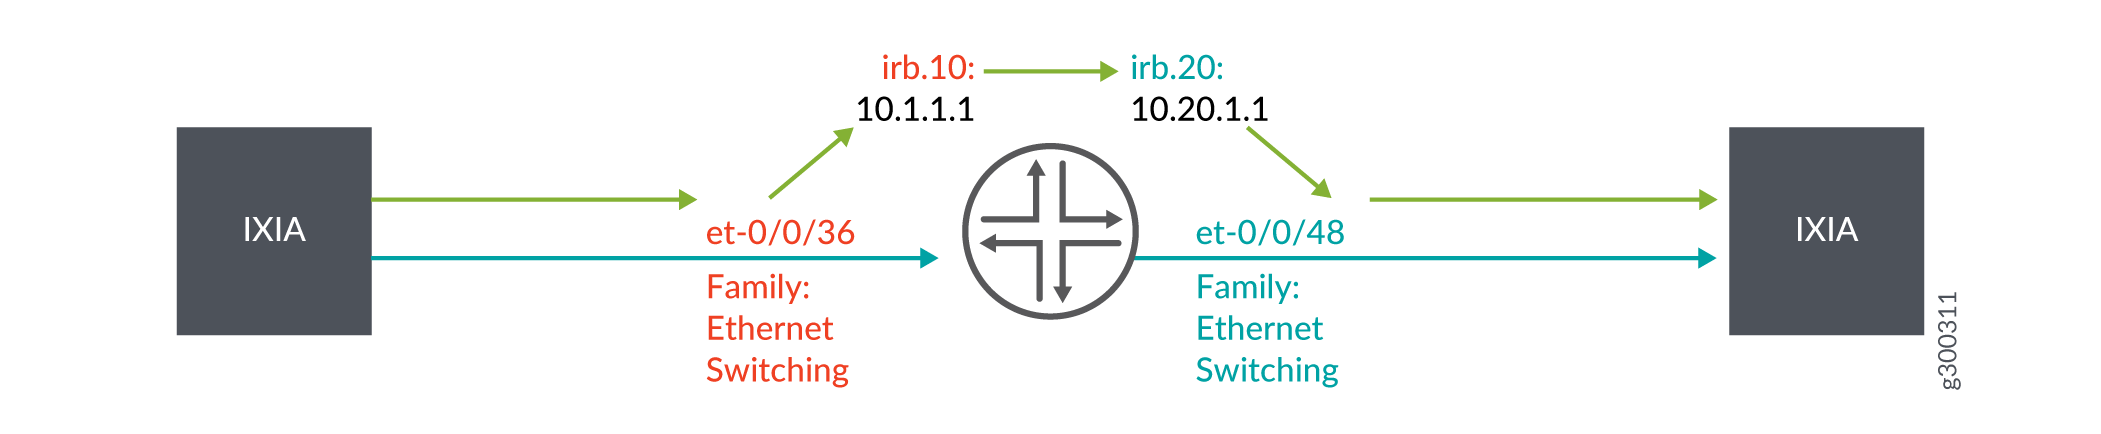
Figure 3 illustrates sampling in a topology where Layer 2 bridging and Layer 3 IP routing are supported on the same interface. The interfaces, et-0/0/36.0 and irb.10 belong to VLAN ID 10. The interfaces, et-0/0/48 and irb.20 belong to VLAN ID 20. Packets are entering irb.10 and exiting on irb.20. Hence, you can configure ingress sampling on irb.10 and egress sampling on irb.20.
Configure Inline Active Flow Monitoring on IRB Interfaces on PTX Series Routers
- Configure the Template to Specify Output Properties
- Configure the Sampling Instance
- Assign the Sampling Instance to an FPC
- Configure a Firewall Filter
- Associate a Layer 3 Interface with the VLAN to Route Traffic
- Assign the Firewall Filter to the Monitored Interface
Configure the Template to Specify Output Properties
Configure a template to specify the output properties for the flow records:
Configure the Sampling Instance
Configure a sampling instance:
Assign the Sampling Instance to an FPC
Assign the sampling instance to the FPC on which you want to implement flow monitoring.
[edit chassis]
user@host# set fpc slot-number sampling-instance instance-name
For example:
[edit chassis]
user@host# set fpc 0 sampling-instance s1
Configure a Firewall Filter
Configure a firewall filter to specify the family of traffic to accept and sample.
Associate a Layer 3 Interface with the VLAN to Route Traffic
Assign the IRB Interface to the VLAN.
[edit vlans vlan-name]
user@host# set vlan-name vlan-id vlan-id-number


user@host# set vlan-name l3-interface l3-interface-name

                     .logical-interface-number
For example:
[edit vlans vlan-name]
user@host# set vlan10 vlan-id 10
user@host# set vlan10 l3-interface irb.10
For example, if you are configuring inline flow monitoring using IRB while supporting layer 2 bridging and layer 3 IP routing on the same interface (See Figure 3):
[edit vlans vlan-name]
user@host# set vlan-10 vlan-id 10
user@host# set vlan-10 l3-interface irb.10
user@host# set vlan-20 vlan-id 20
user@host# set vlan-20 l3-interface irb.20
Assign the Firewall Filter to the Monitored Interface
Assign the input firewall filter to the interface you want to monitor. Also, configure the VLANs for which the interface can carry traffic.
[edit interfaces]
user@host# set interface-name unit logical-unit-number family (inet | inet6 | mpls) filter input filter-name
address
For example, if you are configuring inline flow monitoring using IRB while supporting layer 2 bridging and layer 3 IP routing on the same interface (See Figure 3):
[edit interfaces]
user@host# set et-0/0/36 unit 0 family ethernet-switching vlan members vlan10
user@host# set et-0/0/48 unit 0 family ethernet-switching vlan members vlan20
user@host# set et-0/0/60 unit 0 family inet address 10.10.10.1
user@host# set irb unit 1 family inet filter input f2
user@host# set irb unit 1 family inet address 10.1.1.1
user@host# set irb unit 2 family inet address 10.20.1.1
user@host# set irb unit 1 family inet address 10.1.1.1
user@host# set irb unit 2 family inet filter output f2
Change History Table
Feature support is determined by the platform and release you are using. Use Feature Explorer to determine if a feature is supported on your platform.