ON THIS PAGE
Audit Logs
View audit logs to monitor administrative activities that can trigger changes in your network.
Audit logs are a record of all administrative activities in an organization that can trigger changes in the network. These actions include changes to the network model, device configurations, and system settings. On the Audit Logs dashboard, you can view information for different types of activities and events such as creation or deletion of WLANs, updating an AP, or adding policies.
Features
-
- You can trace configuration changes on your network by leveraging long-term storage of audit logs.
- With audit logs, you can monitor user activity, investigate security breaches, and ensure compliance with regulatory requirements.
- On the Audit Logs dashboard, you can filter data as needed and view granular-level details of each event.
Before You Begin
-
Refer to Mist Premium Analytics Trial License to know about license requirements for Juniper Mist™ Premium Analytics.
- Become familiar with the options available on the Juniper Mist Premium Analytics dashboards. See Figure 3.
Access Audit Log Analytics
Audit Log Dashboard
The Audit Log dashboard includes various tiles that provide graphical representations of analytics at a granular level.
On the top of the dashboard, you can view a detailed audit report for the selected time period.
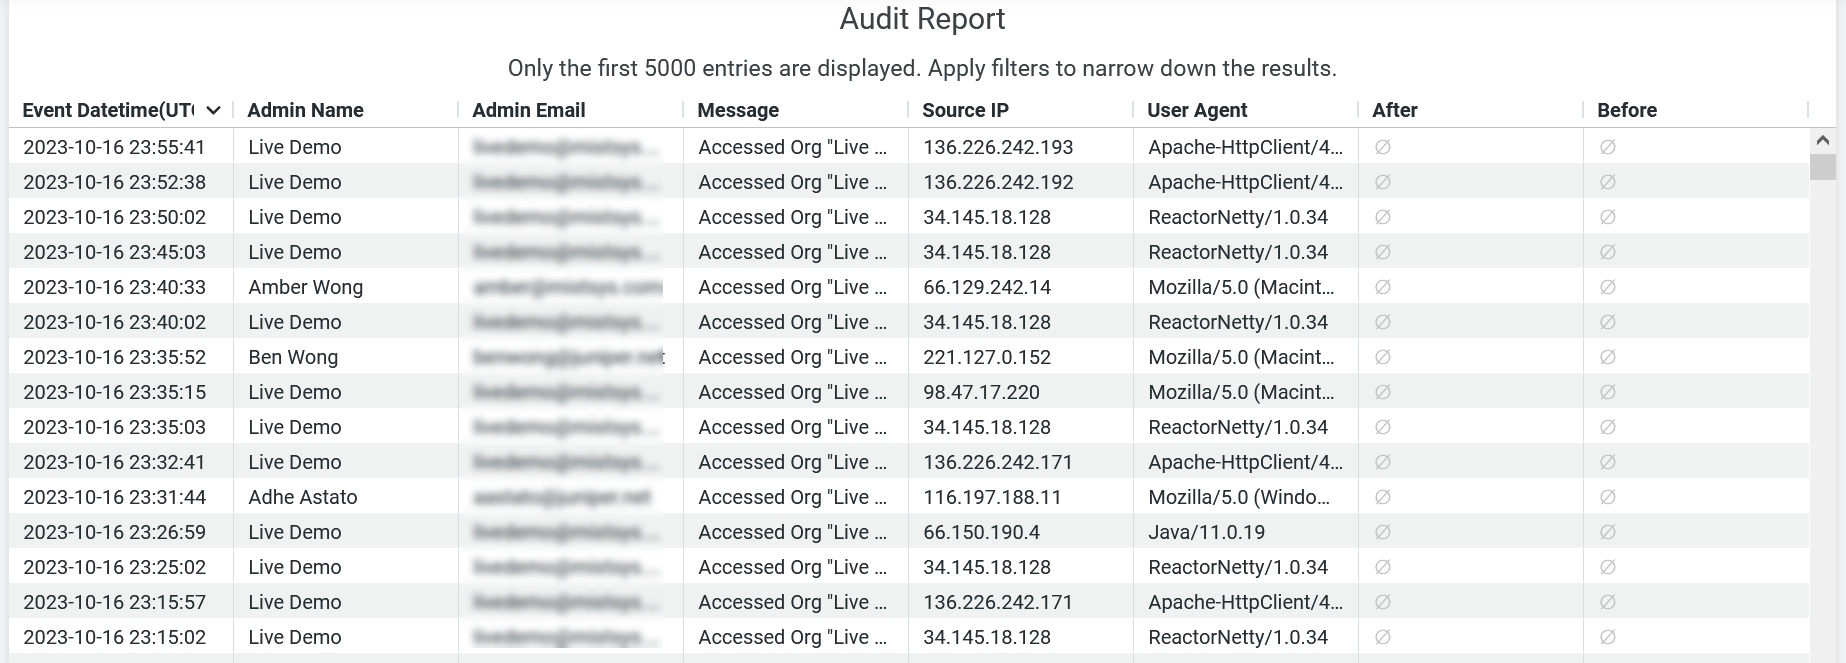
You can view the chart displaying the following details:
- Event Date and Time—Time stamp of the event’s occurrence.
- Admin Name—Username of the administrator whose audit logs you want to view.
- Admin Email—E-mail address of the user whose audit logs you want to view.
- Message—Description of a task.
- Source IP—IP address of the user's device.
- User Agent—Software stack used to make a web request.
- After—Logs after the occurrence of a specific event.
- Before—Logs before the occurrence of a specific event.
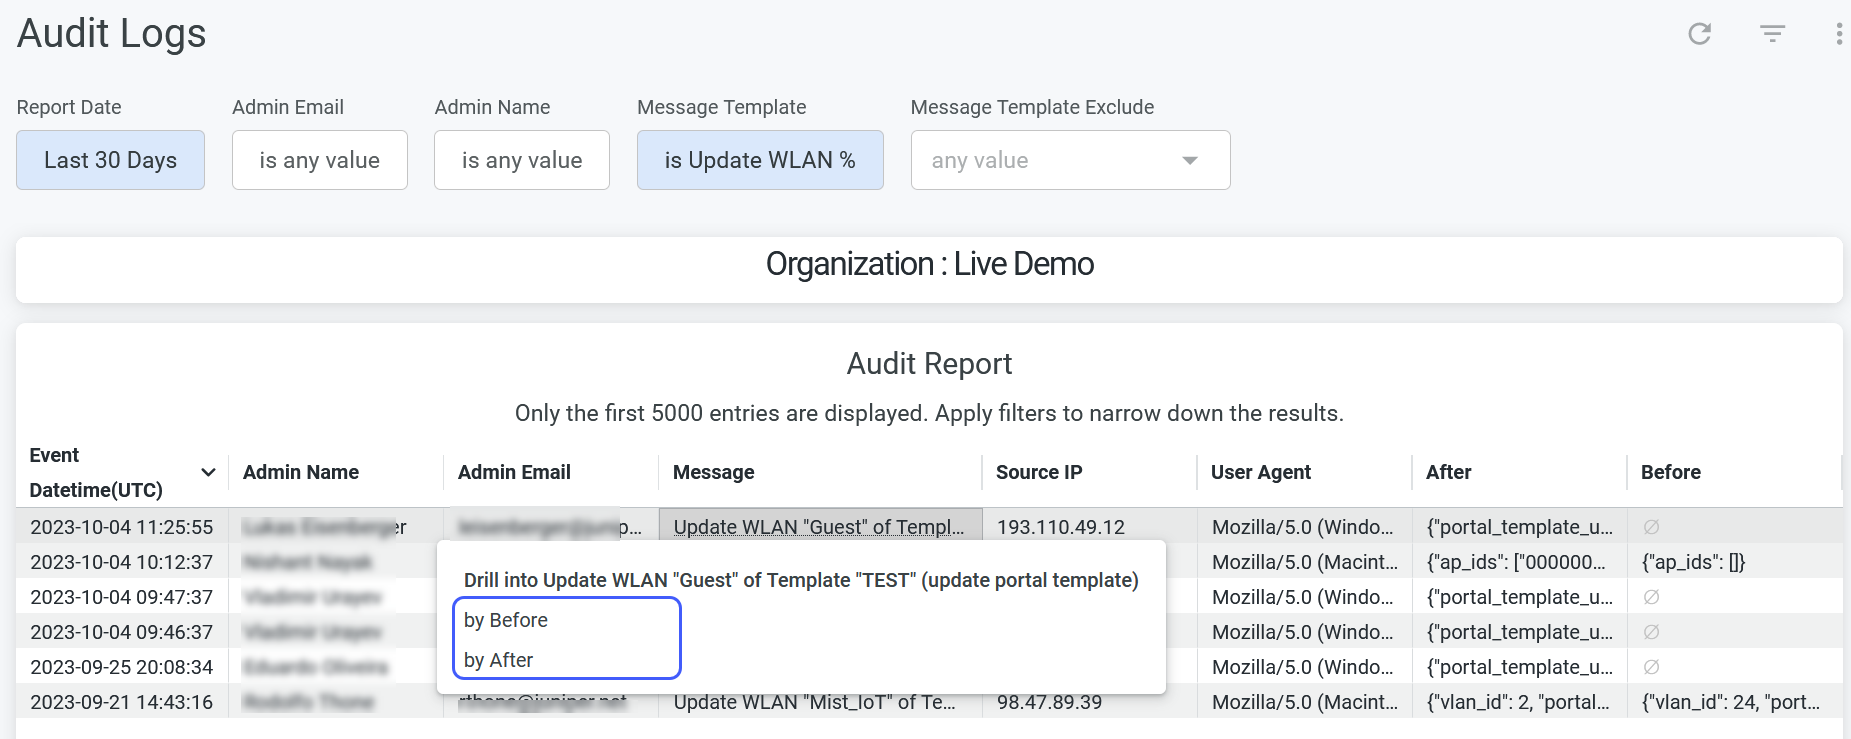
For certain types of events such as change in WLAN, you can find additional details.
To view additional details, click the message and select either the By Before or By After option.
The audit record opens in a new window. On this report, you can see information as shown in Figure 3.
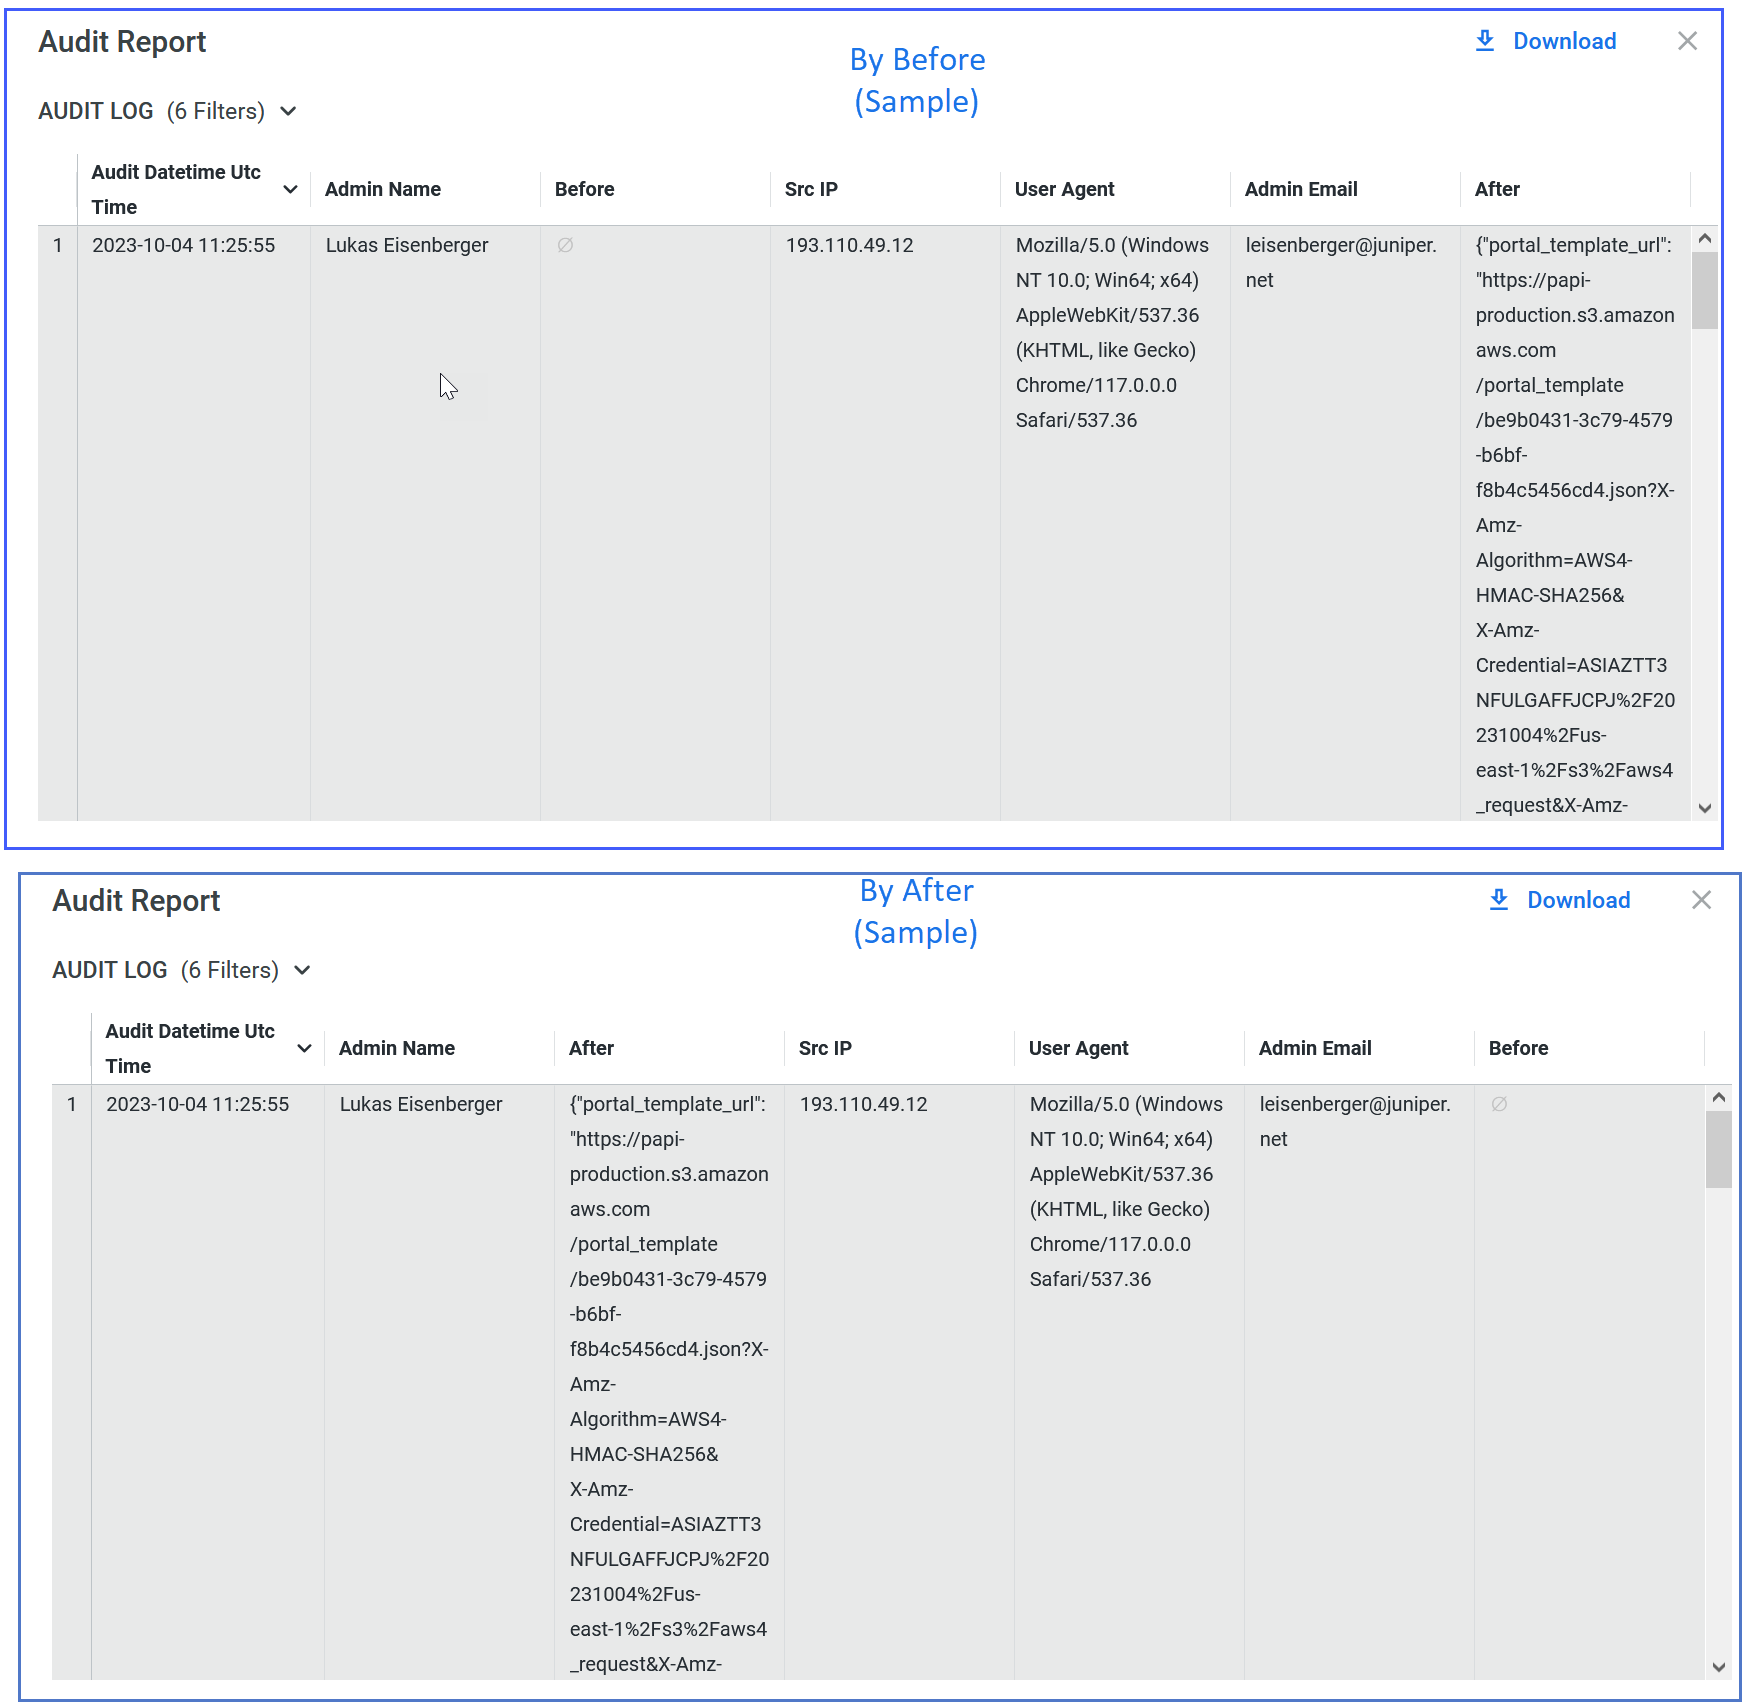
You can see that the After and Before columns provide additional information.
Top Actions by User and Type
The tile displays users, the percent of events that each user performs, and the percentage of occurrences of each event type.
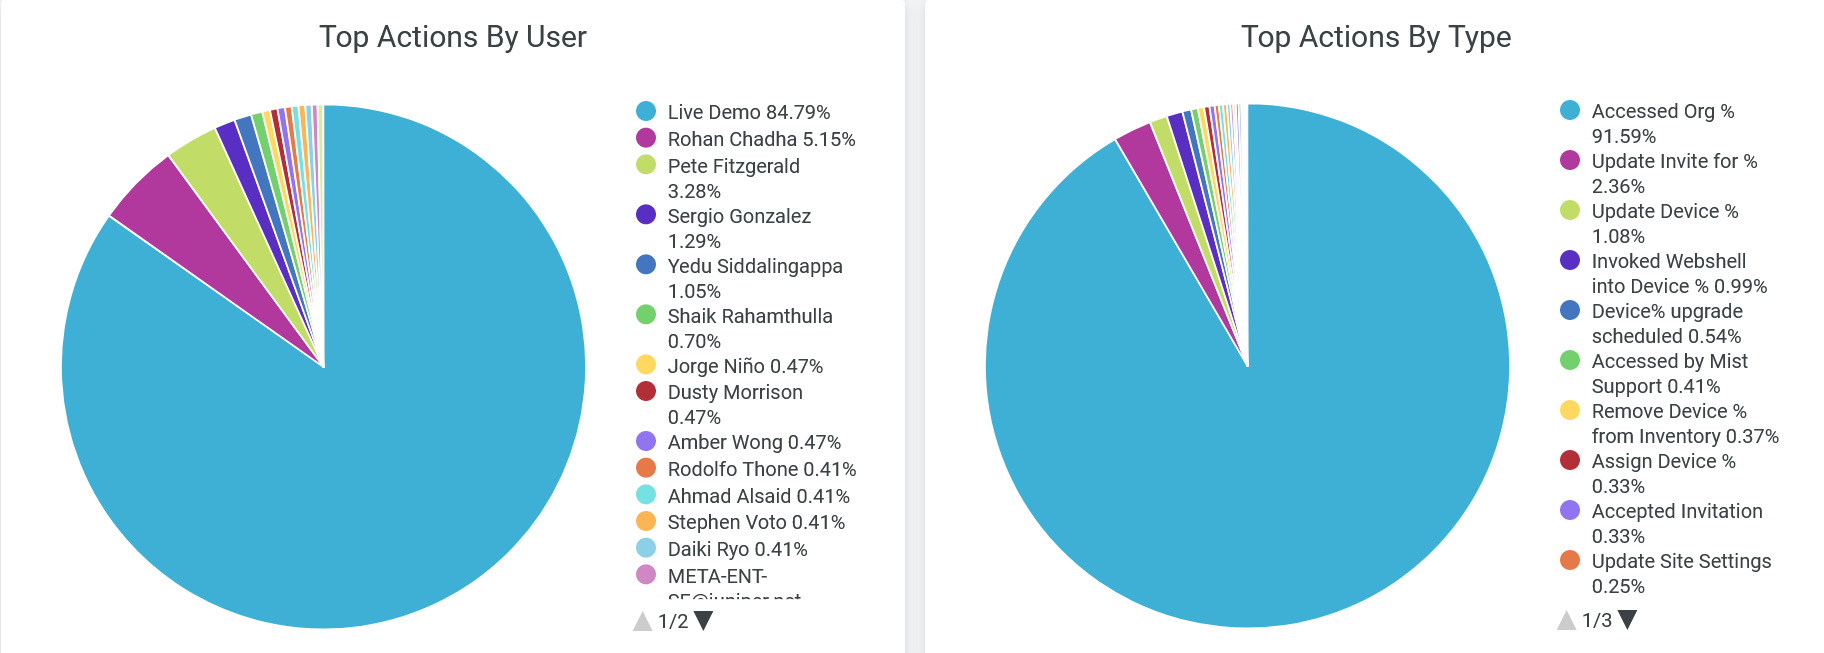
In the Top Actions by Users chart, you can view the users who triggered the events that occurred in the selected time period. The legend shows the names of users with the percentage of events that each user triggered. You can place the cursor on a wedge in the pie chart to see the number of logs for an event and the associated username.
In the Top Actions by Type chart, you can view the distribution of event types, based on the number of occurrences of each event type, expressed as percentages. The legend shows the event types and the corresponding percentage of each type. You can place the cursor on a wedge in the pie chart to see the number of occurrences for an event type.
To hide data for a user or an event type in the charts and see data for only the remaining ones, click the username or the event type in the legends.