Switch Insights
Get end-to-end visibility for switch usage and view analytics about your wired network.
The report provides in-depth information including interface utilization, VLAN traffic trends, and switch and port usage. You can easily see the status of each port and the interfaces that are currently connected to the switch.
Features and Benefits
-
Provides insights on organization-wide usage of switches and ports at a granular level. With these insights, you can spot the areas of the network that experience problems.
-
Monitors the amount and types of traffic passing through the ports and interfaces of switches
-
Provides details about the client devices connected to the switches and ports in your network
Before You Begin
-
See the Juniper Mist Wired Configuration Guide for the wired configuration details.
-
See Mist Premium Analytics Trial License to know about license requirements for the Juniper Mist Premium Analytics dashboard.
- Become familiar with the options available on the Juniper Mist Premium Analytics dashboard. See Figure 3.
Access Switch Insights Dashboard
To access the Switch Insights dashboard:
-
On the Premium Analytics page, click Switch
Insights.
Figure 1: Access Premium Analytics
 The Switch Insights dashboard appears.
Switch Insights Tiles
At the top of the dashboard, you can get insights of switches in your site. The dashboard displays the number of ports, media types, port status, and ports operating mode.
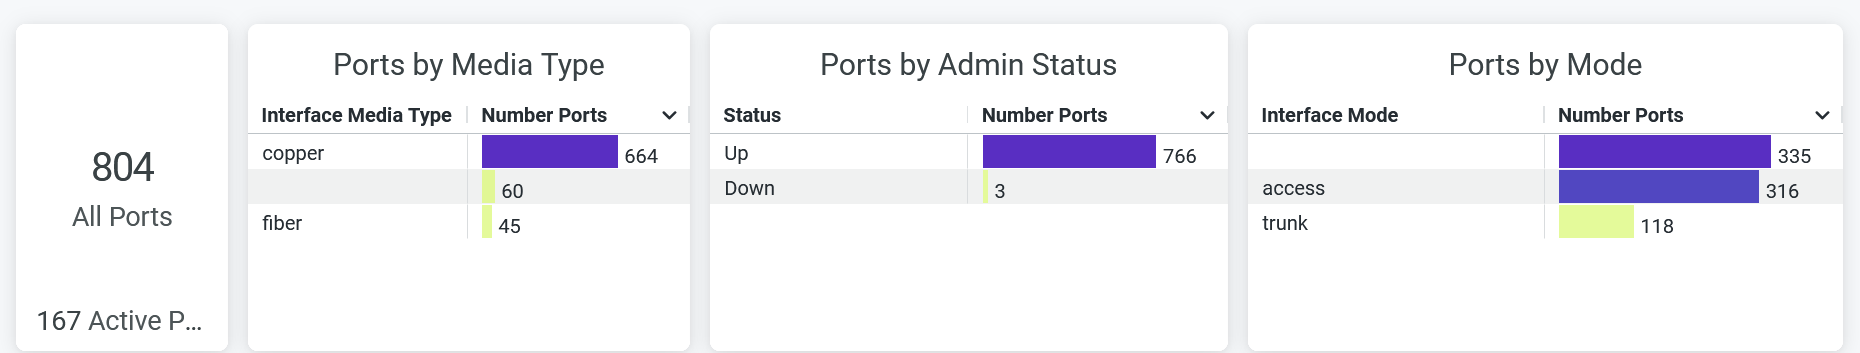
The tile displays the following details:
-
Total count of ports and the count of ports in use
-
Count of ports classified by media type (copper or fiber)
Click the chart to open a new window with additional details such as the list of switches, interface names, and other statistics.
.
-
Number of ports that are up and down
-
Number of ports classified by interface mode (access or trunk)
Click the chart to open a new window with additional details such as list of switches, interface names, and other statistics.
- Interface Details
- Interface Traffic Trends in GB
- Interface Utilization Trends
- VLAN Traffic Trends
- Port and Switch Insights
- Active Ports Trend by Port Profile
Interface Details
The tile displays the details of the switches with traffic utilization details.
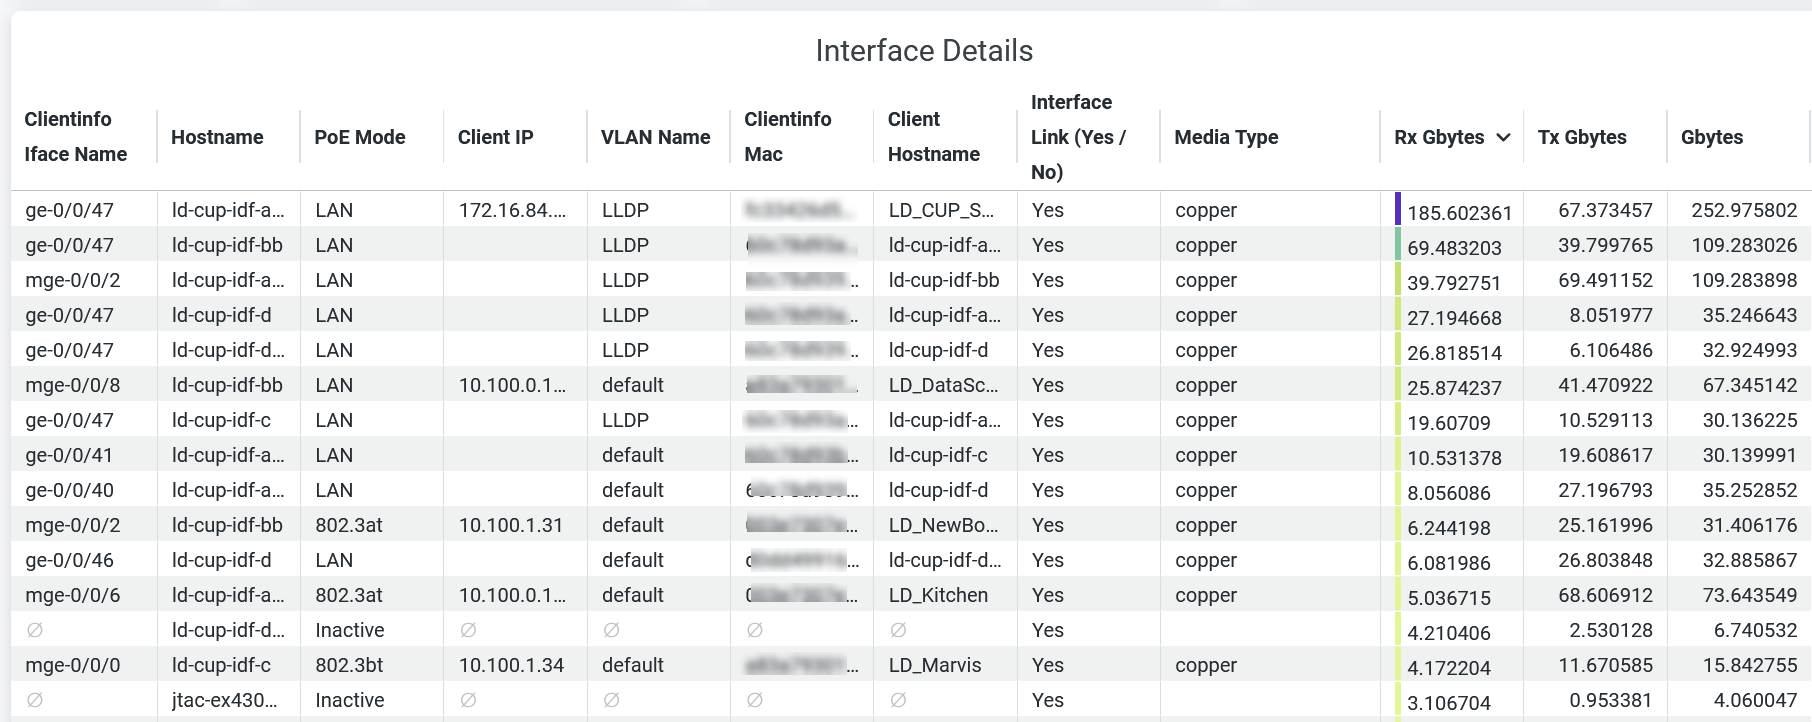
You can see:
-
Interface Name —Interface configured on the switch.
-
Hostname—Hostname of the switch.
-
PoE Mode—Hostname of the switch.
-
Client IP—IP address of the client device.
-
VLAN Name—Name of the associated VLAN.
-
Client Info MAC—MAC address of the client device.
-
Client Hostname—Hostname of a client.
-
Interface Link—Link status of an interface.
-
Media Type—Interface media type (copper or fiber).
-
Traffic usage—Total volume of traffic usage by an interface.
-
Rx Gbytes—Traffic volume that an interface receives.
-
Tx Gbytes—Traffic volume that an interface transmits.
Interface Traffic Trends in GB
The tile shows the interface traffic trends over a period of time.
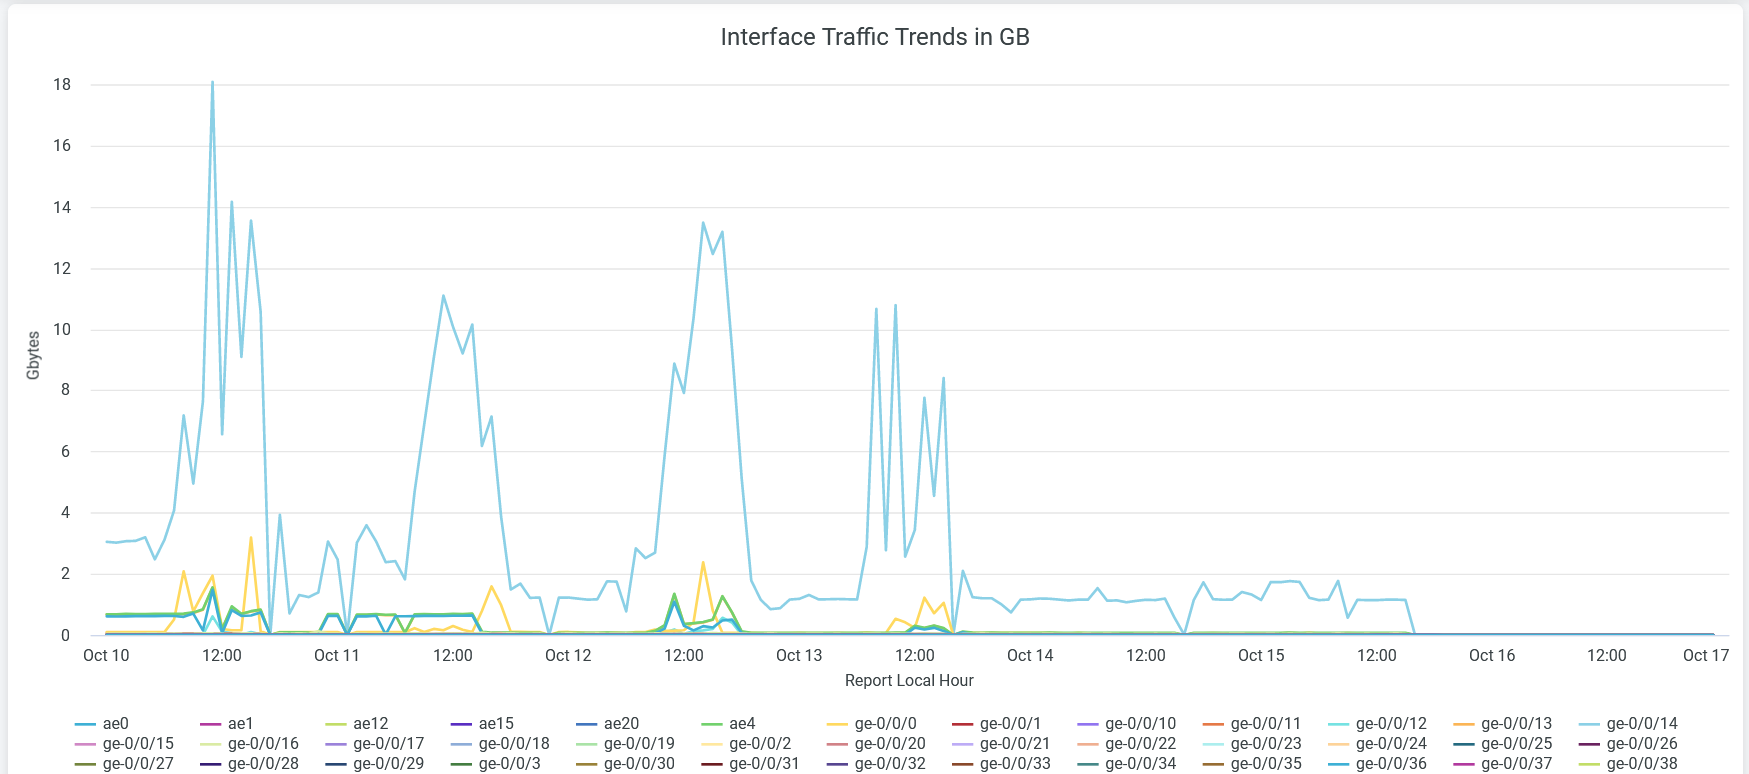
Place the cursor on a line graph, which represents an interface, to see the actual volume of traffic through that interface.
The legend below the chart shows all the interfaces. To hide the traffic details of an interface from the chart and see only the details of the remaining interfaces, click the interface in the legend below.
Interface Utilization Trends
The tile shows the percentage of interfaces utilized over a period of time.
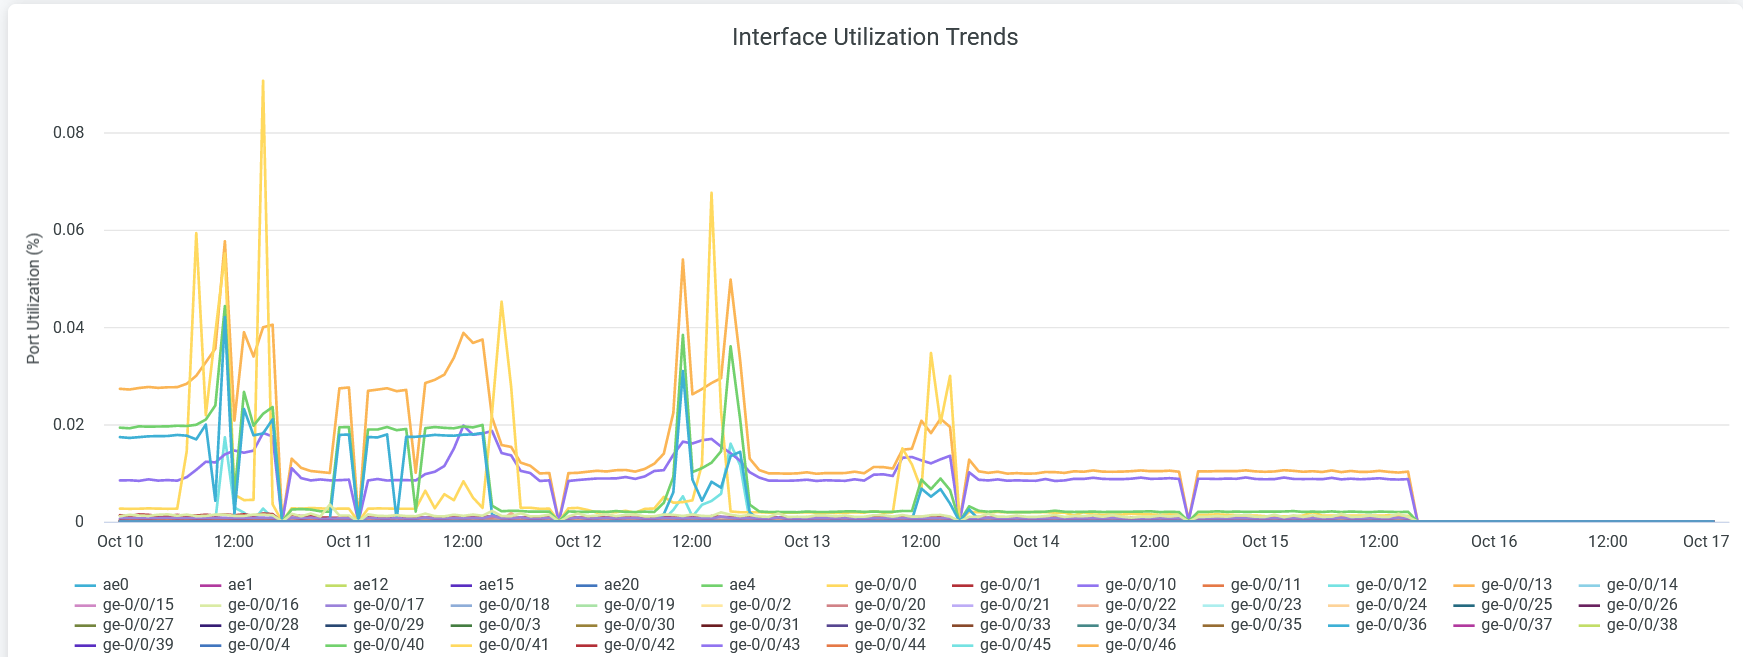
Place the cursor on a line graph, which represents an interface, to see the actual utilization percentage of that interface.
The legend below the chart shows all the interfaces. To hide the traffic details of an interface from the chart and see only the details of the remaining interfaces, click the interface in the legend below.
VLAN Traffic Trends
The tile shows the volume of VLAN traffic trend over a period of time.
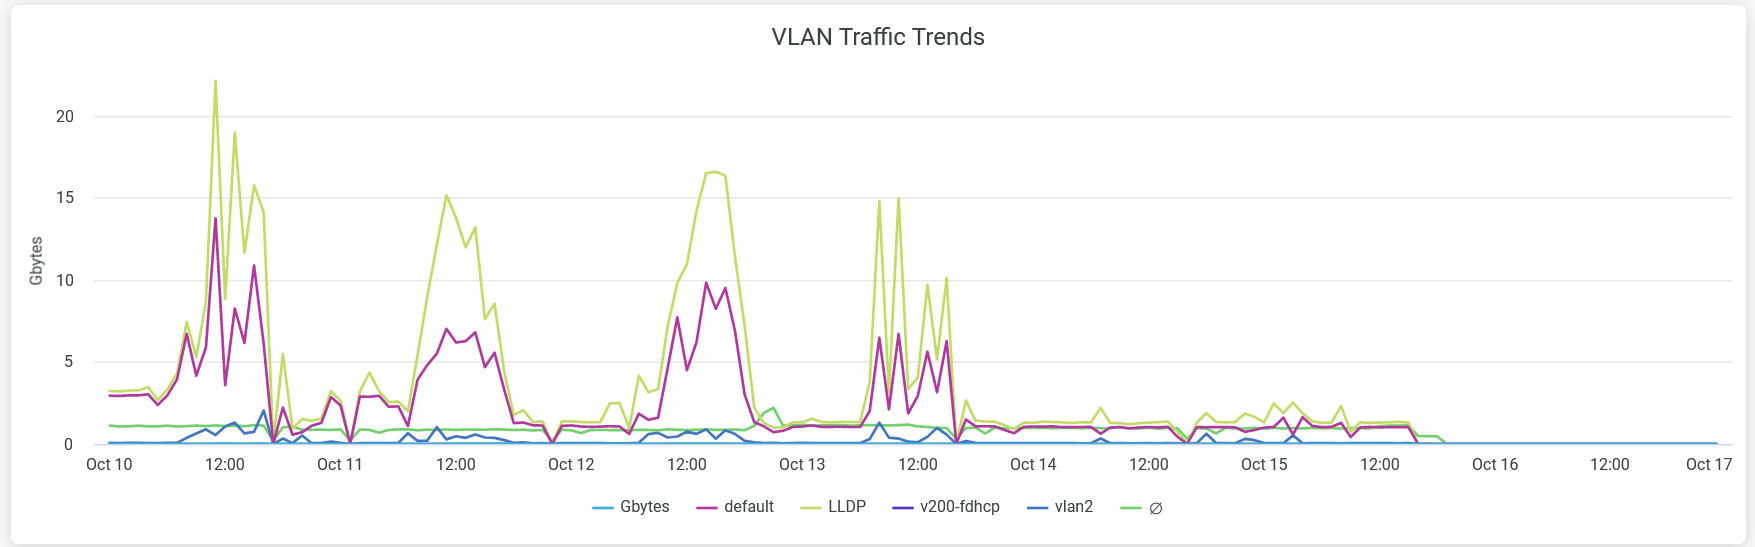
Place the cursor on a line graph, which represents a VLAN network, to see the actual traffic utilization for that network.
The legend below the chart shows all the VLAN networks. To hide the traffic details of a VLAN network from the chart and see only details of the remaining ones, click the VLAN network in the legend below.
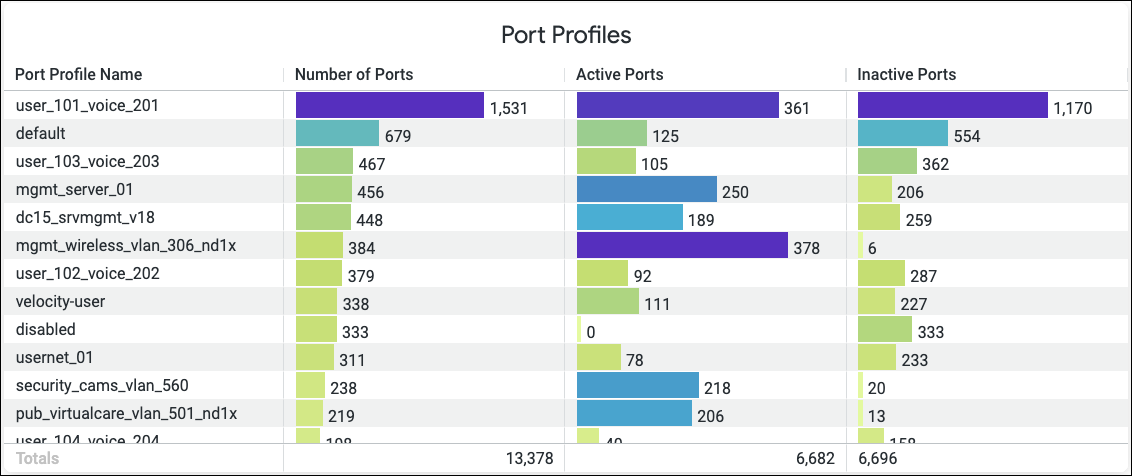
Port and Switch Insights
This tile provides visibility into the usage of port profiles in your organization. You can view the number of ports associated with the port profile, and the number of active and inactive ports. This information allows you to monitor and manage the port utilization in your organization.
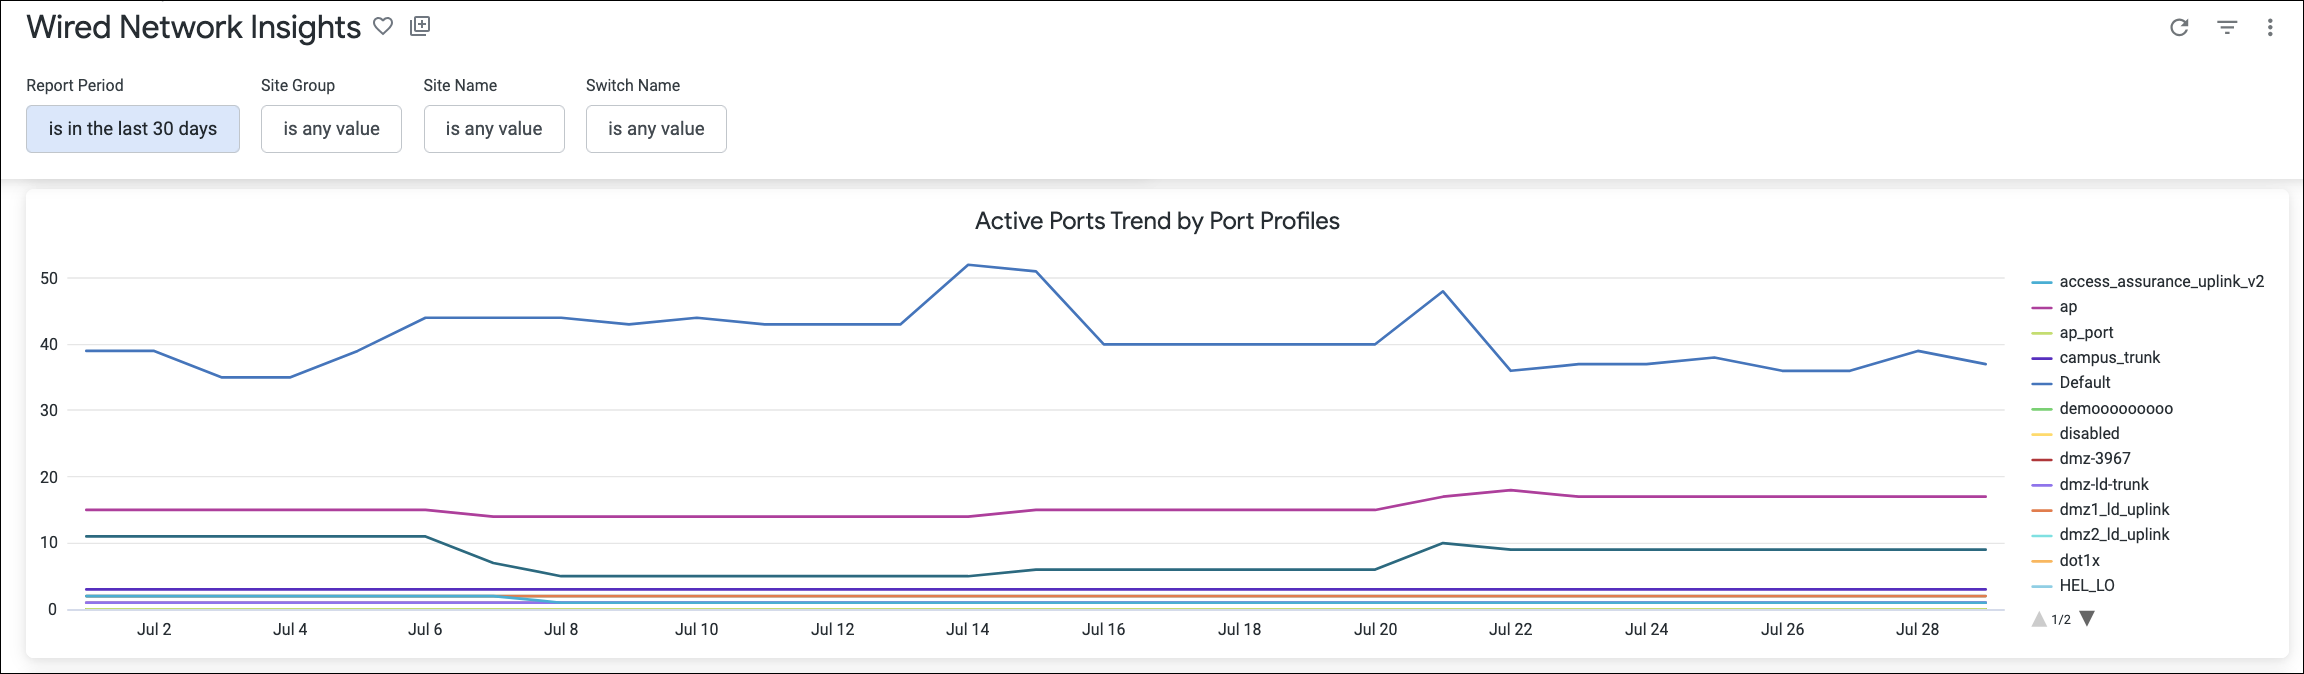
Active Ports Trend by Port Profile
This tile shows the utilization trend for active ports associated with port profiles.