Access Assurance Insights
View NAC events, client connections, authentication trends, and failures.
Juniper Mist Access Assurance is an advanced, cloud-based network access control (NAC) service that secures your wireless and wired network by providing identity-based network access to devices and users. With Juniper Mist Premium Analytics Access Assurance, you gain access to detailed insights regarding clients, authentication statistics, trends, and failure events.
Features
- Captures all NAC events, including connection and authentication successes and failures, NAC event types allowing easy problem identification and root cause analysis.
Before You Begin
-
See Juniper Mist Access Assurance Guide for the Access Assurance service details.
-
See Mist Premium Analytics Trial License to know about license requirements for the Juniper Mist Premium Analytics dashboard.
- Become familiar with the options available on the Juniper Mist Premium Analytics dashboard. See Figure 3.
Access Assurance Dashboard
Access Assurance Analytics Tiles
This tile displays analytics about the authenticated clients details. You can use the dashboard to get an overview of the clients types, clients connected to each site, and infrastructure vendor.
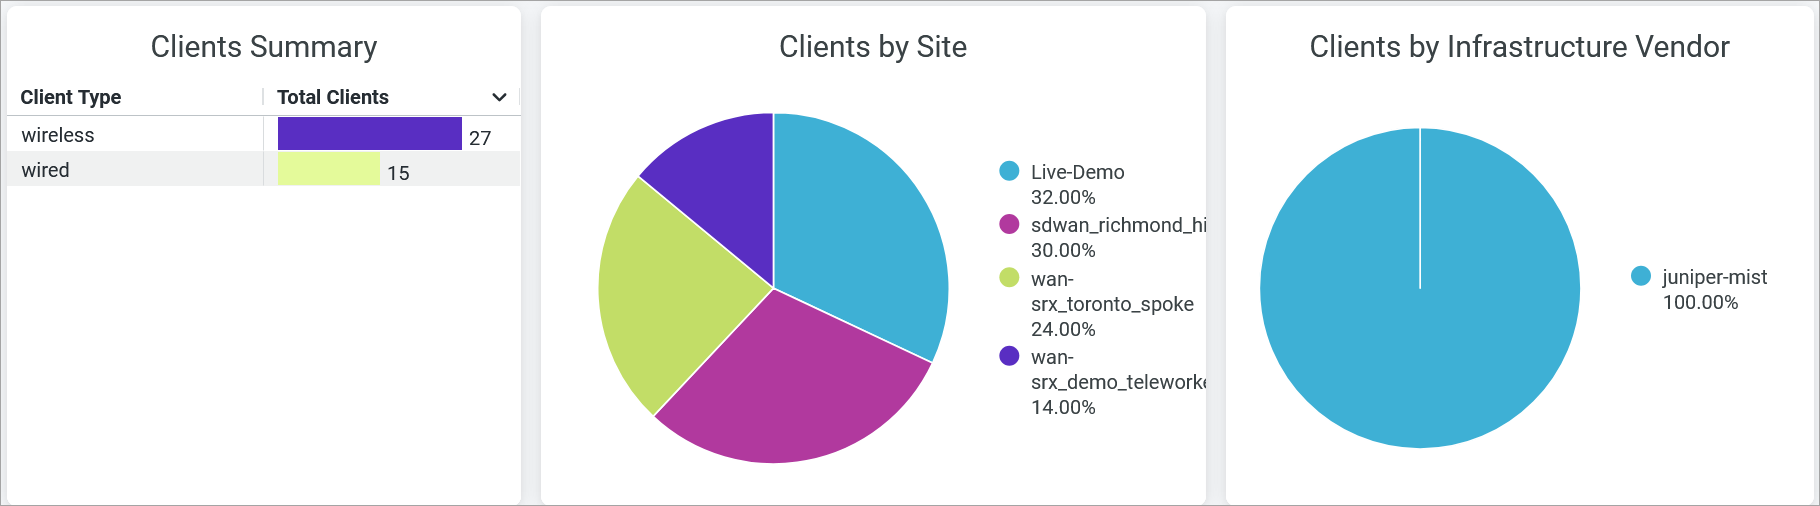
The dashboard provides the following details:
- Client Summary—Displays total count of wired and wireless clients in the organization.
- Client By Site—Displays percentage of clients by each site. In this chart, you
can
- Click a site in the chart, you'll see the client details such as client MAC address, User Name, and NAC event associated with the client.
- Click Download to download the table or the graph.
- View the percentage of clients by site in the chart legend. To hide a site from the chart and see only the remaining categories, click the site name in the legend.
- Hover over the chart to see the number of unique clients in each site.
- Clients by Infrastructure Vendor—Displays the percentage of clients by Juniper infrastructure or The third-party infrastructure.
- Authentication Trend
- Failure Events by Client Count
- Top Failures
- Top Access Points Failures and Top Switches Failures
- Event List
Authentication Trend
This tile displays analytics about the authentication trends over a period of time.
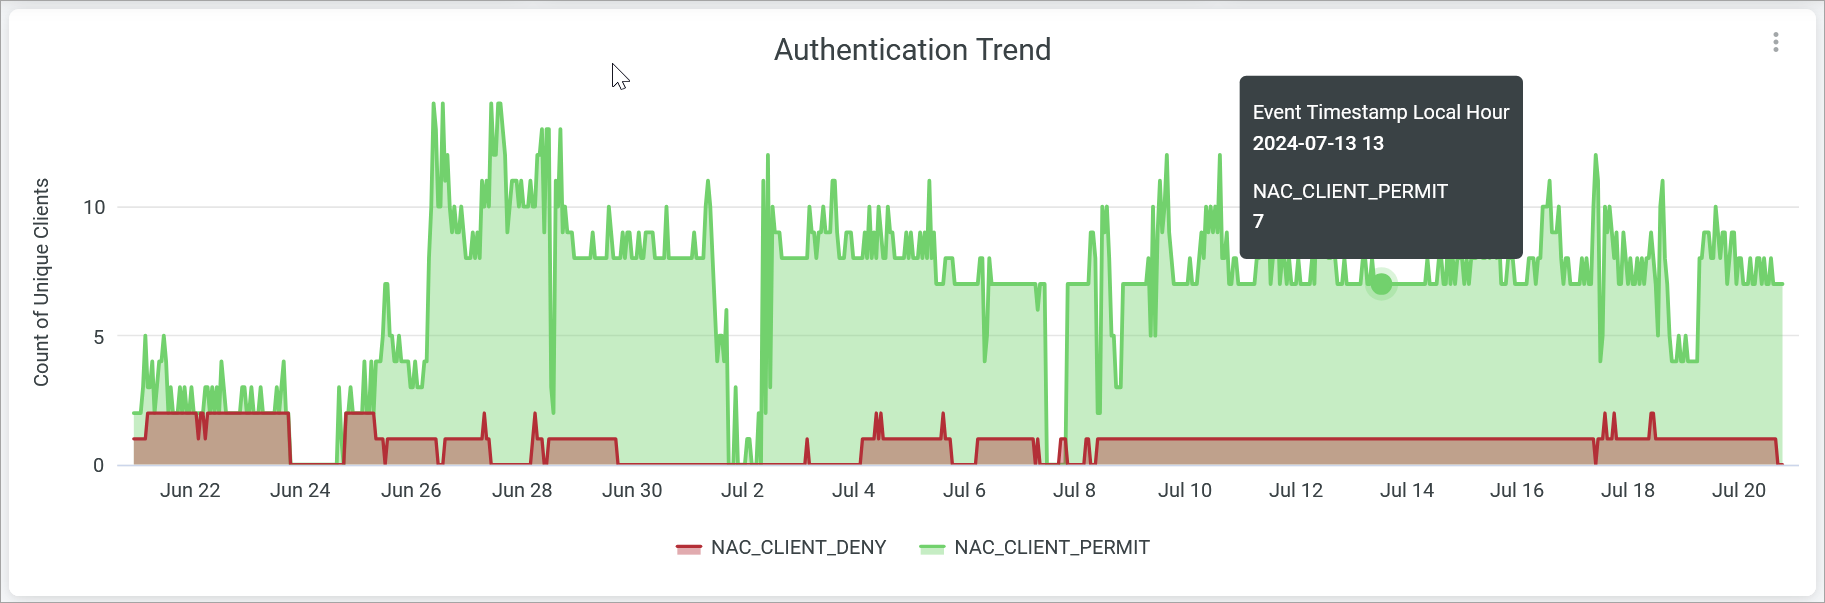
Hover over the chart to see the number of clients permitted or denied at a given time. To hide the particular category from the chart and see only the remaining categories, click the category name in the legend below the chart.
Failure Events by Client Count
Events page displays a log of a specific site's events for the selected tie period.
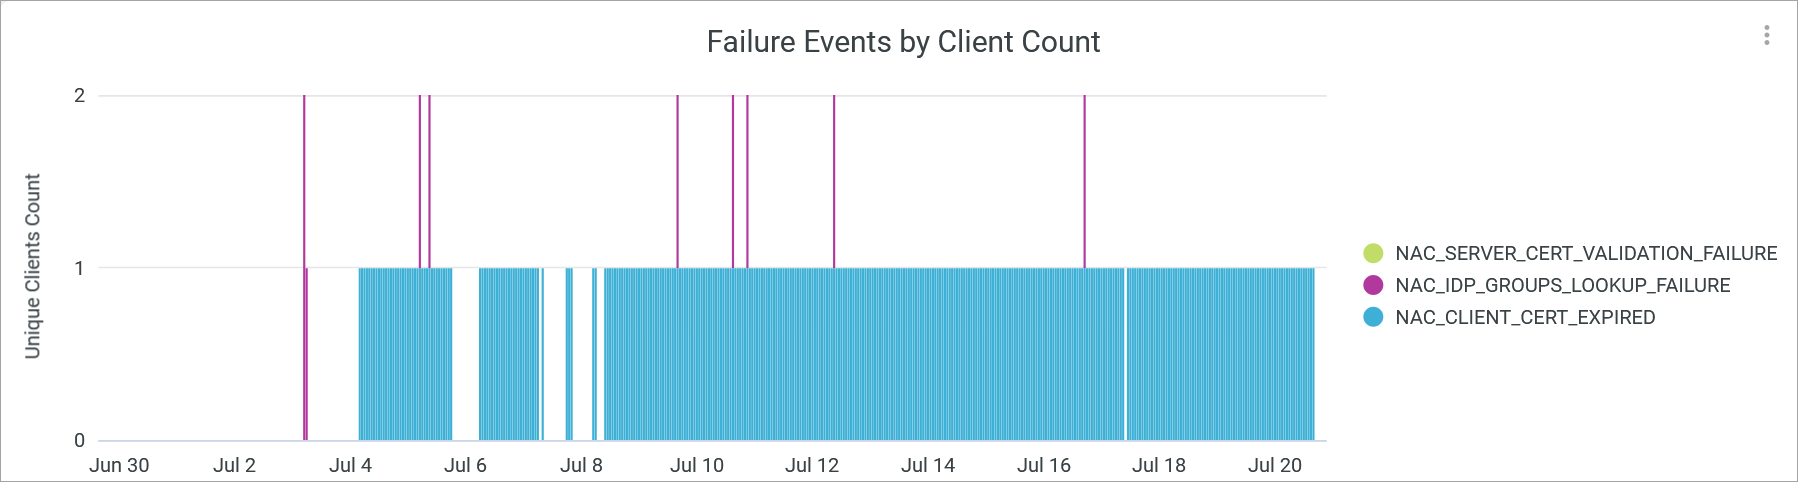
The tile displays the number of clients that are failed to authenticate due to reasons such as certificate validation, group lookup failure, client certification expiry.
Hover over the chart to see the number of clients failed to authenticate at a given time. To hide the particular category from the chart and see only the remaining categories, click the category name in the legend below the chart.
Top Failures
The tiles display top failure types and top clients with number of failure events.
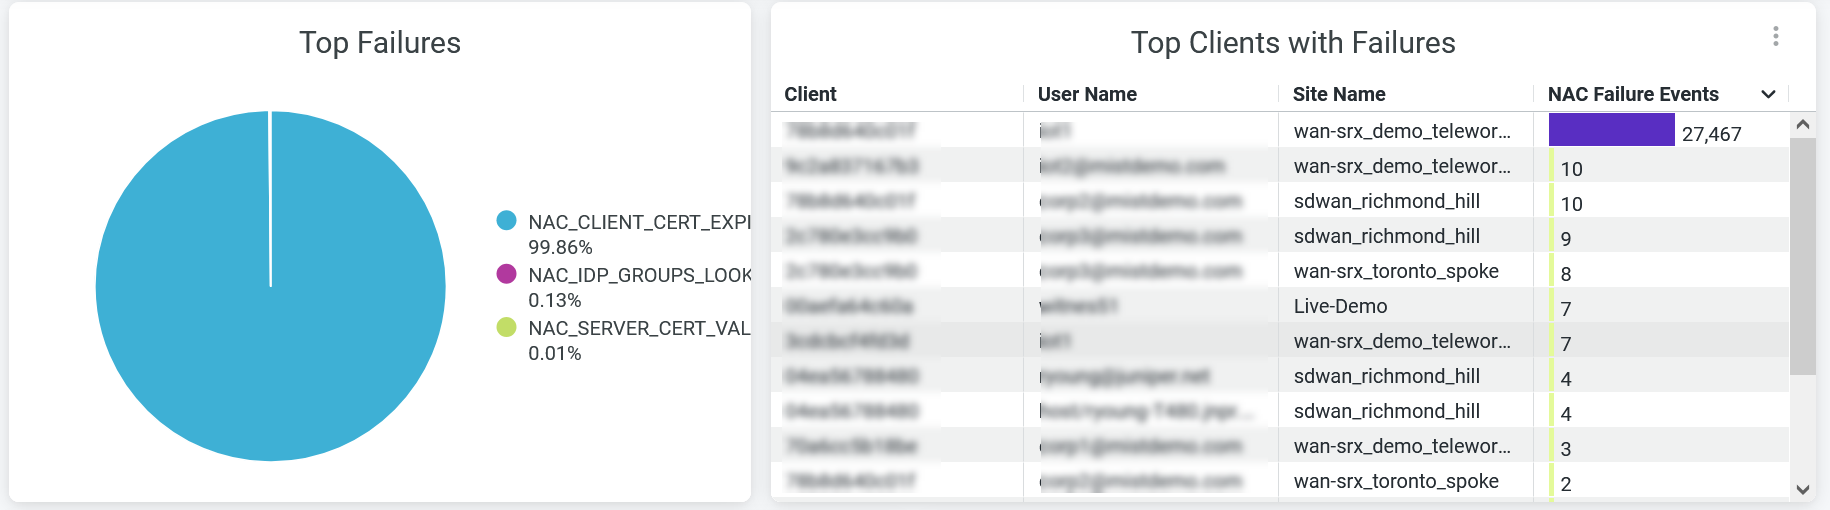
Top Failure
The tile displays the percentage distribution of NAC failure categories such as certificate validation fail, group lookup failure, client certification expiry.
Hover over the chart to see the number of clients failed to authenticate at a given time at each category. To hide the particular category from the chart and see only the remaining categories, click the category name in the legend below the chart.
Top Clients with Failure
The tile displays the details of the clients with number of NAC failure events. You can see the following details in the table:
-
Client—MAC address of the client.
-
User Name—User name of the client.
-
Site—Name of the site from where the client is attempted authentication.
-
NAC Failure Events—Total count of NAC failure events associated with the client. Click on the count, you'll see a new page with details such as client MAC address, user name, and NAC event type, and counts of each event types.
Top Access Points Failures and Top Switches Failures
The tiles display top access points and switches with NAC failure events.
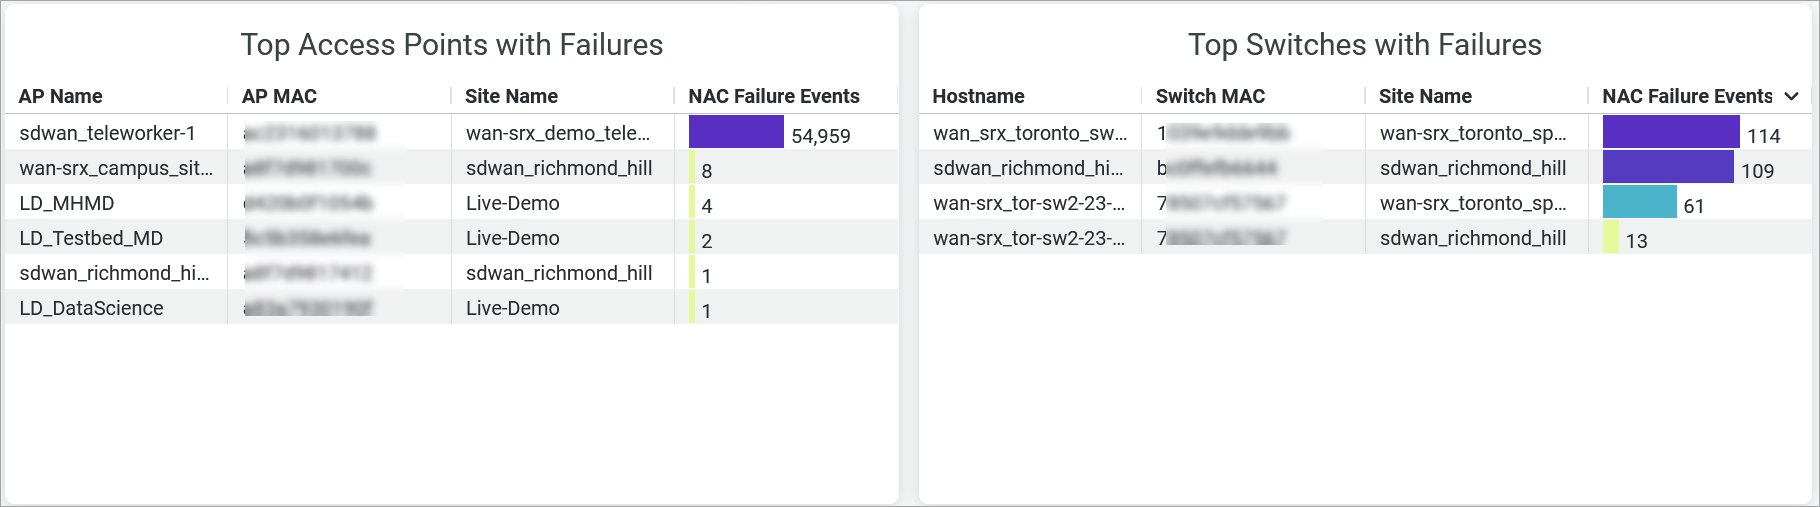
Top Access Points with Failures
The tile displays the details of top APs that have failure events. You can see the following details:
-
AP MAC—MAC address of the AP.
-
AP Name—Name of the AP.
-
Site—Name of the site where the AP is connected.
-
NAC Failure Events—Total count of NAC failure events associated with the AP. Click on the count value to display details such as client MAC address, user name, and NAC event type, and counts of each event types in a new page.
Top Switches with Failures
The tile displays the details of top switches that have failure events. You can see the following details:
-
Switch MAC—MAC address of the switch.
-
Host Name—Name of the switch.
-
Site—Name of the site where the switch is connected.
-
NAC Failure Events—Total count of NAC failure events associated with the switch. Click the count value to display details such as client MAC address, username, and NAC event type, and counts of each event types in a new page.
Event List
The Events List tile provides a high level view of the NAC events that occurred over a specific time period within your organization.
You can use the Event Type filter available at the top of the dashboard to display the details.
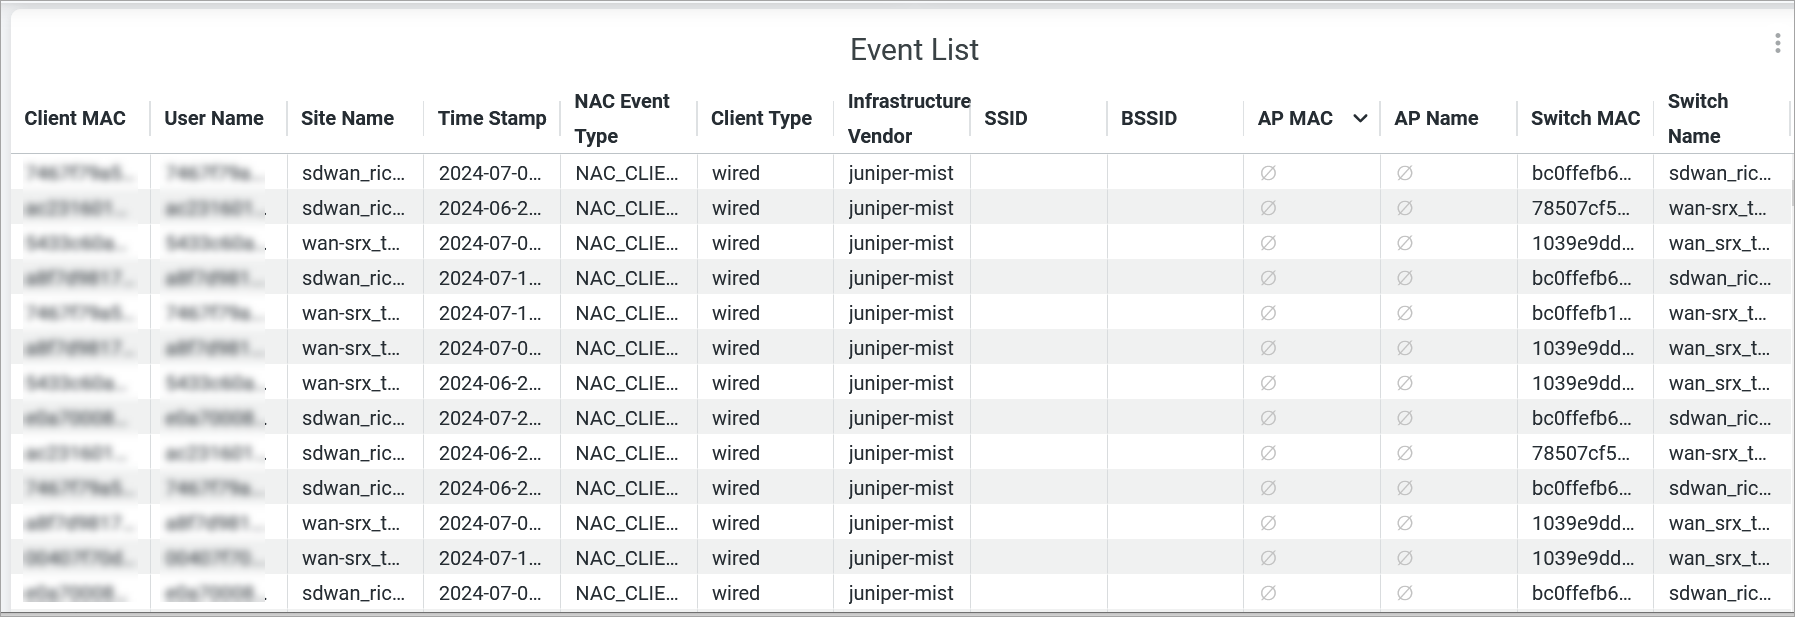
You can view the following details:
- Client MAC—MAC address of a client device.
- User Name—User name associated with the client device.
- Site Name—Name of the site where the client device is connected.
- Time stamp—Date and time when the NAC event occurred.
- NAC Event Type—Type of NAC event.
- Client Type—Type of client: wired or wireless.
- Infrastructure Vendor—Infra vendor whether Juniper infrastructure or The third-party infrastructure.
- SSID—SSID to which a client device is connected.
- BSSID—BSSID to which a client device is connected.
- AP MAC—MAC address of the AP.
- AP Name—Name of the AP.
- Switch MAC—MAC address of the switch.
- Host Name—Name of the switch.