ON THIS PAGE
Interactive Map Features Overview
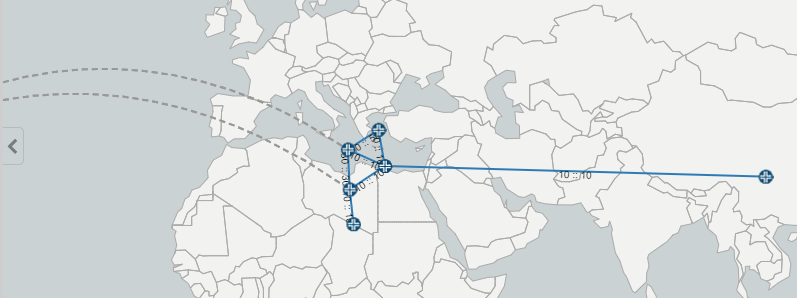
A topology map is interactive, which means you can use the features within the map to customize the map and the network information table. The map uses a geographic coordinate reference system that enables the following features:
-
Constrained zooming: The controller checks the coordinates so that the view is constrained to the coordinates on the earth.
-
World wrapping/map wrapping: Scrolling the map in one direction is like spinning a globe. For example, this feature enables the representation of links across an ocean.
Right-click Functions
You can right-click a node, node group, link, or blank space on the topology map to access context-specific menus.
Table 1 describes the options that are displayed when you right-click any blank space on the topology map.
|
Option |
Description |
|||
|---|---|---|---|---|
|
Grouping You can view, group, or ungroup the nodes in a node group. |
||||
|
Nodes & Groups |
Displays the nodes and node groups in the topology. You can select a particular node group to be displayed on the topology map. |
|||
|
Auto Grouping |
Enables you to specify the criteria that are used to automatically group nodes. For more information, see Automatically Group Nodes. |
|||
|
Group Selected Nodes |
Groups the selected nodes. For more information, see Group Nodes. |
|||
|
Ungroup Selected Nodes |
Ungroups the nodes from the selected group. For more information, see Ungroup Nodes. |
|||
|
Ungroup All |
Ungroups the nodes in all groups. |
|||
| Group Selected Nodes/Links into Topology Group | Groups the nodes or links that are selected on the topology map into a topology group based on the slice ID that you specify. | |||
| Clear Topology Group from the Selected Nodes/Links | Removes the slice IDs from the nodes and links that are present within the selected topology group. | |||
|
Select All Nodes |
Selects all the nodes on the topology map. This option is a shortcut to using the Shift-left-click option to create a selection box around all nodes or individually shift-clicking on all nodes. |
|||
|
Show All Nodes and Links |
Restores the topology map so that it includes all the nodes and links in the network, as opposed to a filtered subset. |
|||
|
Save to Default Map Layout |
Saves the current layout as the default. Setting this option does not change the name of the default in the Manage Layouts page. |
|||
|
Layout |
||||
|
Manage Map View |
Save, load, or edit the current topology map. For more information, see Manage Map Layouts. |
|||
|
Distribute All Nodes |
Select multiple nodes on the topology map and redistribute them to improve visual clarity or for personal preference. Distributes all the nodes in the map, pushing elements away from each other and minimizing overlap. |
|||
|
Distribute Selected nodes |
Forces the selected elements away from each other and minimizes overlap. |
|||
|
Circle selected nodes |
Arranges the selected nodes in a roughly circular pattern, with the nodes and links separated adequately. |
|||
|
Straighten selected nodes |
Aligns the selected nodes in a linear pattern. |
|||
|
Reset by Coordinates |
Resets the map to display the nodes based on their configured coordinates (latitude and longitude). Note:
You can reset the distribution of the nodes on the topology map according to geographical coordinates if you have set the latitude and longitude values of the nodes. It can be useful to have the country map backdrop displayed when you use this distribution model. |
|||
|
Set Coordinates from Map |
Reconfigures the node coordinates based on the current location of the nodes on the map. |
|||
|
Import from |
Import a layout from a CSV or GeoJSON file. For more information, see https://geojson.org/. |
|||
|
Export to |
Export a layout to a CSV or GeoJSON file. |
|||
|
Node Label |
Select one of the following options to label the nodes on the topology map:
|
|||
|
Link Label |
Select one of the following options to label the links on the topology map:
|
|||
|
Favorites |
||||
|
Add Selected Nodes to Favorites |
Select nodes on the topology map and designate them as favorites. |
|||
|
Remove Selected Nodes from Favorites |
Removes the nodes that you select on the topology map from the Favorites tab. |
|||
|
Clear Favorites |
Clears all the existing favorite nodes. |
|||
|
Highlight Favorites |
Highlights only the favorite nodes on the topology map. |
|||
|
Show only Favorites |
Displays only the favorite nodes on the topology map. |
|||
|
Hide Favorites |
Hides all the favorite nodes on the topology map. |
|||
|
Subview |
Filters the network elements on the topology map based on Node Type, Autonomous System (AS) number, OSPF Area, ISIS Area, Layer, or Admin Group. For more information about these options, see Table 2. |
|||
|
Timeline |
Lists activities and status checkpoints, with the most recent activity first. You can use the search box at the top of the Timeline drawer to highlight specific events. You can use the up and down arrows to move to the next or previous event (search result). You can click the top arrow (at the bottom-right corner of the drawer) to move back to the topmost event in the timeline. You can also refresh the timeline events by clicking the refresh button at the bottom-left corner of the page. You can assess the stability of the MPLS network by tracking changes in the number of LSP Up and Down events over time. You can then analyze whether the occurrence of specific other events affects the number of LSP Up and Down events. The following event types are included in the Timeline: Event types related to nodes:
Event types related to links:
Event types related to LSPs:
Even types related to Controller:
|
|||
|
Pause/Resume Network Event Processing |
Click to pause or resume the processing of network events. When paused, the network information table and topology map are not refreshed in response to network events until you select Resume Network Event Processing. Network events continue to be processed in the background, but they are not refreshed in the UI. This option is beneficial in large networks where the processing of network events results in frequent UI updates. |
|||
|
Reload Network |
Reloads the network, and updates the displayed topology map. |
|||
|
Options |
Description |
|---|---|
|
Node Type |
Select the node types from the list. |
|
AS |
Assign a color to represent each AS number that is configured on the topology map. From the AS pane, you can select or clear AS numbers by selecting or clearing the corresponding check boxes. Only nodes corresponding to the selected AS numbers are displayed in the topology map. |
|
ISIS Area |
Assign a color to represent each IS-IS area identifier that is configured on the topology map. The area identifier is the first three bytes of the ISO network entity title (NET) address. From the ISIS area pane, you can select or clear ISIS area identifiers by selecting or clearing the corresponding check boxes. Only nodes corresponding to the selected area identifiers are displayed in the topology map. |
|
OSPF Area |
Assign a color to represent each OSPF area that is configured on the topology map. NONE shows the color assigned to routers that have no OSPF area configured. From the OSPF Areas pane, select or clear OSPF areas by selecting or clearing the corresponding check boxes. Only nodes corresponding to the selected OSPF areas are displayed in the topology map. |
|
Layer |
Include or exclude individual layer information in the topology map. From the Layers list, select the layers (IP, Transport, or both) that you want to display. If you are not using the Multilayer feature, the Layers list contains only IP. |
|
Admin Group |
Provides bit-level link coloring options so that you can easily differentiate the different links that are displayed in the topology map. The Admin Group includes manually assigned bit-level attributes that describe the color of the links (up to 32 names or values from bit 0 to bit 32). You can filter by three conditions (all, any, or not). Links with the same color conceptually belong to the same class. You can use this option to implement a variety of policy-based label-switched path (LSP) setups. For more information, see Assign Names to Admin Group Bits. |
Table 3 describes the right-click options for a node or node group that you select on the topology map.
|
Option |
Description |
|---|---|
|
Filter in Node Table |
Filters the nodes that are displayed in the network information table to display the selected nodes or node groups only. |
|
Tunnels On or Thru Node |
Opens a new tab in the network information table to show only those tunnels that meet the On or Thru Node criteria. |
|
Tunnels Starting at Node |
Opens a new tab in the network information table to show only those tunnels that meet the Starting at Node criteria. |
|
Tunnels Ending at Node |
Opens a new tab in the network information table to show only those tunnels that meet the Ending at Node criteria. |
For the description of other right-click options, see Table 1.
Table 4 describes the right-click options for a link on the topology map.
|
Option |
Function |
|---|---|
|
Filter in Link Table |
Filters the tunnels that are displayed in the network information table to display only the selected link. |
|
Tunnels On or Thru Link |
Opens a new tab in the network information table to show only those tunnels that meet the On or Thru Link criteria. |
For the description of other right-click options, see Table 1.
Topology Settings Pane
You can access the Topology Settings pane by clicking the Settings icon in the Topology menu bar that is located at the upper right corner of the Topology Page.
Table 5 describes the tabs on the Topology Settings pane.
|
Tab |
Description |
|---|---|
|
Nodes |
You can perform the following tasks:
|
|
Links |
You can perform the following tasks:
Note:
The topology map does not display more than a certain number of node or link labels, even if the topology settings call for labels to be displayed. This constraint improves performance when redrawing a large number of graphic elements. |
|
Tunnels |
You can perform the following tasks:
|
|
General |
You can perform the following tasks:
|
|
Map |
You can perform the following tasks:
|