- play_arrow Introduction
- play_arrow Overview
- play_arrow Access the Paragon Automation GUI
- play_arrow Access the Paragon Planner
- play_arrow Configure SMTP, LDAP, and Portal Settings
- play_arrow Manage Users
- play_arrow Manage Roles
- play_arrow Manage User Groups
- play_arrow Identity Providers
-
- play_arrow Workflows
- play_arrow Base Platform
- play_arrow Paragon Pathfinder
- play_arrow Paragon Planner
- play_arrow Paragon Insights
-
- play_arrow Manage Devices and Network
- play_arrow Devices
- play_arrow Device Groups
- play_arrow Device Images
- play_arrow Network
- play_arrow Network Groups
- play_arrow Topology Filter
-
- play_arrow Manage Device Templates and Configuration Templates
- play_arrow Configuration Templates
- Configuration Templates Overview
- Configuration Templates Workflow
- About the Configuration Templates Page
- Add Configuration Templates
- Preview and Render a Configuration Template
- Assign Configuration Templates to a Device Template
- Deploy a Configuration Template to a Device
- Edit, Clone, and Delete a Configuration Template
- play_arrow Device Templates
-
- play_arrow Manage Playbook, Rules, Resources, and Graphs
- play_arrow Playbooks
- play_arrow Rules
- Understand Paragon Insights Topics
- Rules Overview
- About the Rules Page
- Add a Predefined Rule
- Edit, Clone, Delete, and Download Rules
- Configure a Custom Rule in Paragon Automation GUI
- Configure Paragon Insights Notification for LSP Gray Failures
- Configure Multiple Sensors per Device
- Understand Sensor Precedence
- Configure Sensor Precedence
- play_arrow Resources
- Understand Root Cause Analysis
- About the Resources Page
- Add Resources for Root Cause Analysis
- Configure Dependency Between Resources
- Example Configuration: OSPF Resource Dependency
- Edit Resources and Dependencies
- Upload Resources
- Download Resources
- Clone Resources
- Delete User-Generated Resources and Dependencies
- Filter Resources
- play_arrow Graphs
- play_arrow Grafana
-
- play_arrow Manage Sensor Settings, Insights Settings, and Data Summarization Profiles
- play_arrow Sensor Settings
- Sensors Overview
- About the Ingest Settings Page
- Configure NetFlow Settings
- Configure a Rule Using Flow Sensor
- About the Frequency Profiles
- Manage Frequency Profiles
- Apply a Frequency Profile
- Configure Offset Time
- Configure a Rule Using Server Monitoring Sensor
- Configure Native GPB Ingest
- Configure sFlow Settings
- Configure SNMP Ingest
- Configure a Rule Using SNMP Scalar
- Configure SNMP Trap and Inform Notifications
- Configure Outbound SSH Port for iAgent
- Configure System Log Ingest
- System Log Optional Configurations
- Configure a Rule Using Syslog
- Understand Inband Flow Analyzer 2.0
- Configure Device Details for Inband Flow Analyzer Devices
- Delete an Inband Flow Analyzer Device
- Understand Bring Your Own Ingest
- Load BYOI Default Plug-ins
- Configure Bring Your Own Ingest Default Plug-in Instances
- Build and Load BYOI Custom Plug-in Images
- Configure Bring Your Own Ingest Custom Plug-in Instances
- Use Sample Rule and Playbook Configurations for BYOI Custom Plug-in Instances
- Configure Ingest Mapping for Default BYOI Plug-in Instances
- Delete a BYOI Plug-in
- About the Diagnostics Page
- Use the Self Test Tool
- Use the Reachability Test
- Use the Ingest Test Tool
- Use the No-Data Tool
- Paragon Insights Tagging Overview
- Types of Tagging
- Add a Tagging Profile
- Apply a Tagging Profile
- Delete a Tagging Profile
- Understand User-Defined Actions and Functions
- Modify User-Defined Action, Function, and Workflow Engines
- Enable UDA Scheduler in Trigger Action
- Understand kube-state-metrics Service
- play_arrow Insights Settings
- About the Insights Settings Page
- Add Alert Blackouts
- About Alert Notifications
- Use Exim4 for E-mails
- Configure the Exim4 Agent to Send E-mail
- Configure a Notification Profile
- Enable Alert Notifications for Device Groups and Network Groups
- Configure Report Settings
- Configure Scheduler Settings
- Configure a Retention Policy
- Configure Destination Settings
- Time Series Database (TSDB) Overview
- Manage Time Series Database Settings
- Backup and Restore the TSDB
- Time Series Database Replication Scenarios
- play_arrow Data Summarization Profiles
-
- play_arrow Monitoring
- play_arrow Monitor Network Health
- play_arrow Manage Alarms and Alerts
- play_arrow Monitor Jobs
- play_arrow Analytics
- play_arrow Monitor Workflows
-
- play_arrow Reports
- play_arrow Health Reports
- play_arrow Network Reports
- play_arrow Maintenance Reports
- play_arrow Inventory Reports
- play_arrow Demand Reports
-
- play_arrow Administration
- play_arrow Manage E-mail Templates
- play_arrow Manage Audit Logs
- play_arrow Configure External EMS
- play_arrow Manage Task Scheduler
- play_arrow Manage Security Settings
- play_arrow License Management
-
About the Topology Page
The Topology (Network > Topology) page is the main work area for the live network you load into the system. You can configure various network elements in your topology such as nodes, links, and tunnels from the network information table.
Figure 1 shows the all the components on the Topology page.

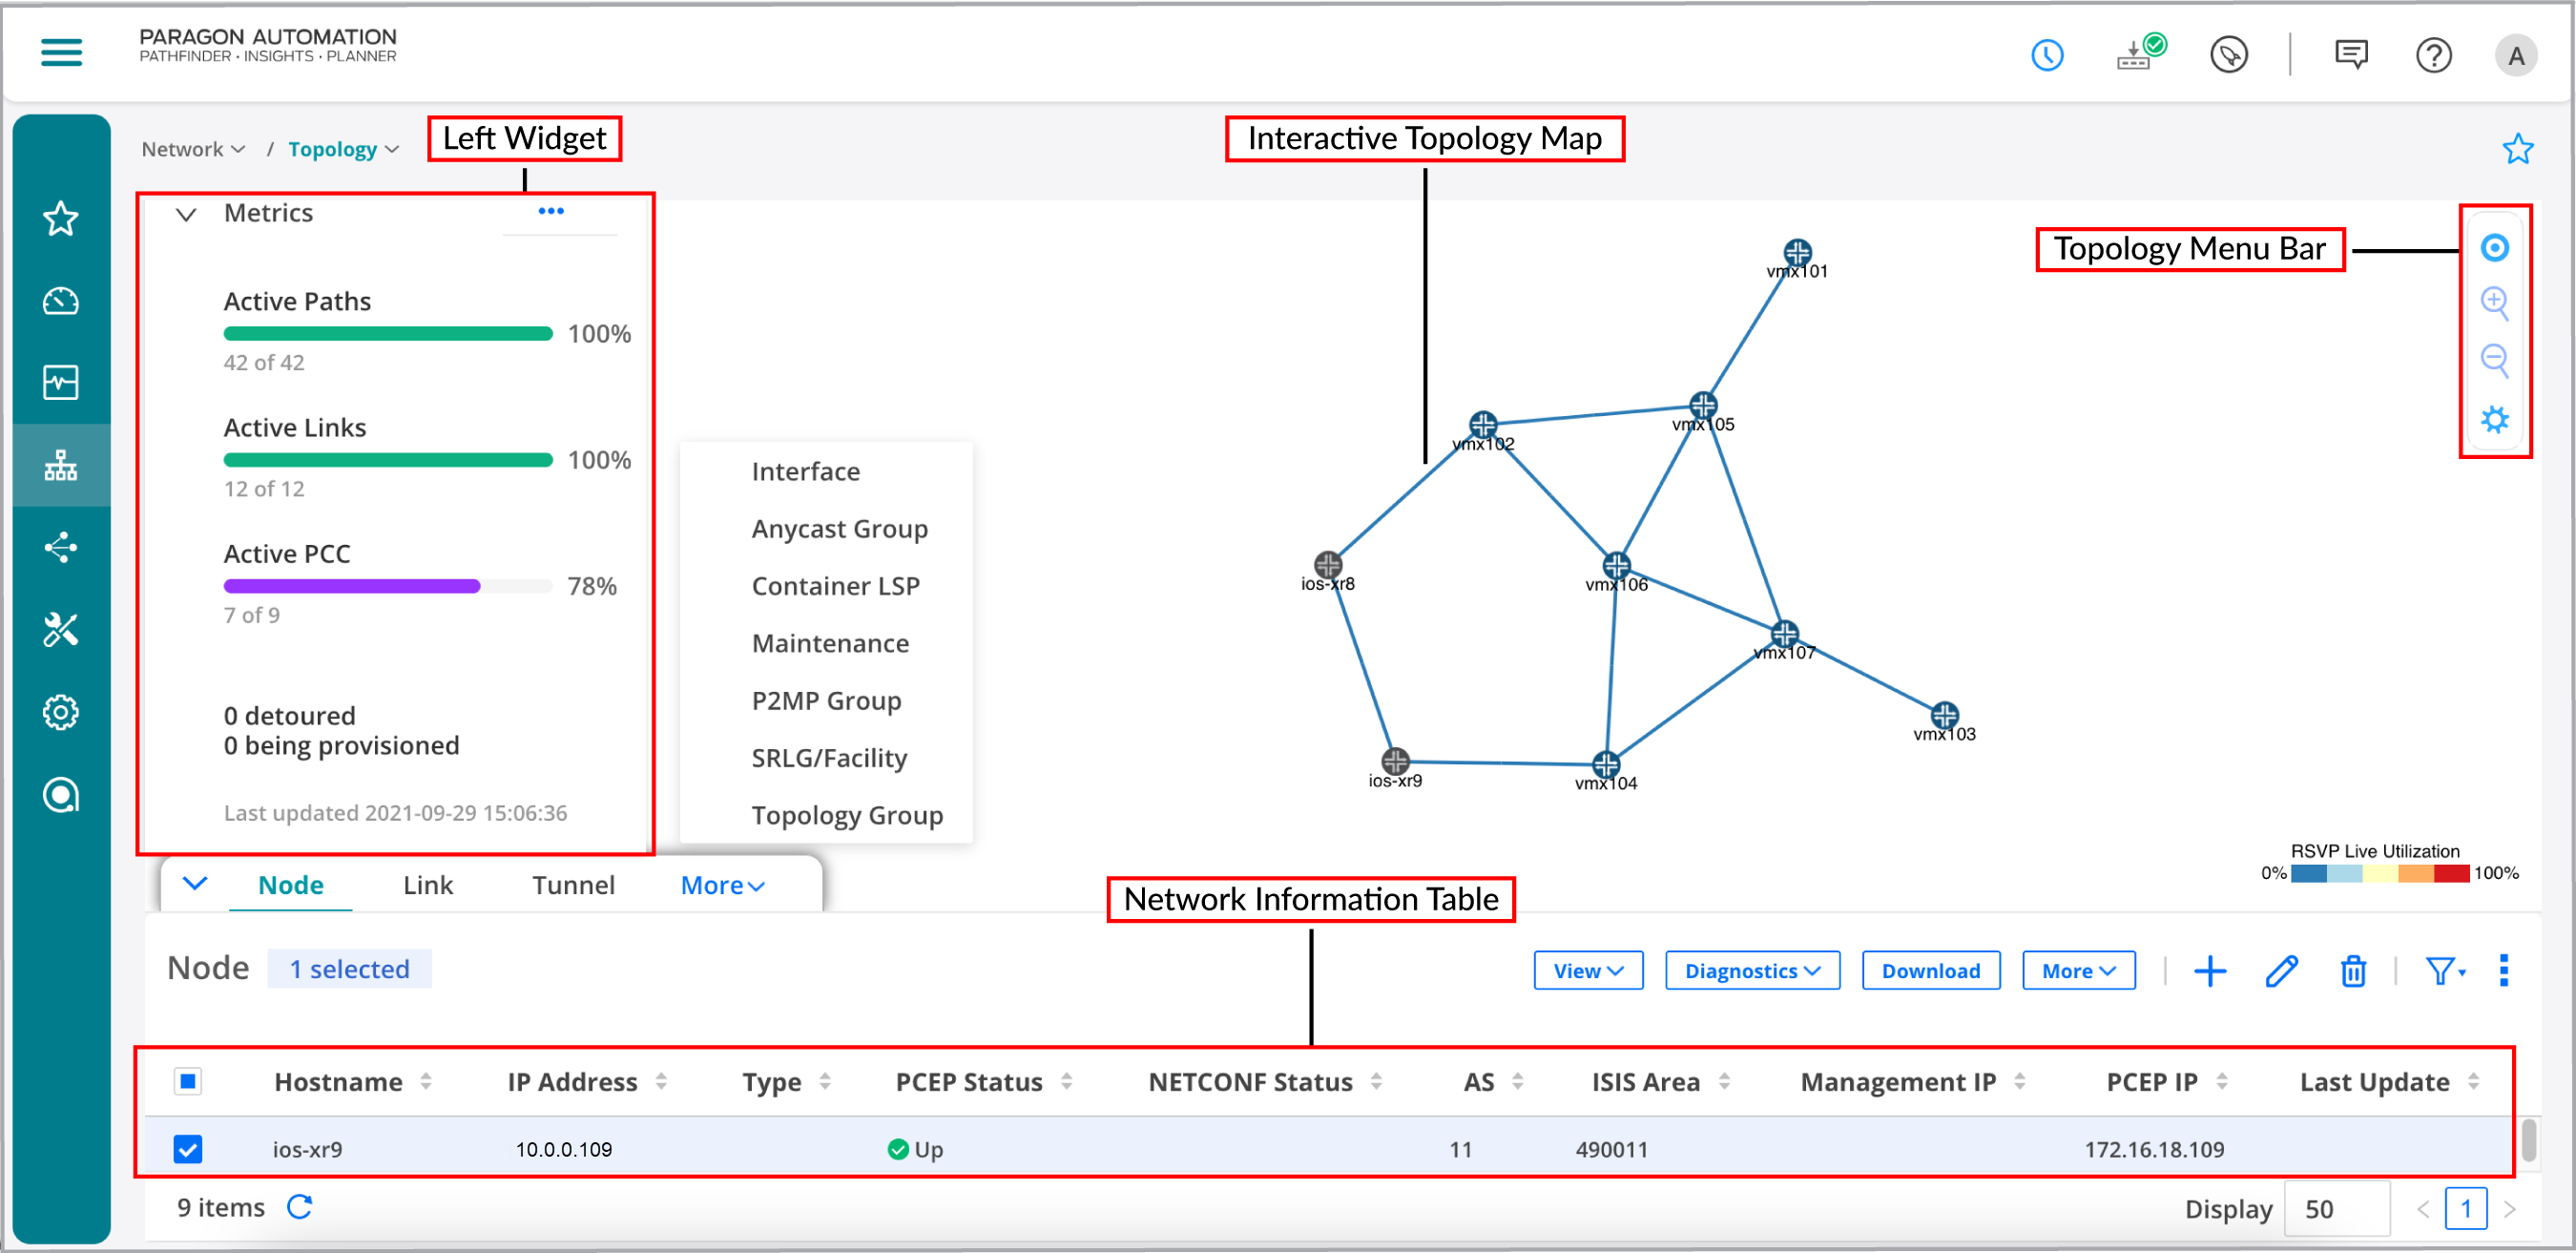
The Topology page consists of the following:
Left Widget— Movable list of network metrics and performance data. You can hover over the More Options (horizontal ellipsis) icon to display network metrics or performance submenu. Your selections are reflected in the topology map where applicable. You can expand or collapse the left widget by clicking the arrow icon. You can drag-and-drop this widget to position it anywhere on the screen. For more information, see Left Widget Options on Topology Page.
Interactive Topology Map—Use the topology map to access network element information and further customize the map display. You can click the legend on the bottom right corner to configure the color to be displayed for specific network elements like links. On the Legend Settings pane, you can click on the color to customize it and move the sliders to customize the colors for specific link utilization (%) intervals. For more information, see Interactive Map Features Overview.
Note:Topology map is refreshed whenever there are network events such as link down or up, or new node discovery. To reload the topology map, click the Refresh icon at the bottom left corner of the network information table.
Network Information Table— Displays detailed information about network nodes, links, tunnels, interfaces, anycast groups, container LSPs, maintenance events, P2MP groups,, SRLG/Facility, and topology groups within different tabs. For more information, see Network Information Table Overview.
Note:Click the collapsible arrow icon at the bottom-left of the Topology page to show or hide the network information table.
Topology Menu Bar—A vertical bar at the top-right corner of the Topology page, which consists of the following:
Target icon—Center the topology map in the window.
Plus icon—Zoom in (enlarge) the topology map.
Minus icon—Zoom out (reduce) the topology map.
Settings icon—Access the topology settings window. For more information, Topology Settings Pane.
Navigation on the Topology Page
Table 1 describes the Topology page navigation functions.
Function | Method |
---|---|
Drag and drop | Select an element, drag to the required position on the screen, and then release. |
Select an element | Click a link or node to select it. |
Select multiple elements | Do one of the following:
|
Zoom in and out ![]() | Do one of the following:
|
Zoom to fit ![]() | Click the target icon on the Topology Menu Bar to resize and center the topology map to fit the visible area of the Topology page. |
Right-click to access functions | Right-click the blank part of the topology map or on a map element to access context menus. |
Hover | Hover over a network element in the topology map to display the element name or ID. |
Collapse/expand pane ![]() | When a left, right, up, or down slider appears at the margin of a pane, you can click it to collapse or expand the pane. |
Pin ![]() | Click the pin icon on the top right of the page or widget to fix it at any place on the screen. |
Resize panes | Click and drag any of the pane margins to resize the panes in a display. |