- play_arrow Introduction
- play_arrow Overview
- About the Paragon Automation (Pathfinder, Planner, Insights) User Guide
- Paragon Automation Overview
- Paragon Pathfinder Overview
- Paragon Insights Overview
- Paragon Planner Overview
- Understand Differences between Paragon Pathfinder and Planner
- Paragon Automation GUI Overview
- Paragon Automation GUI Menu Overview
- play_arrow Access the Paragon Automation GUI
- play_arrow Access the Paragon Planner
- play_arrow Configure SMTP, LDAP, and Portal Settings
- play_arrow Manage Users
- play_arrow Manage Roles
- play_arrow Manage User Groups
- play_arrow Identity Providers
-
- play_arrow Workflows
- play_arrow Base Platform
- play_arrow Paragon Pathfinder
- play_arrow Paragon Planner
- play_arrow Paragon Insights
-
- play_arrow Manage Devices and Network
- play_arrow Devices
- play_arrow Device Groups
- play_arrow Device Images
- play_arrow Network
- play_arrow Network Groups
- play_arrow Topology Filter
-
- play_arrow Manage Device Templates and Configuration Templates
- play_arrow Configuration Templates
- Configuration Templates Overview
- Configuration Templates Workflow
- About the Configuration Templates Page
- Add Configuration Templates
- Preview and Render a Configuration Template
- Assign Configuration Templates to a Device Template
- Deploy a Configuration Template to a Device
- Edit, Clone, and Delete a Configuration Template
- play_arrow Device Templates
-
- play_arrow Manage Sensor Settings, Insights Settings, and Data Summarization Profiles
- play_arrow Sensor Settings
- Sensors Overview
- About the Ingest Settings Page
- Configure NetFlow Settings
- Configure a Rule Using Flow Sensor
- About the Frequency Profiles
- Manage Frequency Profiles
- Apply a Frequency Profile
- Configure Offset Time
- Configure a Rule Using Server Monitoring Sensor
- Configure Native GPB Ingest
- Configure sFlow Settings
- Configure SNMP Ingest
- Configure a Rule Using SNMP Scalar
- Configure SNMP Trap and Inform Notifications
- Configure Outbound SSH Port for iAgent
- Configure System Log Ingest
- System Log Optional Configurations
- Configure a Rule Using Syslog
- Understand Inband Flow Analyzer 2.0
- Configure Device Details for Inband Flow Analyzer Devices
- Delete an Inband Flow Analyzer Device
- Understand Bring Your Own Ingest
- Load BYOI Default Plug-ins
- Configure Bring Your Own Ingest Default Plug-in Instances
- Build and Load BYOI Custom Plug-in Images
- Configure Bring Your Own Ingest Custom Plug-in Instances
- Use Sample Rule and Playbook Configurations for BYOI Custom Plug-in Instances
- Configure Ingest Mapping for Default BYOI Plug-in Instances
- Delete a BYOI Plug-in
- About the Diagnostics Page
- Use the Self Test Tool
- Use the Reachability Test
- Use the Ingest Test Tool
- Use the No-Data Tool
- Paragon Insights Tagging Overview
- Types of Tagging
- Add a Tagging Profile
- Apply a Tagging Profile
- Delete a Tagging Profile
- Understand User-Defined Actions and Functions
- Modify User-Defined Action, Function, and Workflow Engines
- Enable UDA Scheduler in Trigger Action
- Understand kube-state-metrics Service
- play_arrow Insights Settings
- About the Insights Settings Page
- Add Alert Blackouts
- About Alert Notifications
- Use Exim4 for E-mails
- Configure the Exim4 Agent to Send E-mail
- Configure a Notification Profile
- Enable Alert Notifications for Device Groups and Network Groups
- Configure Report Settings
- Configure Scheduler Settings
- Configure a Retention Policy
- Configure Destination Settings
- Time Series Database (TSDB) Overview
- Manage Time Series Database Settings
- Backup and Restore the TSDB
- Time Series Database Replication Scenarios
- play_arrow Data Summarization Profiles
-
- play_arrow Configure Your Network
- play_arrow Topology
- play_arrow Network Information Table
- Network Information Table Overview
- About the Node Tab
- Add a Node
- Edit Node Parameters
- Delete a Node
- About the Link Tab
- Add a Link
- Edit Link Parameters
- Delete a Link
- About the Tunnel Tab
- Understand How Pathfinder Handles LSPs
- Reroute LSPs Overview
- Segment Routing Overview
- Add a Single Tunnel
- Add Diverse Tunnels
- Add Multiple Tunnels
- Edit and Delete Tunnels
- About the Demand Tab
- About the Interface Tab
- Container LSP Overview
- About the Container LSP Tab
- Add a Container LSP
- Edit Container LSP Parameters
- Maintenance Event Overview
- About the Maintenance Tab
- Add a Maintenance Event
- Edit a Maintenance Event
- Simulate a Maintenance Event
- Delete a Maintenance Event
- About the P2MP Groups Tab
- Add a P2MP Group
- Edit P2MP Group Parameters
- About the SRLG/Facility Tab
- Add an SRLG/Facility
- Edit SRLG/Facility Parameters
- About the Topology Group Tab
- Add Anycast Group Tunnels
- play_arrow Tunnels
- play_arrow Change Control Management
-
- play_arrow Monitoring
- play_arrow Monitor Network Health
- play_arrow Manage Alarms and Alerts
- play_arrow Monitor Jobs
- play_arrow Analytics
- play_arrow Monitor Workflows
-
- play_arrow Reports
- play_arrow Health Reports
- play_arrow Network Reports
- play_arrow Maintenance Reports
- play_arrow Inventory Reports
- play_arrow Demand Reports
-
- play_arrow Administration
- play_arrow Manage E-mail Templates
- play_arrow Manage Audit Logs
- play_arrow Configure External EMS
- play_arrow Manage Task Scheduler
- play_arrow Manage Security Settings
- play_arrow License Management
-
Understand Sensor Precedence
Paragon Insights allows you to add multiple sensors per rule that can be applied to all the devices in a device group. In earlier releases, you could add only one sensor per rule. Each sensor generates data in a field table. If you add the different sensors in multiple rules, it results in as many field tables as the number of rules. When you add multiple types of sensors (such as OpenConfig or Native GPB) in a single rule in Paragon Insights, data from the sensors is consolidated in a single field table that is simpler to export or to visualize. The GUI for multiple sensor will be implemented in subsequent releases.
The following scenarios illustrate use cases for multiple sensors in a rule:
In Paragon Pathfinder, there can be different native sensors that provide non-overlapping counter details for Segment Routing (SR) and Resource Reservation Protocol (RSVP) label switched paths (LSP). If the field table needs to be combined for the data collected from the LSPs, multiple sensors can be made active for a device in the same rule.
If you want to get data for ge interface using iAgent sensor and for fe interface using Native GPB sensor, then you could use multiple active sensor for a device. You need to ensure non-overlapping data in this case by using Field filtering expression to filter by the interface name. Instead of interfaces, an sp-admin or a user with create access privilege can consider any other key performance indicators too.
Paragon Insights also supports a feature that can be used with multiple sensors, called sensor precedence.
To make data collection from a sensor effective, devices in a device group must support a particular sensor as an ingest method. Select devices in a device group running an older version of operating system, devices from different vendors in a device group, or different products from the same vendor (such as EX, MX, and PTX routers from Juniper) are all scenarios that can cause challenges while applying a sensor to a device group. In such cases, you need to set a different sensor that is compatible with specific devices in a device group.
Paragon Insights enables you to set sensor precedence so that you can configure different sensors in each hierarchy of Rule Properties such as vendor name, operating system, product name, platform, and release version. This makes it possible to apply suitable sensors on multi-vendor devices in a heterogeneous device group. You can configure sensor precedence only through Paragon Insights CLI. The GUI for multiple sensor will be implemented in subsequent releases.
Figure 1 illustrates two rules each with multiple sensors. It is assumed that Rule Properties is configured for sensor precedence.

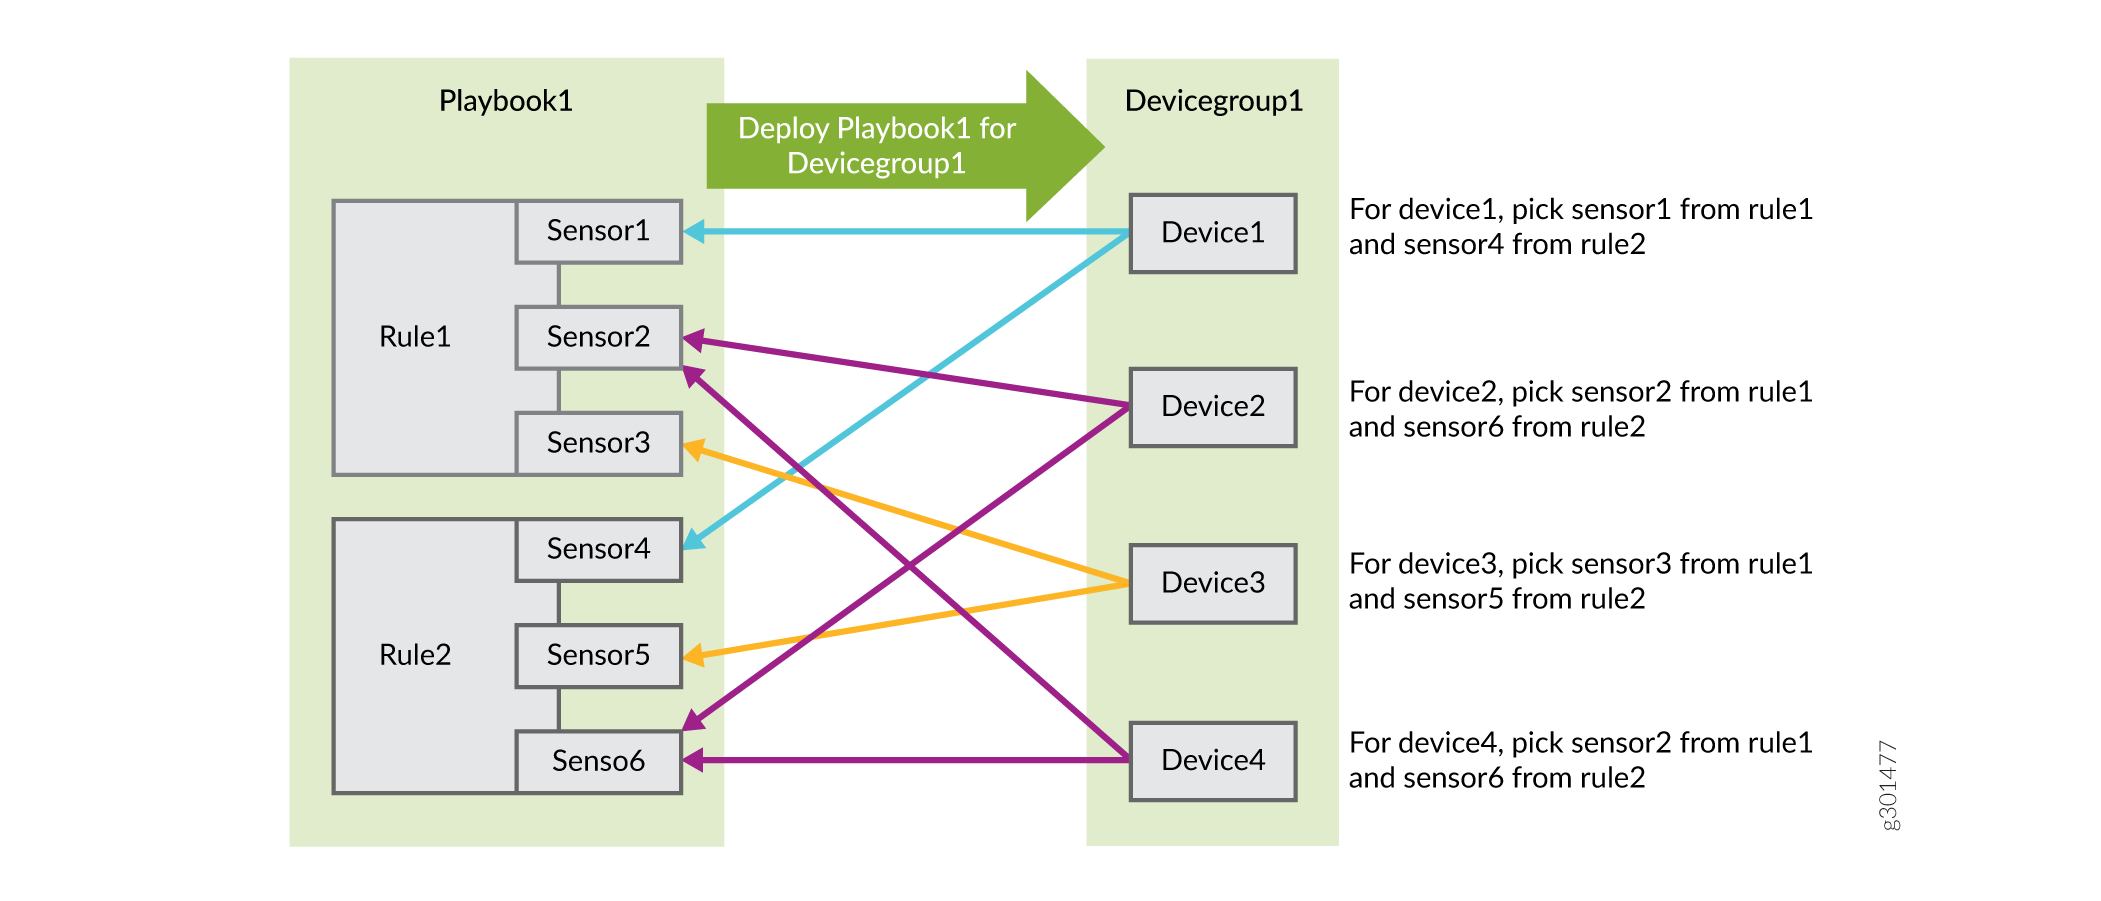
Let us suppose Sensor1 in Rule 1 is OpenConfig and Sensor4 in Rule 2 is iAgent and Device1 runs Junos operating system (OS). If OpenConfig and iAgent were set as default sensors for Junos OS hierarchy in Rule Properties then, Device1 would receive data from Sensor1 and Sensor4 when the Playbook is deployed for the device group.