Configure sFlow Settings
This section describes the configuration of sFlow ingest and configurations in device or device group configuration to stream sFlow packets in Paragon Automation.
Configure Devices to Send sFlow Packets
When you configure a device to send sFlow to a collector, you simply set a source IP address (IP address of the collector), sample-rate, polling interval, UDP port, and interface to capture from. There is no opportunity to filter or choose what data gets sent from the device side.
The IP address of collector is the virtual IP address of Paragon Insights services you set while installing Paragon Automation Platform.
The following is an example configuration snippet to configure an MX series router to send sFlow packets.
[edit protocols]
        set sflow collector 10.234.32.46 udp-port 5600

        set sflow interfaces ge-0/0/0
        set sflow polling interval 20
        set sflow sample-rate egress 1000
        set sflow interfaces ge-0/0/1 polling-interval 10 sample-rate ingress 1000
The following is an example configuration snippet to configure an EX series switch to send sFlow packets.
[edit protocols]
        set sflow collector 10.234.32.46 udp-port 5600

        set sflow interfaces ge-0/0/0
        set sflow polling interval 20
        set sflow sample-rate egress 1000
The following example shows the output from a switch already configured to send sFlow packets to a collector at IP address 10.204.32.46.
[edit protocols sflow]
		  user@switch# show
        polling-interval 20;
        sample-rate egress 1000;
        collector 10.204.32.46
        {
		   udp-port 5600;
        }
        interfaces ge-0/0/0.0;
Configure sFlow Ingest
As with other ingest methods, navigate to Configuration > Data Ingest > Settings and choose the sFlow tab.
The Sflow Settings are broken down into 4 sections:
-
Sample There are two pre-defined sample categories and each is represented in the sFlow header as an integer sample-type value. Table 1 below shows the sample types and their numeric value.
Table 1: sFlow Sample Types Sample Type
Integer Value in sFlow Header
counter-sample
2
expanded-counter-sample
4
flow-sample
1
expanded-flow-sample
3
Note:The difference between the expanded sensor types and the non-expanded sample types is the size of the data fields. The field names and types are the same, but the field sizes are larger in the expanded sample types.
Packet definitions for these sample types can be found here: sFlow Samples
Table 2 shows the other fields contained in an sFlow sample header (by sample type) along with the field type.
Table 2: sFlow Packet Header Fields field type/size in bits
counter-sample
flow-sample
integer/32
sampleSequenceNumber
sampleSequenceNumber
integer/8
sourceIDType
-
0 = SNMP interface index
-
1 = VLAN ID (smonVlanDataSource)
-
2 = Physical entity (entPhysicalEntry)
sourceIDType
-
0 = SNMP interface index
-
1 = VLAN ID (smonVlanDataSource)
-
2 = Physical entity (entPhysicalEntry)
integer/24
sourceIDValue
sourceIDValue
integer/32
n (the number of sampled records contained in the Counter sample)
sampleSamplingRate
integer/32
-
samplePool (number of packets that could have been sampled)
integer/32
-
sampleDroppedPackets (number of packets dropped due to lack of resources)
integer/8
-
sampleInputInterfaceFormat (input interface type)
integer/32
-
sampleInputInterfaceValue (input interface (SNMP interface index)
integer/1
sampleOutputInterfaceFormat (output interface type)
integer/33
-
sampleOutputInterfaceValue (SNMP interface index)
integer/32
-
n (the number of flow records)
data
counter records
flow records
-
-
Flow Record The Flow Record section provides the tools needed to define the different types of flow that might be seen in an sFlow capture. Paragon Automation ships with 16 types of pre-defined flow records, each of which have a format number and a sensor path for use in defining sFlow rules, shown in Table 3 below. There are several fields in each type of flow record. These can be seen by selecting the desired record type from the list and clicking the edit (pencil) button.
Table 3: Flow Record Types Record Type
Format Number
Sensor Path Value
raw packet headers
1
/sflow-v5/flow-sample/raw-packet-header
Ethernet frame data
2
/sflow-v5/flow-sample/ethernet-frame-data
IPv4 data
3
/sflow-v5/flow-sample/ipv4-data
IPv6 data
4
/sflow-v5/flow-sample/ipv6-data
extended switch data
1001
/sflow-v5/flow-sample/extended-switch-data
extended router data
1002
/sflow-v5/flow-sample/extended-router-data
extended gateway data
1003
/sflow-v5/flow-sample/extended-gateway-data
extended user data
1004
/sflow-v5/flow-sample/extended-user-data
extended URL data
1005
/sflow-v5/flow-sample/extended-url-data
extended MPLS data
1006
/sflow-v5/flow-sample/extended-mpls-data
extended NAT data
1007
sflow-v5/flow-sample/extended-nat-data
extended MPLS tunnel
1008
/sflow-v5/flow-sample/extended-mpls-tunnel
extended MPLS VC
1009
/sflow-v5/flow-sample/extended-mpls-vc
extended MPLS FEC
1010
/sflow-v5/flow-sample/extended-mpls-fec
extended LVP FEC
1011
/sflow-v5/flow-sample/extended-mpls-lvp-fec
extended VLAN tunnel
1012
/sflow-v5/flow-sample/extended-vlan-tunnel
When you configure rules for sFlow, you can choose from any of these record types. You can create new flow records by clicking the add (+) icon on the Sflow Settings page.
-
Counter Record The Counter Record section provides the definition for the two pre-defined counter record types. There are two types of counter records, ethernet-interface-counters and generic-interface-counters. Generic interface counters are format number 1 and Ethernet interface counters are format number 2. The sensor path for generic interface counters is /sflow-v5/counter-sample/generic-interface-counter. The sensor path for Ethernet interface counters is /sflow-v5/counter-sample/ethernet-interface-counter.
The fields available within the counter records are the possible errors and the countable statistics such as:
-
frame errors
-
collisions
-
deferred transmissions
-
transmit errors
-
administration status
-
operational status
-
input packets
-
output packets
-
input errors
-
output errors
-
and others
You can use either the generic interface counter or Ethernet interface counter in rules that you define. The counter sensors can be defined to pick even single fields from either of the available counters. You can create additional counter record types by clicking the add (+) icon on the Sflow Settings page (Counter Record section).
-
-
Protocol The Protocol section provides a means to define which protocol the sFlow captures contain and allow for the decoding of many network protocols. The fields that are contained in each protocol entry are the same fields as would be seen in a frame or packet of that type. For example, an Ethernet frame would have a destination MAC address, a source MAC address, and an ethernet-next-header-type field. The fields defined in any protocol you want to decode must appear in the protocol definition in the same order as they would appear in the packet or frame.
The number column that appears is the IANA protocol number assigned to that protocol. For example, the tcp protocol is protocol number 6.
On the Sample, Flow Record, and Counter Record sections, there is an Enterprise column. This column is for the use of vendor-specific or custom decoding details. For example, a Foundry ACL-based flow sample has the enterprise value 1991, Format 1, includes additional fields specifically for that Foundry flow.In most instances, the Enterprise value is 0.
Delete sFlow Settings
To delete sFlow settings:
-
Do one of the following:
-
To delete an sFlow sample:
-
Click Sample to view the list of sFlow samples.
-
Select the sFlow sample that you want to delete.
-
Click the delete (trash can) icon.
The CONFIRM DELETE SAMPLE pop-up appears.
Figure 1: Confirm Delete Sample Pop-up
-
-
To delete a flow record:
-
Click Flow Record to view the list of flow records.
-
Select the flow record that you want to delete.
-
Click the delete (trash can) icon.
The CONFIRM DELETE FLOW RECORD pop-up appears.
Figure 2: Confirm Delete Flow Record Pop-up
-
-
To delete a counter record:
-
Click Counter Recordto view the list of counter records.
-
Select the counter record that you want to delete.
-
Click the delete (trash can) icon.
The CONFIRM DELETE COUNTER RECORD pop-up appears.
Figure 3: Confirm Delete Counter Pop-up
-
-
To delete a protocol:
-
Click Protocol to view the list of protocols.
-
Select the protocol that you want to delete.
-
Click the delete (trash can) icon.
The CONFIRM DELETE PROTOCOL pop-up appears.
Figure 4: Confirm Delete Protocol Pop-up
-
-
Configure sFlow in Devices and Device Groups
To process sFlow packets, Paragon Automation depends on rule configuration. It also requires that you enable sFlow in the device group and device definition. This section describes sFlow enablement, and rule and sensor configuration options for sFlow.
First, to enable sFlow, you must enter at least one IP address in the device definition under Flow Source IPs, and enter at least one port number in the device group definition under sFlow Ports. Figure 5 below is a composite image that shows the device definition overlaid with the device group definition. The appropriate sections of each window are highlighted in red.
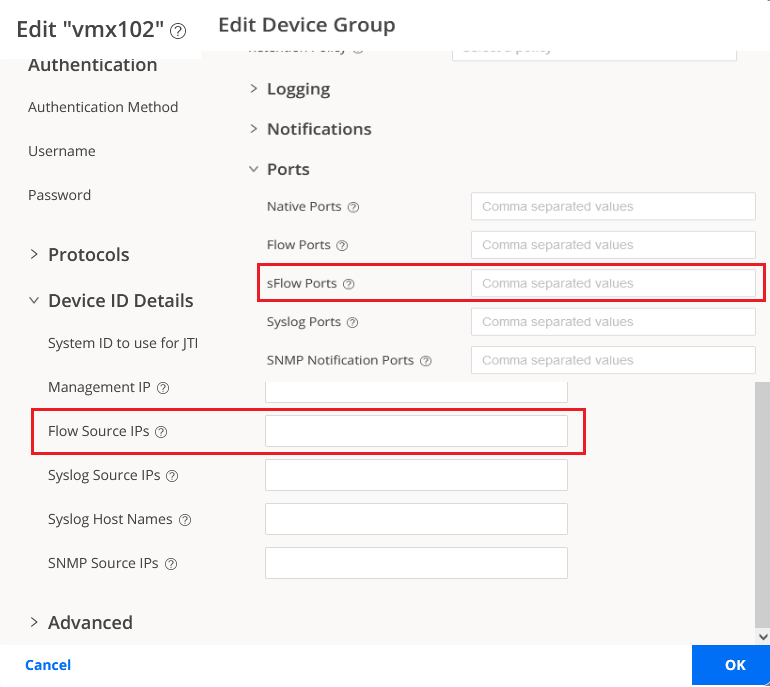
The devices in the group send their sFlow packets to Paragon Automation over the configured UDP port from the configured IP address(es). The port number(s) used in these definitions must be unique across the entire Paragon Automation installation.
-
The one or more Flow Source IPs that you enter must match an IP address that can be mapped from the Hostname/IP Address/Range field in the device definition. If devices send sFlow packets, but Paragon Automation cannot match the source IP to a defined device IP, then the packets are dropped without decoding.
-
Paragon Automation cannot differentiate sFlow from NetFlow by looking at the packets. If you are using both NetFlow and sFlow, the port numbers must also be unique between the two flow types.
Due to the nature of sFlow and the potentially huge amount of data that can come from even a single device, we recommend the following best-practices for managing sFlow ingest:
-
Use unique ports from the range: UDP/49152 to UDP/65535 for sFlow.
-
Use periodic aggregation to reduce the number of write procedures in the TSDB.
-
Do not enable the raw table data storage option in sFlow unless sufficient high-speed storage is available for Paragon Insights TSDB.
Configure a Rule Using sFlow
As with other rule definitions, sFlow rules are made up of sensors, fields, vectors, and so on. An sFlow sensor has a Sensor Name, a Sensor Type of sFlow, and an sFlow Path as shown in Figure 6.
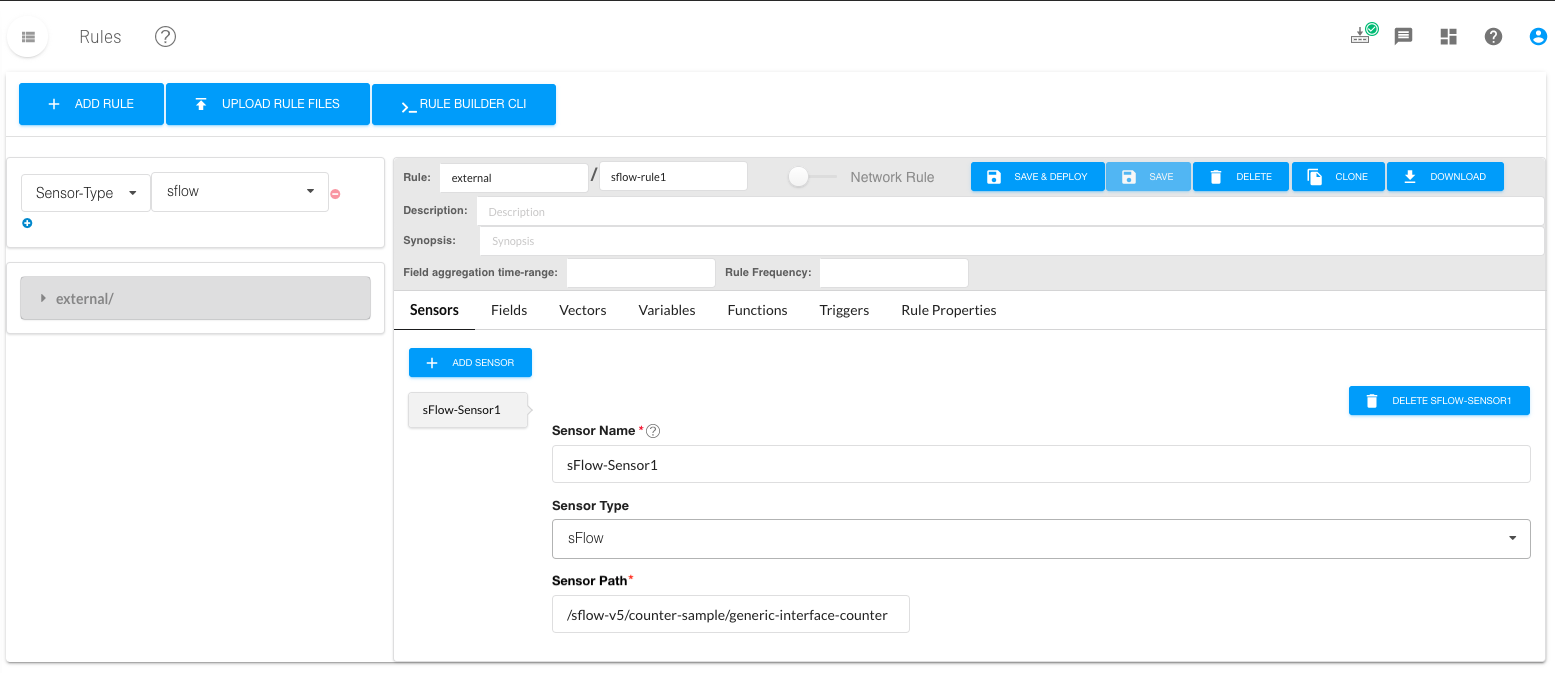
The sensor path serves a big role in sensor definition. Paragon Automation uses the sensor path to define not only the sFlow flow type, but the sample type, record type, protocol, and other custom path elements if needed.