View Stream Details
Streams Overview
At the time of Test or Monitor creation, you can configure evaluation criteria for various metrics.
When you run a Test or a Monitor, Paragon Automation instructs the Test Agents to send or receive traffic in the network by using the selected protocols. Each measurement produces one or more Stream of metrics.
The Test and Monitor evaluate these Streams and present a summary in the respective Stream-Name Details pages. On violation of a configured evaluation criterion, an event is generated. You can view the Stream graphs on Stream-Name Details page and identify the cause of violation.
Access Stream-Name Details Page
To access the Stream-Name Details page:
-
Select Observability > Active Assurance > Tests or Observability > Active Assurance > Monitors, and click a Test-Name or a Monitor-Name.
The Test-Name or Monitor-Name page appears.
-
Click a Stream-Name from the Streams table.
The Stream-Name Details page appears.
Tasks You Can Perform
On the Stream-Name Details page, you can:
-
View Stream results for a specific period—You can select a predefined period (15m, 2h, 4h, 8h, 16h, 24h, 1w) for which you want to view the results of all Streams. You can also click Custom to set a custom time range for which you want to view the results of all Streams. On the Custom Time Range Selection page that appears, enter the day and time in the From and To fields, respectively.
-
View the events on an event bar—You can view all the events generated on an event bar. The event bar is a colour-driven bar graph that indicates events and the time at which the event has occurred. The colors represent the severity of events. That is, critical events are represented in red, errors are represented in orange, warnings are represented in yellow, information is represented in blue.
You can also hover over an event generated on the heatmap to view the start time, end time, total number of events generated, and the number of events generated in each type.
-
View the status of the selected Stream—You can view the status of the selected Stream. The Stream is displayed as an event bar. Click > to view the event bar for the Stream. When you hover over the event bar, you can view the events generated for the Stream.
-
View the configurations details—You can view all the parameters you specified for a Task when you created a Test or a Monitor. Click Config to view all the parameters you have configured. For more information, see Create a Test and Create a Monitor.
-
View the stream graph for a specific metric—You can view a stream graph of a specific metric. To view an stream graph, enable the Metric-Name toggle button for which you want to view the stream graph. The Metric-Name can vary based on the Tasks you have selected. A list of all the metrics are defined in Table 1.
-
View stream graphs for all metrics—You can view the stream graphs of all the metrics. To display stream graphs of all the generated metrics, click the Show All button.
-
Group stream graphs by metrics—You can organize the stream graphs logically to get a coherent view of metrics.
When you enable the Group Metrics toggle button, the metrics are logically categorized. That is, all the related metrics are grouped under a primary stream graph. For example, for a ping Task, metrics such as minimum time response, maximum time response, and average time responses will be grouped under Response (primary metric).
Once enabled, you can select and deselect the individual metrics in an stream graph. The data related to the metrics you selected will be displayed on the stream graph.
When you disable the Group Metrics toggle button, all the metrics are displayed. By default, this toggle button is disabled.
-
View stream graphs in compact view—You can view all the stream graphs in compact mode to navigate easily between individual graphs. The compact view provides a streamline view of multiple graphs. To view the stream graphs in compact mode, enable the Compact view toggle button.
All the stream graphs for the metrics you toggled on will be displayed in compact view. The compact view provides a concise display of all the stream graphs that helps you to analyze various metrics simultaneously.
| Stream Metric | Description |
|---|---|
|
DNS |
|
| Minimum response time |
Minimum response time indicates the minimum duration for the response packet to reach the Test Agent from the remote endpoint. The response time is calculated in milliseconds. |
| Average response time |
Average response time indicates the average duration for the response packet to reach the Test Agent from the remote endpoint. The response time is calculated in milliseconds. |
| Maximum response time |
Maximum response time indicates the maximum duration for the response packet to reach the Test Agent from the remote endpoint. The response time is calculated in milliseconds. |
| ES timeout |
ES timeout is the errored seconds raised when Test Agent considers a DNS request to be timed-out. The ES timeout is calculated in milliseconds. |
| ES lifetime |
ES lifetime is the errored seconds raised when Test Agent fails the DNS request as there is no response received within the specified Request lifetime. The ES lifetime is calculated in milliseconds. |
| ES response |
ES response is the errored seconds raised when the DNS Response code differs from the predefined Response code or when the response differs from the Expected response. |
|
ES |
ES is the number of seconds during which errors occurred in a specific duration of time. It is the total number of error-seconds raised during a DNS resolution process. The ES is calculated in milliseconds. |
|
HTTP |
|
|
Connect time |
Connect time is the time taken to set up a TCP connection between the Test Agent and the Web server by using a TCP handshake. The connect time is calculated in milliseconds. |
|
First byte received |
First byte received indicates the total time taken by the Test Agent to receive the first byte of response packet from the Web server. The first byte received time is calculated in milliseconds. |
| Minimum response time |
Minimum response time indicates the minimum duration for the response packet to reach the Test Agent from the remote endpoint. The response time is calculated in milliseconds. |
| Average response time |
Average response time indicates the average duration for the response packet to reach the Test Agent from the remote endpoint. The response time is calculated in milliseconds. |
| Maximum response time |
Maximum response time indicates the maximum duration for the response packet to reach the Test Agent from the remote endpoint. The response time is calculated in milliseconds. |
|
Size |
Size indicates the total size of the data transferred from a remote endpoint to the Test agent in response to an HTTP request. The size also includes the header size. The size is calculated kilobytes. |
|
Rate |
Rate indicates the rate at which the Test Agent sends the request packet and receives the response packet from the remote endpoint in a selected interval of time. The rate is displayed in Megabits Per Second. |
| ES timeout |
ES timeout is the errored seconds raised when Test Agent considers a DNS request to be timed-out. The ES timeout is calculated in milliseconds. |
| ES response |
ES response is the errored seconds raised when the response code differs from the predefined Response code or when the response differs from the Expected response. |
|
ES |
ES is the number of seconds during which errors occurred in a specific duration of time. It is the total number of error-seconds raised during an HTTP transaction. The ES is calculated in milliseconds. |
|
Ping |
|
|
Successful ping counts |
Successful ping counts indicate the number of Internet Control Message protocol (ICMP) echo request packets successfully sent from the Test Agent and the number of ICMP echo reply received from the remote endpoint during a selected period of time. The higher ping counts denote to a more reliable the network connection. |
|
Minimum round-trip delay |
Minimum round-trip delay indicates the minimum delay experienced by a packet during a round trip. A round trip measures the amount of time taken by the request packet to travel from the Test Agent to the remote endpoint and the response packet to travel from the remote endpoint to the Test Agent. The delay is calculated in milliseconds. |
|
Maximum round-trip delay |
Maximum round-trip delay indicates the maximum delay experienced by a packet during a round trip. A round trip measures the amount of time taken by the request packet to travel from the Test Agent to the remote endpoint and the response packet to travel from the remote endpoint to the Test Agent. The delay is calculated in milliseconds. |
|
Average round-trip delay |
Average round-trip delay indicates the average delay experienced by a packet during a round trip. A round trip measures the amount of time taken by the request packet to travel from the Test Agent to the remote endpoint and the response packet to travel from the remote endpoint to the Test Agent. The delay is calculated in milliseconds. |
|
Average round-trip DV |
Average round-trip delay variance indicates the jitter in the average amount of time taken by the request packet to travel from the Test Agent to the remote endpoint and the response packet to travel from the remote endpoint to the Test Agent. Delay variance occurs when different request packets take different amount of time to travel from Test Agent to remote endpoint and vice versa. The delay variance is calculated in milliseconds. |
|
Lost |
Lost indicates the number of ping request packets sent by the Test Agent that were lost before reaching the remote endpoint or the response packets that were lost before reaching the Test Agent in a selected period of time. |
|
Loss |
Loss percentage indicates the percentage of request packets sent from the Test Agent that were lost before reaching the remote endpoint or the response packets that were lost before reaching the Test Agent. The Loss percentage is calculated by comparing the total number of ping requests that were lost with the total number of pings that were sent from the Test Agent. |
|
ES |
ES is the number of seconds during which errors occurred in a specific duration of time. It is the total number of error-seconds raised during a ping session. The ES is calculated in milliseconds. |
|
ES loss |
ES loss is the number of errored-seconds raised when the request packets were lost during a round-trip. The ES loss is calculated in milliseconds. |
|
ES delay |
ES delay is the number of errored-seconds raised when the Test Agents experience delay in receiving the response from the remote endpoint. The ES delay is calculated in milliseconds. |
| ES response |
ES response is the errored seconds raised when the response code differs from the predefined Response code or when the response differs from the Expected response. |
| ES delay variance (DV) |
ES delay variance is the number of errored seconds raised when the packets sent and received by the Test Agents experience different amount of time to travel in a round trip. The ES delay variance is calculated in milliseconds. |
|
TWAMP/TWAMP Light |
|
|
Rate |
Rate indicates the download rate at which the Test Agent receives the response packet from the TWAMP reflector in a selected interval of time. The rate is calculated as the size of the response received divided by the total response time. The rate is calculated in Megabits Per Second. |
|
Minimum round trip time |
Minimum round-trip time indicates the minimum amount of time taken by the request packet to travel from the Test Agent to the remote endpoint and the response packet to travel from the remote endpoint to the Test Agent. The time is calculated in milliseconds. |
|
Average round trip time |
Average round-trip time indicates the average amount of time taken by the request packet to travel from the Test Agent to the remote endpoint and the response packet to travel from the remote endpoint to the Test Agent. The time is calculated in milliseconds. |
|
Maximum round trip time |
Maximum round-trip time indicates the maximum amount of time taken by the request packet to travel from the Test Agent to the remote endpoint and the response packet to travel from the remote endpoint to the Test Agent. The time is calculated in milliseconds. |
|
Round trip time DV |
Round trip time delay variance (jitter) indicates the difference in round trip delay experienced from the predefined round trip delay value. The round-trip time indicates the amount of time taken by the request packet to travel from the Test Agent to the remote endpoint and the response packet to travel from the remote endpoint to the Test Agent. The Round trip time DV is calculated in milliseconds. |
|
Received Packets |
Received packets indicates the total number of packets received by the Test Agent from the remote endpoint. |
|
Far-end loss |
Far-end loss is the percentage of packet loss measured at the far-end of the connection request, that is the remote endpoint. Loss indicates the percentage of TWAMP request packets sent from the Test Agent to the remote endpoint. |
|
Far-end lost |
Far-end lost indicates the number of request packets lost before reaching the remote endpoint. Lost indicates the number of TWAMP request packets sent by the Test Agent that were lost before reaching the remote endpoint. |
|
Far-end misorders |
Far-end misorders indicates that the request packets sent by the Test Agent reached the remote endpoint out of sequence compared to their original order of transmission. |
|
Minimum far-end delay |
Minimum far-end delay indicates the minimum amount of delay experienced by the request packets from the Test Agents to reach the remote endpoint. The delay is calculated in milliseconds. |
|
Average far-end delay |
Average far-end delay indicates the average amount of delay experienced by the request packets from the Test Agents to reach the remote endpoint. The delay is calculated in milliseconds. |
|
Maximum far-end delay |
Maximum far-end delay indicates the maximum amount of delay experienced by the request packets from the Test Agents to reach the remote endpoint. The delay is calculated in milliseconds. |
|
Far-end DV |
Far-end DV indicates the delay variance measured at the remote endpoint. It is the difference in delay experienced from the predefined delay value. The delay variance indicates the difference of time delay experienced by request packets from the Test to reach the remote endpoint. The delay is calculated in milliseconds. |
|
Near-end loss |
Near-end loss is the percentage of packet loss measured at the near-end of the connection request, that is the Test Agent. Loss indicates the percentage of TWAMP response packets sent from the remote endpoint to the Test Agent |
|
Near-end lost |
Near-end lost indicates the number of response packets lost before reaching the Test Agent. Lost indicates the number of TWAMP response packets sent by the remote endpoint that were lost before reaching the Test Agent . |
|
Near-end misorders |
Near-end misorders indicates that the response packets received by the Test Agent out of sequence compared to their original order of transmission. |
|
Minimum near-end delay |
Minimum near-end delay indicates the minimum amount of delay experienced by the response packets from the remote endpoint to reach the Test Agents. The delay is calculated in milliseconds. |
|
Average near-end delay |
Average near-end delay indicates the average amount of delay experienced by the response packets from the remote endpoint to reach the Test Agents. The delay is calculated in milliseconds. |
|
Maximum near-end delay |
Maximum near-end delay indicates the maximum amount of delay experienced by the response packets from the remote endpoint to reach the Test Agents. The delay is calculated in milliseconds. |
|
Near-end DV |
Near-end DV is the delay variance measured at the source, that is the Test agent. The delay variance indicates the difference of time taken by the response packets from the remote endpoint to reach the Test Agent. The delay is calculated in milliseconds. |
|
ES |
ES is the number of seconds during which errors occurred in a specific duration of time. It is the total number of error-seconds raised during a TWAMP session. The ES is calculated in milliseconds. |
|
ES delay |
ES delay is the number of errored-seconds raised when the Test Agents experience delay in receiving the response from the remote endpoint. The ES delay is calculated in milliseconds. |
| ES loss |
ES loss is the number of errored-seconds raised when the request packets were lost during a round-trip. The ES loss is calculated in milliseconds. |
| ES delay variance (DV) |
ES delay variance is the number of errored seconds raised when the packets sent and received by the Test Agents experience different amount of time to travel in a round trip. The ES delay variance is calculated in milliseconds. |
|
ES DSCP |
ES DSCP is the number of errored-seconds occurred when the DSCP marked packets experience loss, delay, delay variance, or configuration issues |
|
SES |
Severely errored second (SES) indicates the interval of time during which the connection has encountered errors or failures. It indicates the threshold violations that happened in a one-second interval if the configured time exceeds a certain predefined threshold. |
|
First round trip delay percentile |
First round trip delay percentile. If the delay exceeds the configured value, the packet is included in the defined first delay percentile slot. |
|
Second round trip delay percentile |
Second round trip delay percentile. If the delay exceeds the configured value, the packet is included in the defined second delay percentile slot. |
|
First far end round trip delay percentile |
First far end round trip delay percentile. If the delay exceeds the configured value, the packet is included in the defined first far end round trip delay percentile slot. |
|
Second far end round trip delay percentile |
Second far end round trip delay percentile. If the delay exceeds the configured value, the packet is included in the defined second far end round trip delay percentile slot. |
|
First near end round trip delay percentile |
First near end round trip delay percentile. If the delay exceeds the configured value, the packet is included in the defined first near end round trip delay percentile slot. |
|
Second near end round trip delay percentile |
Second near end round trip delay percentile. If the delay exceeds the configured value, the packet is included in the defined second near end round trip delay percentile slot. |
|
ES for first round trip delay percentile |
ES for first round trip delay percentile. If the delay exceeds the configured value, the packet is included in the defined first round trip delay percentile slot and an errored-second is raised. |
|
ES for second round trip delay percentile |
ES for second round trip delay percentile. If the delay exceeds the configured value, the packet is included in the defined second round trip delay percentile slot and an errored-second is raised. |
|
Round trip loss |
Round trip loss indicates the percentage of TWAMP request packets sent from the Test Agent that were lost before reaching the remote endpoint or the response packets that were lost before reaching the Test Agent. The Loss percentage is calculated by comparing the total number of ping requests that were lost with the total number of pings that were sent from the Test Agent. |
|
Round trip lost |
Round trip lost indicates the number of TWAMP request packets sent by the Test Agent that were lost before reaching the remote endpoint or the response packets that were lost before reaching the Test Agent in a selected period of time. |
|
Timestamp samples |
Timestamp samples is the number of valid timestamp samples used in measuring delay. |
|
TWAMP Reflector |
|
|
Received packets |
Received packets indicates the number of packets received by the Test Agent from the reflector. |
|
Rate |
Rate indicates the download rate at which the Test Agent receives the response packet from the reflector in a selected interval of time. The rate is calculated as the size of the response received divided by the total response time. The rate is displayed in Megabits Per Second. |
|
Active sessions |
Active sessions indicates a period that is actively ongoing between the Test Agent and TWAMP reflector. |
|
Bytes received |
Bytes received indicates the total size of the response packets received by a Test Agent from a TWAMP reflector during a session. The size also includes the header size. |
|
ES |
ES is the number of seconds during which errors occurred in a specific duration of time. It is the total number of error-seconds raised during a TWAMP session. The ES is calculated in milliseconds. |
|
ES rate |
ES Rate is the number of errored-seconds raised while downloading the response packet from the reflector. The ES rate is calculated in milliseconds. |
|
RPM (HTTP, PING, TCP, UDP) |
|
|
Round trip time |
Round trip time (RTT) measures the amount of time taken by the request packet to travel from the Test Agent to the remote endpoint and the response packet to travel from the remote endpoint to the Test Agent. RTT indicates the time delay between sending a request and receiving a response. |
|
Round trip jitter |
Jitter occurs when the packets experience a delay during a round trip, from the
Test Agent to the remote endpoint. Round-trip jitter indicates the time difference between the current measurement of the round-trip time with its previous measurement. The delay is calculated in milliseconds. |
|
Round trip inter-arrival |
The Round-trip interarrival jitter measures the total statistical variance of a packet’s interarrival time as defined in IETF RFC 1889. The interarrival jitter is calculated in milliseconds |
|
Loss |
Loss indicates the percentage of request packets sent from the Test Agent that were lost before reaching the remote endpoint or the response packets that were lost before reaching the Test Agent. Loss percentage is calculated by comparing the total number of packets that were lost with the total number of packets that were sent from the Test Agent. |
Analyze the Stream Graph
A stream graph is a graphical representation of a metric generated by a Stream over a period of time. You can generate multiple stream graphs for various metrics by enabling the corresponding toggle button.
In the stream graph, the X axis (horizontal) always represents the time duration of Test or Monitor. The Y axis (vertical) represents the metric value that is being measured.
For example, create a Test by adding an RPM Ping Task with the threshold value for Round Trip Time (RTT) set to 10 seconds (s). When you run this Test, the following graph is displayed in the Stream-Name Details page.
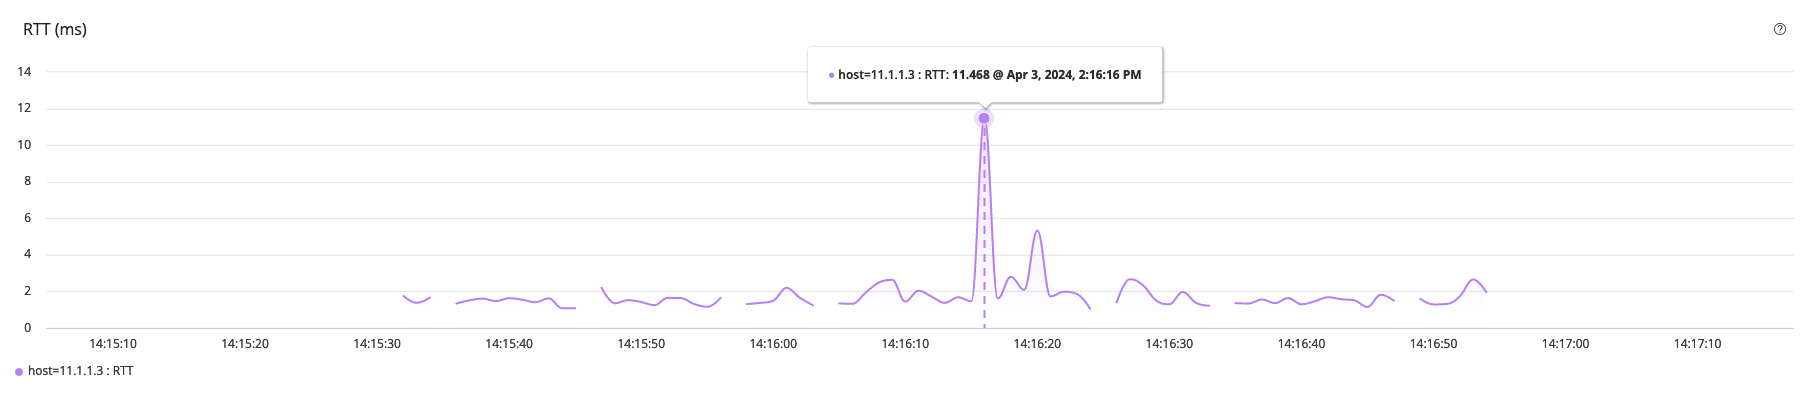
In this stream graph (Figure 1), the X axis represents the time duration of the Test (14:15:10 through 14:17:10) and the Y axis displays the RTT value (0 through 14 milliseconds).
From the stream graph, you can infer that the RTT has exceeded the threshold (> 10) value at 14:16:16. At this moment, because the RTT value reached 11.468 ms, which is greater than the specified threshold value, an event is generated.