Device Connectivity Data and Tests Results
This section provides an overview of connectivity tests, test results, and configurations that an administrator must perform to enable the tests.
When you onboard a device, Paragon Automation automatically triggers test agents installed on your devices that generate synthetic traffic to initiate a connectivity test. The test streams run from a device to neighboring devices, edge routers, Internet endpoints (such as DNS service, HTTP service, and web services), and to the external hosts on Google Cloud Platform (GCP), Microsoft Azure, and Amazon Web Services (AWS) clouds.. Paragon Automation supports connectivity tests to Asia, Europe, and North American regions of the three cloud providers. The duration of a connectivity test is one minute.
For details on devices that support test agents, see Supported Devices and OS Versions.
Configurations to Trigger Connectivity Tests
To enable Paragon Automation to initiate test connections during device onboarding, you must configure the interface profile. You can then associate the interface profile with one or more devices that you include in the network implementation plan. Users with Super User and Network Admin roles must perform the following configurations to enable Paragon Automation to initiate connectivity tests.
-
Internet Connected—Enable Internet Connected in the interface profile. When you include this interface profile in a network implementation plan, Paragon Automation triggers connectivity tests from specific or all device ports.
If you assign the interface profile as the default profile, Paragon Automation triggers Internet Endpoint and Cloud Provider connectivity tests on all ports of all devices that you configure in the network implementation plan. See Add an Interface Profile for more information.
-
Active Assurance—Configure device labels, endpoint device URLs, and the cloud provider hosts to which test agents run connectivity tests on the Create Device Profile) page. See Add a Device Profile for more information.
Connectivity Accordion
To access the Connectivity accordion, navigate to the Observability > Health > Troubleshoot Devices page. Click a device name to access the Device-Name page. Click the Connectivity (accordion) in the Overview tab.
The connectivity accordion on the Device-Name page displays the health of connections from a device in your network to a remote device. The accordion displays the overall status of the device connections at the top-right corner. The status displays Urgent Action Needed if critical events occur within the last seven days or Healthy if no connection issues are detected. You can view connection-specific details when you expand the accordion. You have the flexibility to configure automated connectivity tests when you plan device onboarding or use the Retest button in the connectivity accordion to run connectivity tests after onboarding devices. You can run the tests on all connections (ports) of devices or select connections on which you want to run the test.
After the tests are complete, you can view the results of these tests as links in the Connectivity accordion on the Device-Name page. Table 2 describes the fields in the Connectivity accordion.
Click the health status links for a connection to view details about the faulty connections on the Connectivity Details Page. On the Connectivity Details page, you can rerun tests for specific or all remote endpoints after you resolve the connectivity issues.
The following list explains terms associated with connectivity tests:
-
Metrics—Metrics such as delay, delay variance, HTTP timeout, ping (packet) loss, and round trip time (RTT) enable Paragon Automation to collect quantitative measurements to evaluate the quality of a connection.
-
Protocols—Protocols such as HTTP, ping, and DNS are used to measure the metrics in a connectivity test. Ping is used to test connectivity from a device in your network to neighboring devices, edge devices, and known hosts in the cloud provider's network. HTTP and DNS protocols are used to test connectivity to Internet endpoints such as DNS service, HTTP service, or other web services.
-
Types of remote endpoints—Types of remote devices to which test agents check connectivity. Remote endpoints can be neighboring devices, edge devices, Internet endpoints (DNS servers or web servers), and devices (external hosts) in the cloud.
-
Connection—Connections are unidirectional flows of synthetic traffic from a test agent installed on a device to a test agent on another device, from a test agent to a reflector (BGP peering), or from a test agent to an external host in a public cloud. A connectivity test to a remote endpoint, such as neighboring devices, include multiple connections. Depending on the remote endpoint, each connection uses a protocol (such as ping) to check for select metrics (such as RTT). If a single connection (unidirectional traffic flow) experiences issues, the test fails.
-
Test Result—Test Results are shown as timeline graphs of multiple key performance indicators (KPIs)—such as error seconds, response time, and packet loss—that indicate the health of a connection type. The KPIs are calculated based on the metric data collected for delay, delay variance, ping packet loss, round trip time, HTTP/ping response time, and HTTP timeout.
| Connection | Description |
|---|---|
| Neighbors |
Neighbors are routers that use dynamic routing protocols to discover each other in a network topology. Neighbors can use multicast messages or unicast messages depending on the network configuration. Displays the number of neighboring devices connected to the device and the health of their connection (healthy or unhealthy) to the device. |
| Edges |
Edge devices are devices at the perimeter that connects your network to another network. An edge device can be peering devices in your local network, an Internet Gateway, a customer edge or a provider edge device, an area border router (ABR), or an autonomous system border router (ASBR). Displays the number of edge devices (routers) connected to the device and the health of their connection (healthy or unhealthy) to the device. |
| Internet Endpoints |
Endpoints are URLs that locate a service that is hosted on a remote server. Examples of services are HTTP service, DNS service, or other web services that you want to access. Displays the number of Internet endpoints (servers) and the health of their connection (healthy or unhealthy) to the device. |
| Cloud Providers |
If you enable connectivity tests to public cloud providers in a device profile, test agents initiate a connectivity test from the device to known hosts in a public cloud provider's network. Displays the number of regions to which connectivity tests are initiated for Amazon Web Services, Google Cloud Platform, and Microsoft Azure. View the status of the connectivity (healthy or unhealthy) from the cloud host to the device. |
| Relevant Events |
You can access events of varying severity that are generated for the tests within the last seven days. Click Details to view the device name, test description, and start time and end time of the tests. Click View All Relevant Events to open the Events for Device-Name page that displays all events generated for different connections from the device. The Events for Device-Name page contains the following information:
|
| Retest | To re-run connectivity tests, click Retest and select All Connections if you want Paragon Automation to re-run connectivity tests on all the connections. |
Connectivity Details Page
To access the Connectivity accordion, navigate to the Observability > Health > Troubleshoot Devices page. Click a device name to access the Device-Name page. Click the Connectivity (accordion) in the Overview tab. Click any hyperlink in the accordion and you are directed to the Connectivity Details page.
The Connectivity Details page contains the following sections:
-
Relevant Events—After completing connectivity tests, Paragon Automation generates Critical and Information events for connectivity tests and bad cables. An Informational event denotes that the test passed and a critical event denotes that the test failed. Click View all Relevant Events to view events triggered for all tests to the device's connections.
-
Refresh—Paragon Automation automatically refreshes the data every 10 minutes and displays the time for the upcoming round of connectivity data refresh. Alternatively, click the Refresh icon to refresh the connectivity data for the device connections.
-
Show Connections Between—Displays the category of remote endpoint (such as edge devices, neighboring devices, and cloud providers), and the number of devices in each remote endpoint category.
Enable the toggle button corresponding to a connection type to view the health of the connection in the topology view.
-
Connections Between Devices—Displays a topology view of all connections from a device. For a remote endpoint, the topology view shows a single line that represents all connections from a device to multiple remote devices. You can perform the following tasks related to connections:
-
Access details of faulty connections on the topology map—After the connectivity tests are run on the onboarded device, the topology view displays the count of faulty connections. Faulty connections appear as red icons on the lines that indicate the connections. You can hover your cursor over the count icon to obtain details of the faults for a connection type.
-
Run connectivity tests—To re-run connectivity tests, click Retest and select All Connections if you want Paragon Automation to re-run connectivity tests on all the connections. Alternatively, you can select a specific connection (Neighbors , Edges, Internet Endpoints, or Cloud Providers) to which you want to re-run the test from the device.
After the test is complete, the topology view is automatically updated. In addition, the Connections table below the topology view displays the updated information.
To view additional details (such as a detailed view of the logs raised for events, errors, protocols used, and so on) of a test, click the details icon that appears when you hover your mouse over the time range of the test.
-
-
Connections—Displays a table with details about the connectivity tests run on the device. Table 2 describes the fields you see in the Connections table.
-
To view the test results, click the connectivity status (ERROR, PASSED, or FAILED) on the Connections table. The Test Results for Device-name to Device-name page appears. The Test Results page shows the KPIs and metrics collected from the test connections. You can view results in timeline graphs. See View Connectivity Test Results for more information.
-
To view details of a connection, select a connection in the table. Click More > Detail. The Source to Remote End Point pane displays test time range, source, remote endpoint, test protocol, test result, and number of logs on the Details tab.
On the log tab, view log details for the connection such as the start time, end time, log level, and log message.
-
| Field | Description |
|---|---|
| Status | Displays the status of the connection:
|
| Test Time Range | Displays the date and time range when a test is executed. The date is displayed in the DD/MM/YYYY format and the time as Minutes:Seconds, with the time zone. |
| Source | Displays the name of the device from which the synthetic traffic is sent. |
| Source Interface | Displays the name of the interface on the source device from which the synthetic traffic is sent. |
| Destination | Name of the cloud provider and the region you previously configured for the connectivity test. |
| Remote End Point | Displays the name or management IP address of the remote device
to which Paragon Automation initiates connectivity test, along with
its management interface name. Example: Device-name:10.1.1.1 |
| Logs | Displays the number of logs generated for the connection from the device. |
| Protocol | Displays the protocol used for the test connection initiated by the test agent, such as HTTP, DNS, or Ping. |
| Type | Displays the type of remote endpoint to which the test agent initiated connectivity test. For example, Internet Endpoints DNS, Cloud Endpoints Reachability, Edge Reachability, or Neighbor reachability. |
View Connectivity Test Results
The Test Results for Device-name-1 To Device-name-2 page displays the KPIs and metrics as a timeline graph. KPIs in tests include error seconds, response time, and (packet) loss (%).
You can access the Test Results for Device-name-1 To Device-name-2 when you click PASSED or FAILED status links on the Connectivity Details page. Expand each KPI to view the measurements that are displayed in the timeline graph. Table 3 displays the test metrics for the DNS protocol, Table 4 displays the test metrics for the HTTP protocol, and Table 5 displays the test metrics for the ping protocol.
You can view the following information on the Test Results page:
-
Error Seconds—For connectivity tests, the test results are compiled every 1 second. Every second, Paragon Automation checks if an error occurred for a test metric in a connection. If an error occurred in a connection, the Error Seconds graph displays 100%, else 0% for the test result compilation time. The graph plots the error seconds every time test results are compiled for the default test duration of 60 seconds.
Figure 1: Error Seconds Graph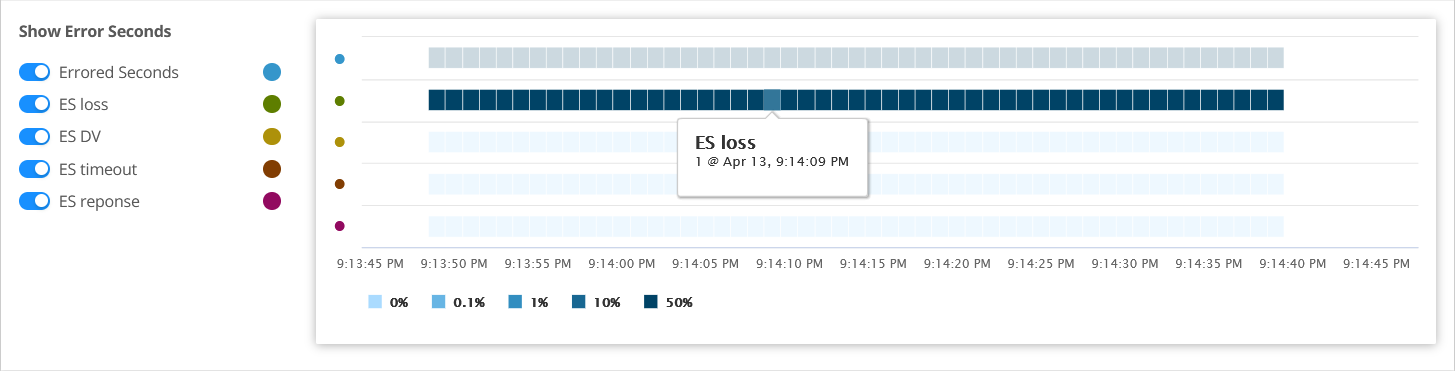
-
Response time—Displays the maximum, average, and minimum response time for DNS, HTTP, and ping packets in milliseconds. Delay variance or jitter is the variance in the amount of time taken by different packets when they traverse from a sending device to a receiving device. The less delay variance you measure in your network, the less latency you experience. Less latency is desirable in voice-based applications such as teleconferencing.
Figure 2: Response Time Graph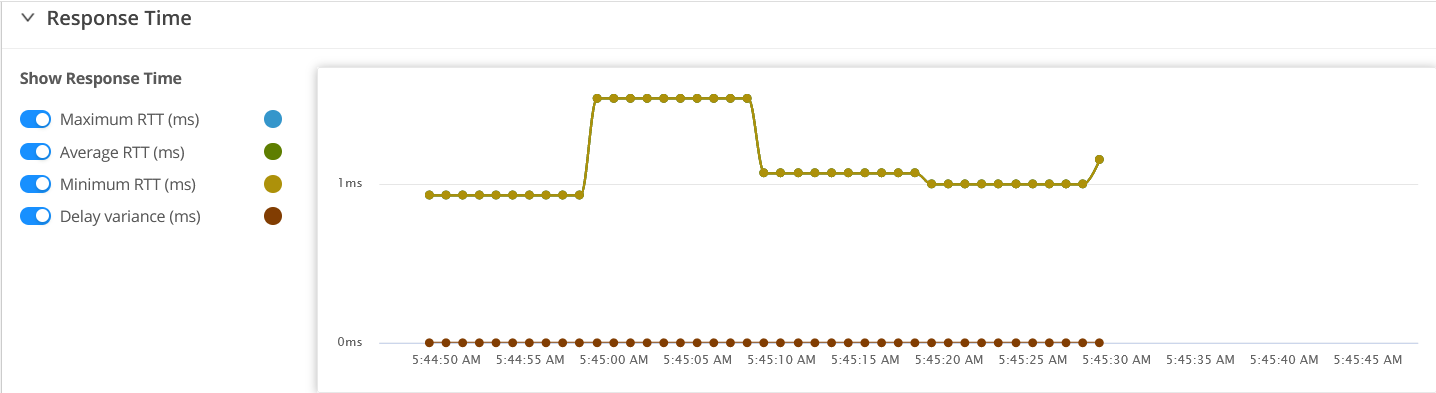
-
Loss—The Percent lost metric measures the percentage of pings that are lost out of the total number of pings sent to a remote device. If the percentage of pings lost exceeds 60, then Paragon Automation generates a neighbor ping test alert.
Figure 3: Loss Graph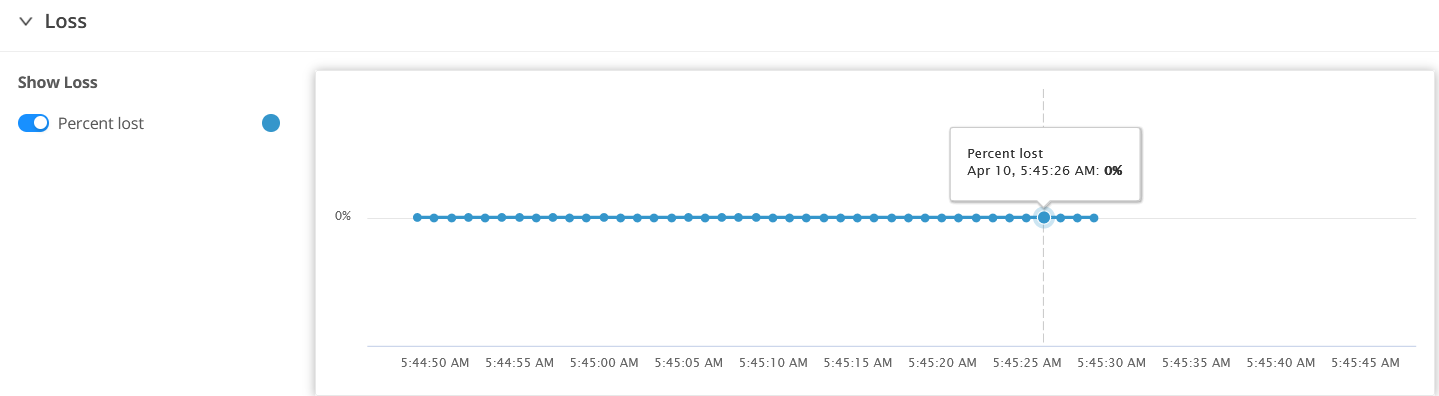
| Test Metrics | DNS |
|---|---|
| Error seconds (ES) | Yes |
| ES timeout | Yes |
| ES lifetime | Yes |
| ES response | Yes |
| ES loss | No |
| ES delay variance (DV) | No |
| Response Time | |
| Maximum response time (milliseconds) | Yes |
| Average response time (milliseconds) | Yes |
| Minimum response time (milliseconds) | Yes |
| Delay variance (milliseconds) | No |
| Loss | |
| Percent lost | No |
| Test Metrics | HTTP Request |
|---|---|
| ES timeout | Yes |
| ES lifetime | No |
| ES response | Yes |
| ES loss | No |
| ES delay variance (DV) | No |
| Response Time | |
| Maximum response time (milliseconds) | Yes |
| Average response time (milliseconds) | Yes |
| Minimum response time (milliseconds) | Yes |
| Delay variance (milliseconds) | No |
| Loss | |
| Percent lost | No |
| Test Metrics | Ping Request |
|---|---|
| ES timeout | Yes |
| ES lifetime | No |
| ES response | Yes |
| ES loss | Yes |
| ES delay variance (DV) | Yes |
| Response Time | |
| Maximum response time (milliseconds) | Yes |
| Average response time (milliseconds) | Yes |
| Minimum response time (milliseconds) | Yes |
| Delay variance (milliseconds) | Yes |
| Loss | |
| Percent lost | Yes |