- play_arrow Introduction
- play_arrow Overview
- play_arrow Access and Manage Paragon Automation Account
-
- play_arrow Administration
- play_arrow Introduction
- play_arrow Organization Management
- play_arrow Site Management
- play_arrow User Management
- play_arrow Inventory Management
- play_arrow Audit Logs
-
- play_arrow Device Life Cycle Management
- play_arrow Introduction
- play_arrow Day-Wise Activities for Device Life Cycle Management
- play_arrow Field Technician User Interface
- play_arrow Onboarding Profiles
- play_arrow Plan Device Onboarding
- play_arrow View Device Onboarding
- play_arrow Device Management
- Device Management Workflow
- Device Licenses Overview
- About the Features Tab
- About the Licenses Tab
- Manage Device Licenses
- About the Software Images Page
- Upload a Software Image
- Delete a Software Image
- About the Configuration Backups Page
- Configuration Templates Overview
- About the Configuration Templates Page
- Add a Configuration Template
- Edit and Delete a Configuration Template
- Preview a Configuration Template
- Deploy a Configuration Template to a Device
-
- play_arrow Observability
- play_arrow Introduction
- play_arrow Troubleshoot Devices
- play_arrow View Network Topology
-
- play_arrow Trust and Compliance
- play_arrow Introduction
- play_arrow Manage Trust Settings and Trust Scores
- Compliance Standards Overview
- About the Compliance Benchmarks Page
- About the Compliance Tailorings Page
- Example: Create a Tailoring Document for NTP Settings
- About the Compliance Checklist Page
- Add a Checklist Template
- Add Checklist for a Device
- Import Scans and Update Rule Results in a Checklist
- Trust Plans Overview
- About the Network Score Formula Page
- Trust Score Overview
- About the Network Score Page
- About the Snapshots Page
- Add a Snapshot for a Target
- play_arrow Manage Compliance Scans
- play_arrow Manage Vulnerabilities
- play_arrow Monitor Integrity
-
- play_arrow Service Orchestration
- play_arrow Introduction
- play_arrow View Service Design Catalog
- play_arrow Manage Customers
- play_arrow Add Resources for Network Services
- play_arrow Manage Service Instances
- play_arrow Provision L3VPN Service
- play_arrow Monitor Service Order Execution Workflows
-
- play_arrow Paragon Shell CLI Reference
- play_arrow Introduction
- play_arrow Operational Mode Commands
- file copy
- monitor
- request paragon backup
- request paragon cluster pods reset
- request paragon cluster upgrade
- request paragon config
- request paragon deploy
- request paragon deploy cluster
- request paragon destroy cluster
- request paragon fix-permission
- request paragon load
- request paragon repair-node
- request paragon replace-node
- request paragon restore
- request paragon running-config
- request paragon ssh
- request paragon ssh-key
- request paragon storage cleanup
- request paragon super-user password reset
- request system decrypt password
- request system reboot
- show configuration paragon cluster
- show host disk usage
- show paragon backup
- show paragon certificate expiry-date certificate-type
- show paragon cluster
- show paragon cluster details
- show paragon cluster namespaces
- show paragon cluster nodes
- show paragon cluster pods
- show paragon cluster pods namespace healthbot sort
- show paragon images version
- show paragon images version namespace
- show paragon pvc details
- show paragon version
- play_arrow Configuration Mode Commands
- delete paragon cluster
- load set
- set paragon cluster applications
- set paragon cluster common-services ingress
- set paragon cluster install
- set paragon cluster mail-server
- set paragon cluster nodes
- set paragon cluster ntp
- set paragon cluster papi
- set paragon cluster victoria-metrics
- set paragon monitoring
- set system login
- play_arrow Troubleshooting Commands
- Troubleshoot Using the Paragon Shell CLI Commands
- request support information
- request paragon troubleshooting information
- request paragon debug
- request paragon debug get-tsdb-data
- request paragon debug insights-kafka-data
- request paragon debug kafka
- request paragon debug logs
- request paragon debug logs namespace
- request paragon debug postgres
- request paragon debug redis
- play_arrow Service Orchestration
- About the Service Orchestration cMGD CLI
- set foghorn:core org-id
- set service design default version
- show service order status
- show service order as-json
- show service order as-yaml
- show service designs
- show device dependant configuration
- show insights configuration
- show configuration foghorn:customers
- request service project add
- request service orders sync
- request network resources load
- request service order upload
- request service order place
- request service order modify
- request service order delete
- request service order submit
- request service order provision
- request service design install
- request service design uninstall
-
Test Agents Overview
Active Assurance uses Test Agents, which is a software that is installed on your network device and it acts as a measurement point in your network. These Test Agents are deployed at strategic locations in your network to evaluate the quality of your network by collecting metric data for pre-configured key performance indicators (KPIs). Test Agents generate, receive, and analyze network traffic and therefore enable you to continuously view and monitor both real-time and aggregated result metrics.
All Test Agents are controlled and updated remotely through Paragon Automation GUI.
Test Agents can be installed on Junos OS Evolved routers, x86 hardware, or on virtual machines through docker container.
For ACX7000 series routers, which uses Junos OS Evolved, the Test Agents can either be run as a docker container, or, the Test Agent is automatically installed during the onboarding process. For ACX7000 series routers, you can also use the Real-Time Performance Monitoring (RPM) functionality to generate traffic and collect the metrics that help to analyze the network's behavior.
For MX and PTX series routers, you can use the Real-Time Performance Monitoring (RPM) functionality to generate traffic and collect the metrics that help to analyze the network's behavior. See Monitoring Traffic Using Real-Time Performance Monitoring (RPM).
For any other x86 hardware or virtual machines (VMs), you need to manually install Test Agents. For information on installing Test Agents, see Install Test Agent Application.
You can also use APIs to create, install, and uninstall test agents in Paragon Automation. See API Reference Guide.
The Test Agents in your network are listed on the Test Agents page (Inventory > Active Assurance). For more information on the Test Agents page, see About the Test Agents Page.
How Test Agents Measure Metrics
Figure 1 illustrates the relationship between a Test Agent plug-in, measurements, tasks, and streams.

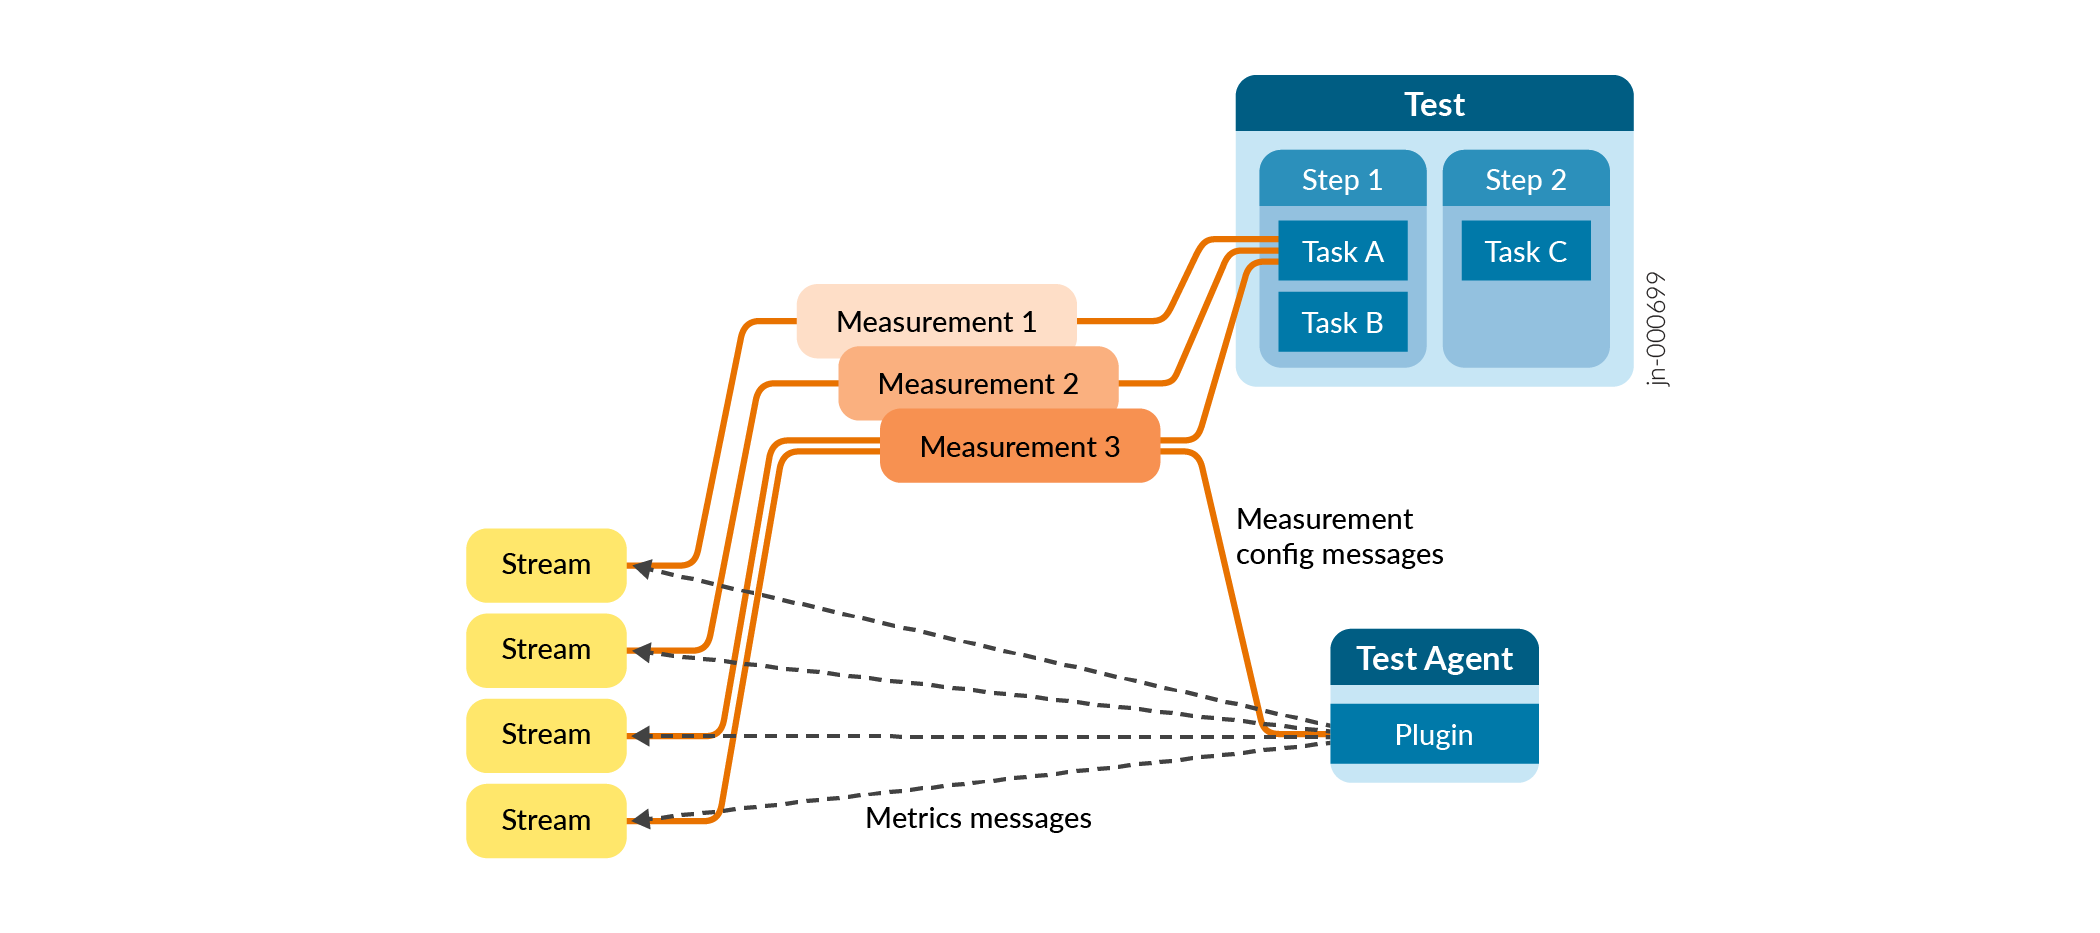
Paragon Automation leverages the capability of monitoring and testing the network's data plane by generating synthetic traffic using Test Agents or devices deployed in the network. Test Agents are configured to run a set of Measurements as defined by the Tests and Monitors.
Paragon Automation contains a set of features to produce Measurements in the network's data plane in the form of plugins (For example, Ping, HTTP, and so on). When you configure a Measurement using the Paragon Automation GUI or REST APIs, Paragon Automation configures the Test Agent to download the plugin and pushes the configuration to Test Agent.
While configuring a Measurement, you can also set evaluation criteria. The evaluation criteria contain thresholds for the individual metrics. Paragon Automation uses the thresholds, which you have defined, to determine the network's behavior. If the threshold is violated, then Paragon Automation generates events.
When the Measurement starts, the remote host is pinged. A Measurement produces one or more Streams. The Stream contains the measured metrics (also known as KPIs). Paragon Automation evaluates these metrics against the threshold set in the evaluation criteria. For example, you can set that the threshold for delay to be below 10 milliseconds. If such a threshold is violated an event is raised with the configured severity.
Test Agents send streams from the source device—on which you have installed the Test Agent—to a remote endpoint. The remote endpoint can be a remote Test Agent, Web servers, DNS servers, or a known device in the public cloud provider's network.
To summarize, you create a Test or a Monitor using the Paragon Automation GUI or REST API to configure the plugins, the metrics, the evaluation criteria per metric, and so on. When you run the Test or the Monitor, Test Agent starts downloading the plugin and starts the measurement and their associated Streams.
For information on Active Assurance Terminologies, see Active Assurance Terminologies.
For information on creating Tests and Monitors, see Create a Test and Create a Monitor.