ON THIS PAGE
WAN SLEs
Use the WAN Service-Level Experiences (SLEs) to assess user-impacting factors such as WAN Edge health, WAN link health, and application health.
Overview
- Finding the WAN SLEs Dashboard
- SLE Filter Buttons
- Video: WAN Assurance Overview
- Video: Troubleshoot WAN Issues with SLEs
Finding the WAN SLEs Dashboard
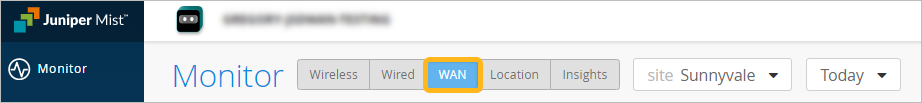
To find the WAN SLEs dashboard, select Monitor > Service Levels from the left menu, and then click the WAN button.
The buttons appear only if you have the required subscriptions. See Requirements.
SLE Filter Buttons
-
Use the buttons on the left to show Success Rate or Values.
Use the Show Custom Appsbutton to show or hide your custom applications.
In the example below, the button is in the Off position, so all applications are included. If you drag the button to the On position, you'll see only your custom applications.

Video: WAN Assurance Overview
Juniper MIST WAN Assurance delivers insights and troubleshooting driven by MIST AI into the WAN, exposing many factors that impact user experience across your distributed enterprise. WAN Assurance complements your SD-WAN deployment and is focused on delivering the best user experience, from client to the cloud. SD-WAN solutions dynamically optimize traffic flows across the WAN based on an SLA policy for your applications.
However, these SLAs are set once at the beginning and don't account for changes over time that impact the WAN, rendering these static SLAs ineffective. In contrast, WAN Assurance is centered around the concept of the user minute, which is represented by Service Level Expectations, or SLE for short. If a user is experiencing a poor Microsoft Teams call, then the user is having bad user minutes.
Let's see what this looks like in a Juniper Cloud instance. From the monitor view, we select WAN, choosing from the time frame over the last seven days, and we see three SLEs for the WAN. The first one is Gateway Health, which accounts for the overall state of the SRX WAN edge device itself.
We track CPU, memory, temperature, fan, and power, all of which account for the overall device health. WAN Link Health represents the overall state of the WAN connections to the device. It tracks IPsec status, routing, and the WAN interfaces.
Thirdly, there's App Experience, which accounts for factors that impact application performance based on traffic. This SLE tracks latency, jitter, packet loss, and round-trip time. Together, these three SLEs describe how WAN performance is impacting overall user experience.
Let's ask Marvis what's happening with Microsoft Teams. By simply typing, obvious Teams call is bad, Marvis begins a root cause analysis. Marvis first responds by listing five Teams sessions from the past 24 hours.
We select the troublesome session from the list. Marvis quickly responds that the bad Teams experience was due to high latency on the Gateway SRX. Marvis also shows where the issue is in a simplified network diagram.
It displays how Abhi's MacBook is connected wirelessly to an access point, which in turn is connected to an EX access switch, and finally, the traffic is sent to the WAN via the SRX gateway. Marvis visually shows how each of these points in the network are impacting user experience. We see the AP and the gateway devices may be impacting experience.
We click the AP first. There is some non-WiFi interference in the 5GIG band that could be impacting users. Next, we select the gateway device.
We see it has high latency in one of its WAN links due to slow response from the application server. Marvis makes it that easy to determine root cause analysis of issues impacting user experience. By correlating across Wi-Fi, wired, and WAN, we are able to drive a better user experience within our sites, out of our sites, from client to cloud.
Video: Troubleshoot WAN Issues with SLEs
Looking at our recently deployed Cupertino site, we can see that it is not meeting Service Levels. Clicking into the site, we get a closer look at the SLEs. They are broken down into three important health categories that play a role in user experience: the WAN Edge device health, the health of WAN links and paths, and the health of applications themselves. Each SLE is broken down into a simple unit of measure for the user experience called a User Minute.
Simply put, this is telling us what our user experiences on the WAN are per user, per minute. Behind these seemingly simple measurements are the complex and powerful AI models of the Mist Cloud, fed by rich telemetry from the Session Smart Network. For each SLE, we get a breakdown of the root cause of the issues identified. Whenever user experience is poor on the WAN, Mist not only tells us the root cause, but also tells us what was affected, such as the impacted applications, users, links, paths and devices.
WAN SLE Blocks
As shown in the following example, each SLE block provides valuable information.
-
At the left, you see that this SLE has an 85 percent success rate. If you select the Value filter button, you'll see a number instead.
At the center, the timeline shows variations across the time period. You can hover your mouse pointer over any point to see the exact time and SLE outcome.
At the right, the classifiers show the percentage of the issues that were attributed to each root cause. In this example, 100 percent of the issues were attributed to Jitter.

-
If you click a classifier, you'll see more information on the Root Cause Analysis page. Most classifiers have sub-classifiers for greater insight into the exact causes. The Root Cause Analysis page also provides additional details about the scope and impact of the issues.
See the following table for more information about the WAN SLEs and classifiers.
| SLEs | SLE Descriptions | Classifiers | Classifier Descriptions |
|---|---|---|---|
| WAN Edge Health |
Juniper Mist monitors the user minutes when the health or performance of the WAN edge device is not optimal. Suboptimal health lowers the device's ability to pass traffic, directly affecting any clients connected to the device. |
WAN Edge Disconnected | Lost connectivity to the Juniper Mist cloud |
| System |
High system usage relative to capacity Sub-Classifiers:
|
||
| Table Capacity |
High number of table entries relative to capacity Sub-Classifiers:
|
||
| DHCP Pool |
High DHCP utilization relative to pool size Sub-Classifiers:
|
||
| WAN Link Health |
Juniper Mist monitors the user minutes when the WAN link's health meets or fails to meet the SLE threshold. Poor WAN link health lowers the device's ability to pass traffic, thus directly affecting any clients using that link. |
Network |
Network issues Sub-Classifiers:
|
| Interface |
Interface issues Sub-Classifiers:
|
||
| WAN Application Health |
Juniper Mist monitors the latency of WAN applications to identify applications that are performing sub-optimally. This SLE can help you to understand the end users’ experiences when accessing applications. For example, a weak network connection might give good user experiences for FTP or SMTP-based applications, but bad user experiences for VoIP applications. Performance metrics vary by device:
For fine-tuning, you can click the Settings button to select individual applications to include or exclude. |
Jitter |
Inconsistent packet transmit times |
| Latency |
Slow response time (lag) |
||
| Loss |
Packet loss |
||
| Application Services (SSR only) |
Issues such as slow responses to application requests, recurring disconnects, and insufficient bandwidth Sub-Classifiers:
|
||
| Gateway Bandwidth |
Juniper Mist evaluates the IPsec overlay that constitutes the SD-WAN. Use this SLE to determine if you need more WAN bandwidth on your site. |
Bandwidth Headroom |
Current usage exceeding the baseline, which is determined by the highest usage over the past 14 days If you’ve enabled automatic speed tests, these results also are incorporated into the Bandwidth Headroom classifier. In this case, the headroom threshold is based on maximum usage and the speed test results, if available. Speed tests occur if configured in your organization settings and if enabled in the WAN settings for the WAN Edge template, hub profile, or WAN Edge device. |
| Congestion Uplink (SRX Only) | High ratio of total transmitted bytes dropped (TX drops) to total packets transmitted (TX packets). |