Site Insights
Investigate issues affecting devices, clients, applications, and servers for your site.
Finding the Site Insights
Go to the Insights page, click the context menu at the top of the page, and then select the site that you want to view.
Site Events
Site events appear near the top of the Insights page when you've selected a site or an access point as the context.
Click an event to see a summary on the right side of the page.
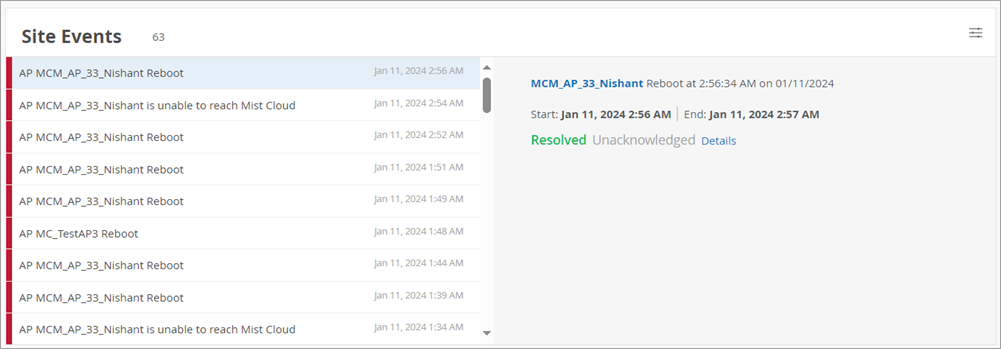
Other options:
-
Click the settings button in the top-right corner of the Site Events section to select an event type. For more information, see Site Event Types.
-
Device Link—For events involving APs, click the AP name to go to the Access Points page.
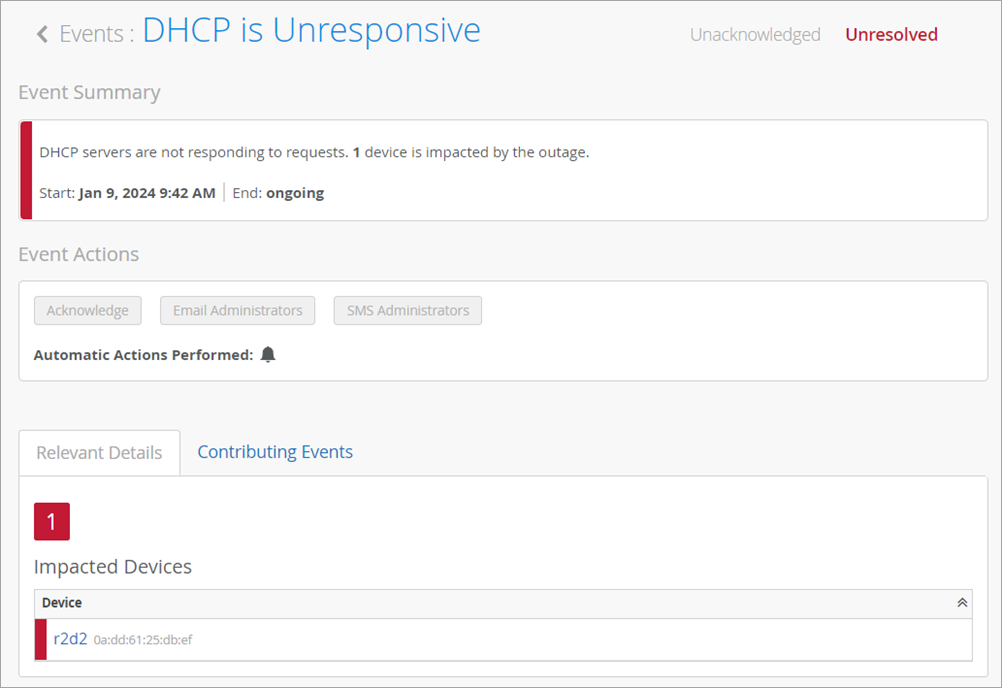
Details Link—Click Details to view full event details. The Events page lists the impacted devices and the contributing events. For certain events, an impact map might be available as well.
Here's an example of the event details page for a DHCP server event.
Site Event Types
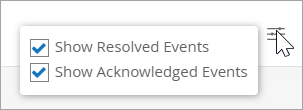
To select the events to include, click the settings button at the top-right corner of the Site Events section.

In the Site Filter pop-up window, select or clear the check boxes to show or hide the events based on their status: Resolved or Acknowledged.
Related Events and Information for Sites
When you select a site at the top of the Insights page, related events and information also appear. For help with these sections of the page, go to these topics:
Current Values for Sites
The Current Values section appears toward the bottom of the Insights page.
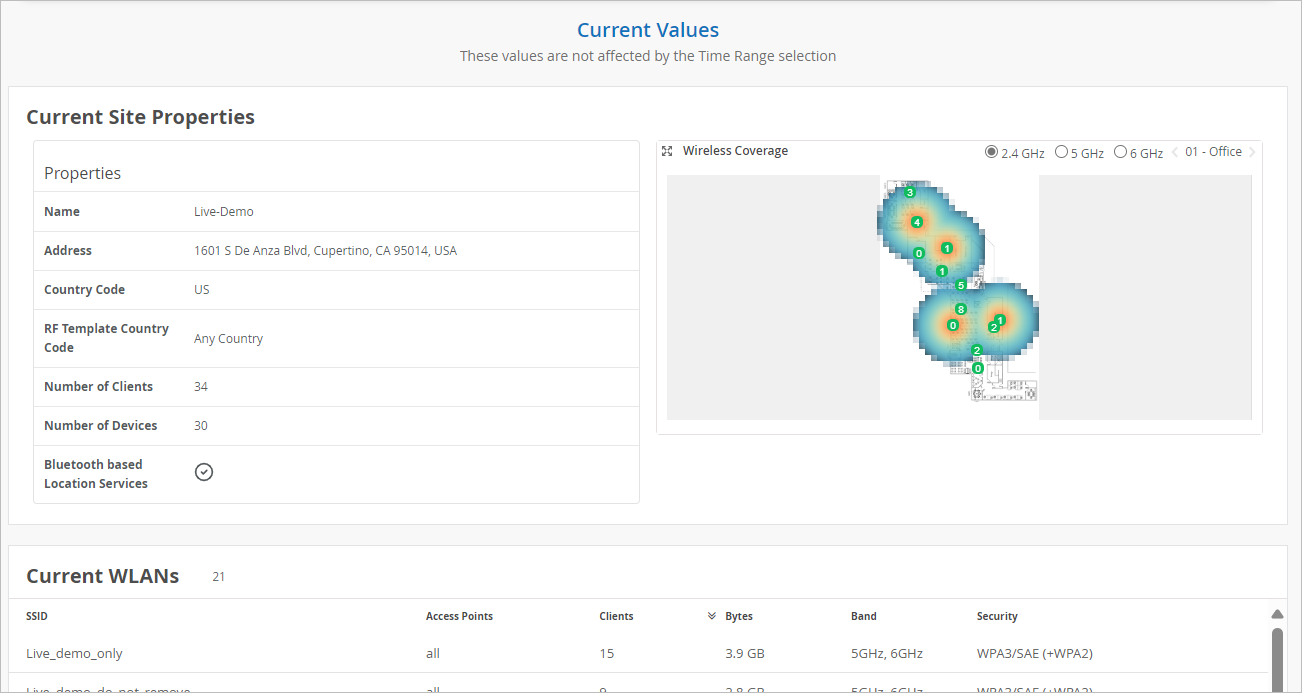
The values in this section don't change when you adjust the time range selection at the top of the page.
When you select a site as the context, this section includes:
-
Current Site Properties—Site name, address, number of clients and devices, and status of Bluetooth-based location services. Also provides a visualization of the wireless coverage at the site. Use the buttons above the visualization to select the radio band to view.
-
Current WLANs—SSID, number of APs and clients, bytes, bands, and security type.
-
Access Points—Status (connected, rebooting, disconnected), MAC address, uptime, number of clients, bytes, LLDP name and port.
-
Use the tabs at the top of this section to show all APs or currently connected APs.
-
Click the name of an AP to reload the Insights page with the data for that AP.
-
-
Clients—MAC address, IP address, device type, protocol, band, RSSI, SSID, SNR, bytes, and connected time. Click a hyperlink to reload the Insights page to show only the data for that client.
-
Use the tabs at the top of this section to show all clients or connected clients.
-
Click the name of a client to reload the Insights page with the data for that client.
-
-
Wired Switches—IP address, number of APs and clients, model, firmware version, and total power draw.