


- play_arrow Get Started with AI Ops
- play_arrow Insights
- play_arrow Alerts
- play_arrow Get Started with Marvis
- play_arrow Marvis Actions
- Marvis Actions Overview
- Subscription Requirements for Marvis Actions
- Layer 1 Actions
- Connectivity Actions
- AP Actions
- Switch Actions
- WAN Edge Actions
- Data Center/Application Actions
- Other Marvis Actions
- Marvis Actions: An Insight into Backend Operations
- Anomaly Detection Event Card
- AP Deployment Assessment
- play_arrow Marvis Minis
- play_arrow Conversations and Queries
- play_arrow Marvis Client
- play_arrow Marvis App for Teams
- play_arrow Troubleshooting Examples
Wired SLEs Dashboard
Get started using the wired service-level experience (SLE) dashboard to assess the service levels for user-impacting factors such as throughput, connectivity, and switch health.
Juniper Mist™ cloud continuously collects network telemetry data and uses machine learning to analyze the end-user experience. You can access this information through the Juniper Mist wired service-level expectation (SLE) dashboards, which help you assess the network's user experience and resolve any issues proactively. The wired SLE dashboards show the user experience of the wired clients on your network at any given point in time. You can use these interactive dashboards to measure and manage your network proactively by identifying any user pain points before they become too big of an issue.
Finding the Wired SLEs Dashboard
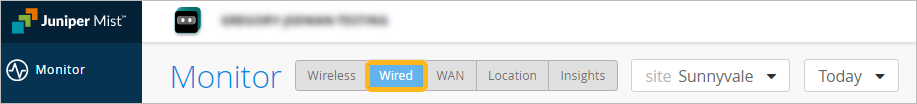
To find the Wired SLEs dashboard, select Monitor > Service Levels from the left menu, and then click the Wired button.
The buttons appear only if you have the required subscriptions. For information about these requirements, see the Juniper Mist AI-Native Operations Guide.
Wired Assurance: Day 2 - Wired Service Level Expectations (SLEs) Video Overview
Video 1: Wired Assurance: Day 2 - Wired Service Level Expectat...
Using the Wired SLE Dashboard
For a general introduction to SLEs, see Service-Level Expectations (SLE).
For help interpreting the wired SLEs and classifiers, explore the other Wired SLE topics in this chapter.
