Anomaly Detection Event Card
Use the Anomaly Detection Event Card for additional information about issues and actions.
The Anomaly Detection Event Card provides a more detailed diagnosis about the anomalies for some of the actions that Marvis suggests. The Event Card is available for these types of failures:
-
Authentication Failures
-
Domain Name System (DNS) Failures
-
Dynamic Host Control Protocol (DHCP) Failures
Watch this video to see an example.
Marvis, our AI-powered virtual network assistant, employs an actions framework to automatically identify network problems and anomalies that are likely impacting user experience. This helps you to significantly reduce mean time to resolution. Marvis can detect switched traffic anomalies, such as traffic storms or abnormal high TxRx count, with respect to broadcast, unknown, unicast, or multicast traffic.
It uses our third generation of algorithms, including long short-term memory, or LSTM for short, to boost efficacy and eliminate false positives. Visit the link below to learn more.
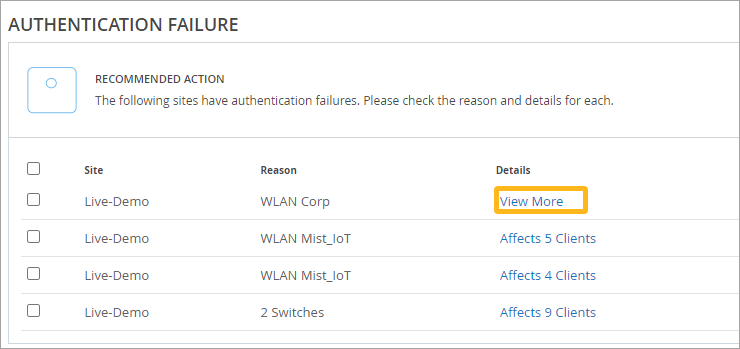
If an event card is available, you'll see a View More link, as shown in this example.

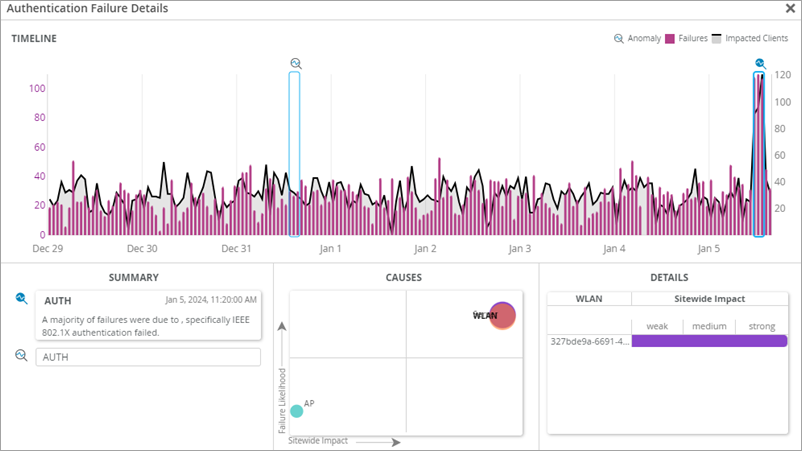
When you click View More, the card appears in a pop-up window. Here's a sample event card for an authentication failure.

The event card includes these sections:
-
Timeline—The number of failure events at each point in time. Marvis highlights the anomalies with a magnifying glass icon. Click the icon to select an anomaly and view the details.
-
Summary—A description of each anomaly and the most likely cause. It also indicates if the clients mostly failed on a certain radio band, access point (AP), or wireless LAN (WLAN). You can select different anomalies by clicking their titles.
-
Causes—A graphical representation of the relative impact of the AP, WLAN, and radio band. The size of the circle indicates the correlation to failure, and the positions on the graph show the Failure Likelihood and the sitewide impact. You can click a device to display the information in the Details section.
-
Details—A list of the impacted devices. The details change when you click a device type in the Causes graph. For example, click the AP icon in the graph to see the details for the APs.
