- play_arrow Introduction
- play_arrow Dashboard
- play_arrow SRX Device Management
- play_arrow Devices
- Devices Overview
- Add Devices
- Enroll SRX Series Firewalls from ATP Cloud to Juniper Security Director Cloud
- Disenroll SRX Series Firewall from ATP Cloud
- Device Subscriptions
- Add Licenses
- Import Device Certificates
- Configure Security Logs
- Configuration Versions
- Out-of-Band Changes
- Resolve Out-of-Band Changes
- Resynchronize Devices
- Upgrade Devices
- Reboot Devices
- Delete Devices
- play_arrow Device Groups
- play_arrow Preprovision Profiles
- play_arrow Configuration Templates
- play_arrow Images
- play_arrow Security Packages
-
- play_arrow SRX Security Policy
- play_arrow SRX Security Policies
- play_arrow SRX Security Policy Rules
- Security Policy Rules Overview
- Security Policy Rule Analysis Overview
- Add and Manage Security Policy Rules
- Analyze Security Policy Rules
- Edit, Clone, and Delete a Security Policy Rule
- Reorder a Security Policy Rule
- Configure Default Rule Option
- Select a Security Policy Rule Source
- Select a Security Policy Rule Destination
- Select Applications and Services
- Common Operations on a Security Policy Rule
- Add SRX Policy Rules to Secure Edge Policy (From SRX Policy Page)
- play_arrow SRX Security Policy Versions
- play_arrow Device View
-
- play_arrow SRX Security Subsciptions
- play_arrow IPS Profiles
- play_arrow IPS Signatures
- play_arrow Content Security
- play_arrow Content Security Profiles
- play_arrow Web Filtering Profiles
- play_arrow Antivirus Profiles
- play_arrow Antispam Profiles
- play_arrow Content Filtering Profiles
- play_arrow Content Filtering Policies (New)
- play_arrow Decrypt Profiles
- play_arrow SecIntel
- play_arrow SecIntel Profiles
- play_arrow SecIntel Profile Groups
- play_arrow Anti-Malware
- play_arrow Secure Web Proxy
- play_arrow Flow-Based Antivirus
- play_arrow ICAP Redirect Profile
- play_arrow Metadata Streaming Policy
- Security Metadata Streaming Policies Overview
- Create and Manage Metadata Streaming Profiles
- Create and Manage Metadata Streaming Profiles to Detect all DNS Threats
- Create and Manage Metadata Streaming Profiles to Detect DGA-Based Threats
- Create and Manage Metadata Streaming Profiles to Detect DNS Tunnels
- Create and Manage Metadata Streaming Profiles to Detect all HTTP Threats
- Create and Manage Metadata Streaming Profiles to Detect Command-and-Control (C2) Communications
- Edit, Clone, or Delete Metadata Streaming Profile
- Create and Manage Metadata Streaming Rules
- Edit or Delete Metadata Streaming Rule
- Deploy Metadata Streaming Policy
- Import Metadata Streaming Policy and DNS Cache
- play_arrow DNS Filter
-
- play_arrow SRX IPSec VPN
- play_arrow IPsec VPNs
- IPsec VPN Overview
- Understanding IPsec VPN Modes
- Understanding IPsec VPN Routing
- Understanding IKE Authentication
- IPsec VPN Global Settings
- Create a Policy-Based Site-to-Site VPN
- Create a Route-Based Site-to-Site VPN
- Create a Hub-and-Spoke (Establishment All Peers) VPN
- Create a Hub-and-Spoke (Establishment by Spokes) VPN
- Create a Hub-and-Spoke Auto Discovery VPN
- Create a Remote Access VPN—Juniper Secure Connect
- Importing IPsec VPNs
- Deploy an IPsec VPN
- Modify IPsec VPN Settings
- Delete an IPsec VPN
- play_arrow VPN Profiles
- play_arrow Extranet Devices
-
- play_arrow SRX NAT
- play_arrow NAT Policies
- play_arrow NAT Pools
- Devices with NAT Policies
-
- play_arrow SRX Identity
- play_arrow JIMS
- play_arrow Active Directory
- play_arrow Access profile
- play_arrow Address Pools
-
- play_arrow Secure Edge Service Management
- Juniper Secure Edge Overview
- Service Locations Overview
- Create and Manage Service Locations
- Edit and Delete Service Locations
- Sites Overview
- Create and Manage Sites
- Create and Manage Bulk Sites
- Edit and Delete Sites
- About the IPsec Profiles Page
- Create and Manage IPsec Profiles
- Edit or Delete an IPsec Profile
- External Probe Overview
- play_arrow Secure Edge Security Policy
- Secure Edge Policy Overview
- Add and Manage Secure Edge Policy Rules
- Edit, Clone, and Delete a Secure Edge Policy Rule
- Reorder a Security Policy Rule
- Select a Secure Edge Policy Source
- Select a Secure Edge Policy Destination
- Select Applications and Services
- Common Operations on a Secure Edge Policy
- Deploy Secure Edge Policies
- Add SRX Policy Rules to Secure Edge Policy (From Secure Edge Policy Page)
- play_arrow Secure Edge Security Subscriptions
- IPS Policies Overview
- IPS Policies Overview
- Create and Manage IPS Rules
- Edit, Clone, and Delete IPS Rules
- Create and Manage Exempt Rules
- Edit, Clone, and Delete Exempt Rule
- Web Filtering Profiles Overview
- Web Filtering Profiles Overview
- Create and Manage Web Filtering Profiles
- Edit, Clone, and Delete a Web Filtering Profile
- CASB Overview
- CASB Profiles Overview
- Create and Manage CASB Profiles
- Edit and Delete a CASB Profile
- CASB Rules Overview
- Add and Manage CASB Profile Rules
- Edit and Delete a CASB Rule
- Application Instances Overview
- Create and Manage Application Instances
- Edit and Delete an Application Instance
- Application Tagging Overview
- Content Filtering Policies Overview
- Content Filtering Policies Overview
- Create and Manage Content Filtering Policies
- Add and Manage Content Filtering Policy Rules
- Edit and Delete a Content Filtering Policy
- Edit, Clone, and Delete a Content Filtering Policy Rule
- SecIntel Profiles Overview
- SecIntel Profiles Overview
- Create and Manage Command and Control Profiles
- Create and Manage DNS Profiles
- Create and Manage Infected Hosts Profiles
- Edit, Clone, and Delete SecIntel Profile
- SecIntel Profile Groups Overview
- Create and Manage SecIntel Profile Groups
- Edit, Clone, and Delete SecIntel Profile Group
- Anti-malware Profiles Overview
- About Anti-malware Profiles
- Create and Manage Anti-malware Profiles
- Edit, Clone, and Delete Anti-malware Profile
- Create a DNS Security Profile
- Create an Encrypted Traffic Insights Profile
- play_arrow Secure Edge Service Administration
- Certificate Management Overview
- Certificate Management Overview
- Generate and Manage Certificates
- Upload and Download a Certificate
- Regenerate and Delete a Certificate
- Add Juniper Clouds Root CA Certificate on Microsoft Windows
- Add Juniper Clouds Root CA Certificate on MacOS
- Add Juniper Clouds Root CA Certificate in Google Chrome
- Add Juniper Clouds Root CA Certificate in Mozilla Firefox
- Proxy Auto Configuration Files Overview
- Proxy Auto Configuration (PAC) Files Overview
- Edit, Clone, and Delete a Proxy Auto Configuration File
- Distribute a Proxy Auto Configuration File URL to Web Browsers
- Manually Add a Proxy Auto Configuration File URL to a Web Browser
- Configure an Explicit Proxy Profile
- Decrypt Profiles Overview
- Decrypt Profiles Overview
- Create and Manage Decrypt Profiles
- Edit, Clone, and Delete a Decrypt Profile
- play_arrow Secure Edge Identity
- End User Authentication Overview
- About the End User Authentication Page
- Add and Manage End User Profiles
- Create a SAML Profile
- Create an LDAPS Profile
- Manage the Hosted Database
- Edit and Delete an End User Profile
- Add and Manage Groups
- Edit and Delete a Group
- Juniper Identity Management Service Overview
- Juniper Identity Management Service Overview
- JIMS Collector Onboarding Overview
- Onboard JIMS Collector
- Create JIMS Collector Service Accounts
- Install JIMS Collector
- Configure JIMS Collector to Get Information from the Directory Service
- Configure JIMS Collector to Get Microsoft Event Logs
- Configure JIMS Collector to Probe Unknown IP Addresses
- Delete JIMS Collector
- Authentication Settings Overview
- Configure the Authentication Frequency
- play_arrow Secure Edge CASB and DLP
- play_arrow Shared Services Firewall Policies
- play_arrow Rule Options
- play_arrow Redirect Profiles
-
- play_arrow Shared Services Objects
- play_arrow Addresses
- play_arrow GeoIP
- play_arrow Services
- play_arrow Applications
- play_arrow Schedules
- play_arrow URL Patterns
- play_arrow URL Categories
- play_arrow SSL Initiation Profile
-
- play_arrow Shared Services Advanced Threat Prevention
- Enroll an SRX Series Firewall using Juniper ATP Cloud Web Portal
- Remove an SRX Series Firewall From Juniper Advanced Threat Prevention Cloud
- Search for SRX Series Firewalls Within Juniper Advanced Threat Prevention Cloud
- Device Information
- File Inspection Profiles Overview
- Create File Inspection Profiles
- Email Management Overview
- Configure SMTP Email Management
- Configure IMAP Email Management
- Adaptive Threat Profiling Overview
- Create an Adaptive Threat Profiling Feed
- Allowlists Overview
- Create Allowlists
- Blocklists Overview
- Create Blocklists
- SecIntel Feeds Overview
- Configure DAG Filter
- Global Configuration for Infected Hosts
- Enable Logging
- Configure Threat Intelligence Sharing
- Configure Trusted Proxy Servers
- Configure Webhook
- play_arrow Administration
- play_arrow Subscriptions
- play_arrow Users & Roles
- play_arrow Single Sign-On Configuration
- play_arrow Two-Factor Authentication
- play_arrow Audit Logs
- play_arrow Service Updates
- play_arrow Jobs
- play_arrow Data Management
- play_arrow Log Streaming
- play_arrow URL Recategorization
- play_arrow API Security
- play_arrow Organization
- play_arrow ATP Mapping
- play_arrow ATP Audit Logs
- play_arrow ATP Application Tokens
-
Tunnel Status Overview
Juniper Security Director Cloud displays the status of IPsec VPN tunnels in a dashboard and tabular format. The number of tunnels for each VPN depends on the type of VPN, such as site-to-site, hub-and-spoke, or remote access VPN. Juniper Security Director Cloud supports a route-based tunnel mode. You can view the tunnel status of IPsec VPNs configured on devices that are managed by Juniper Security Director Cloud. The tunnel status micro-service runs at specified intervals and updates the status of the IPsec VPN tunnels as up or down every 10 minutes.
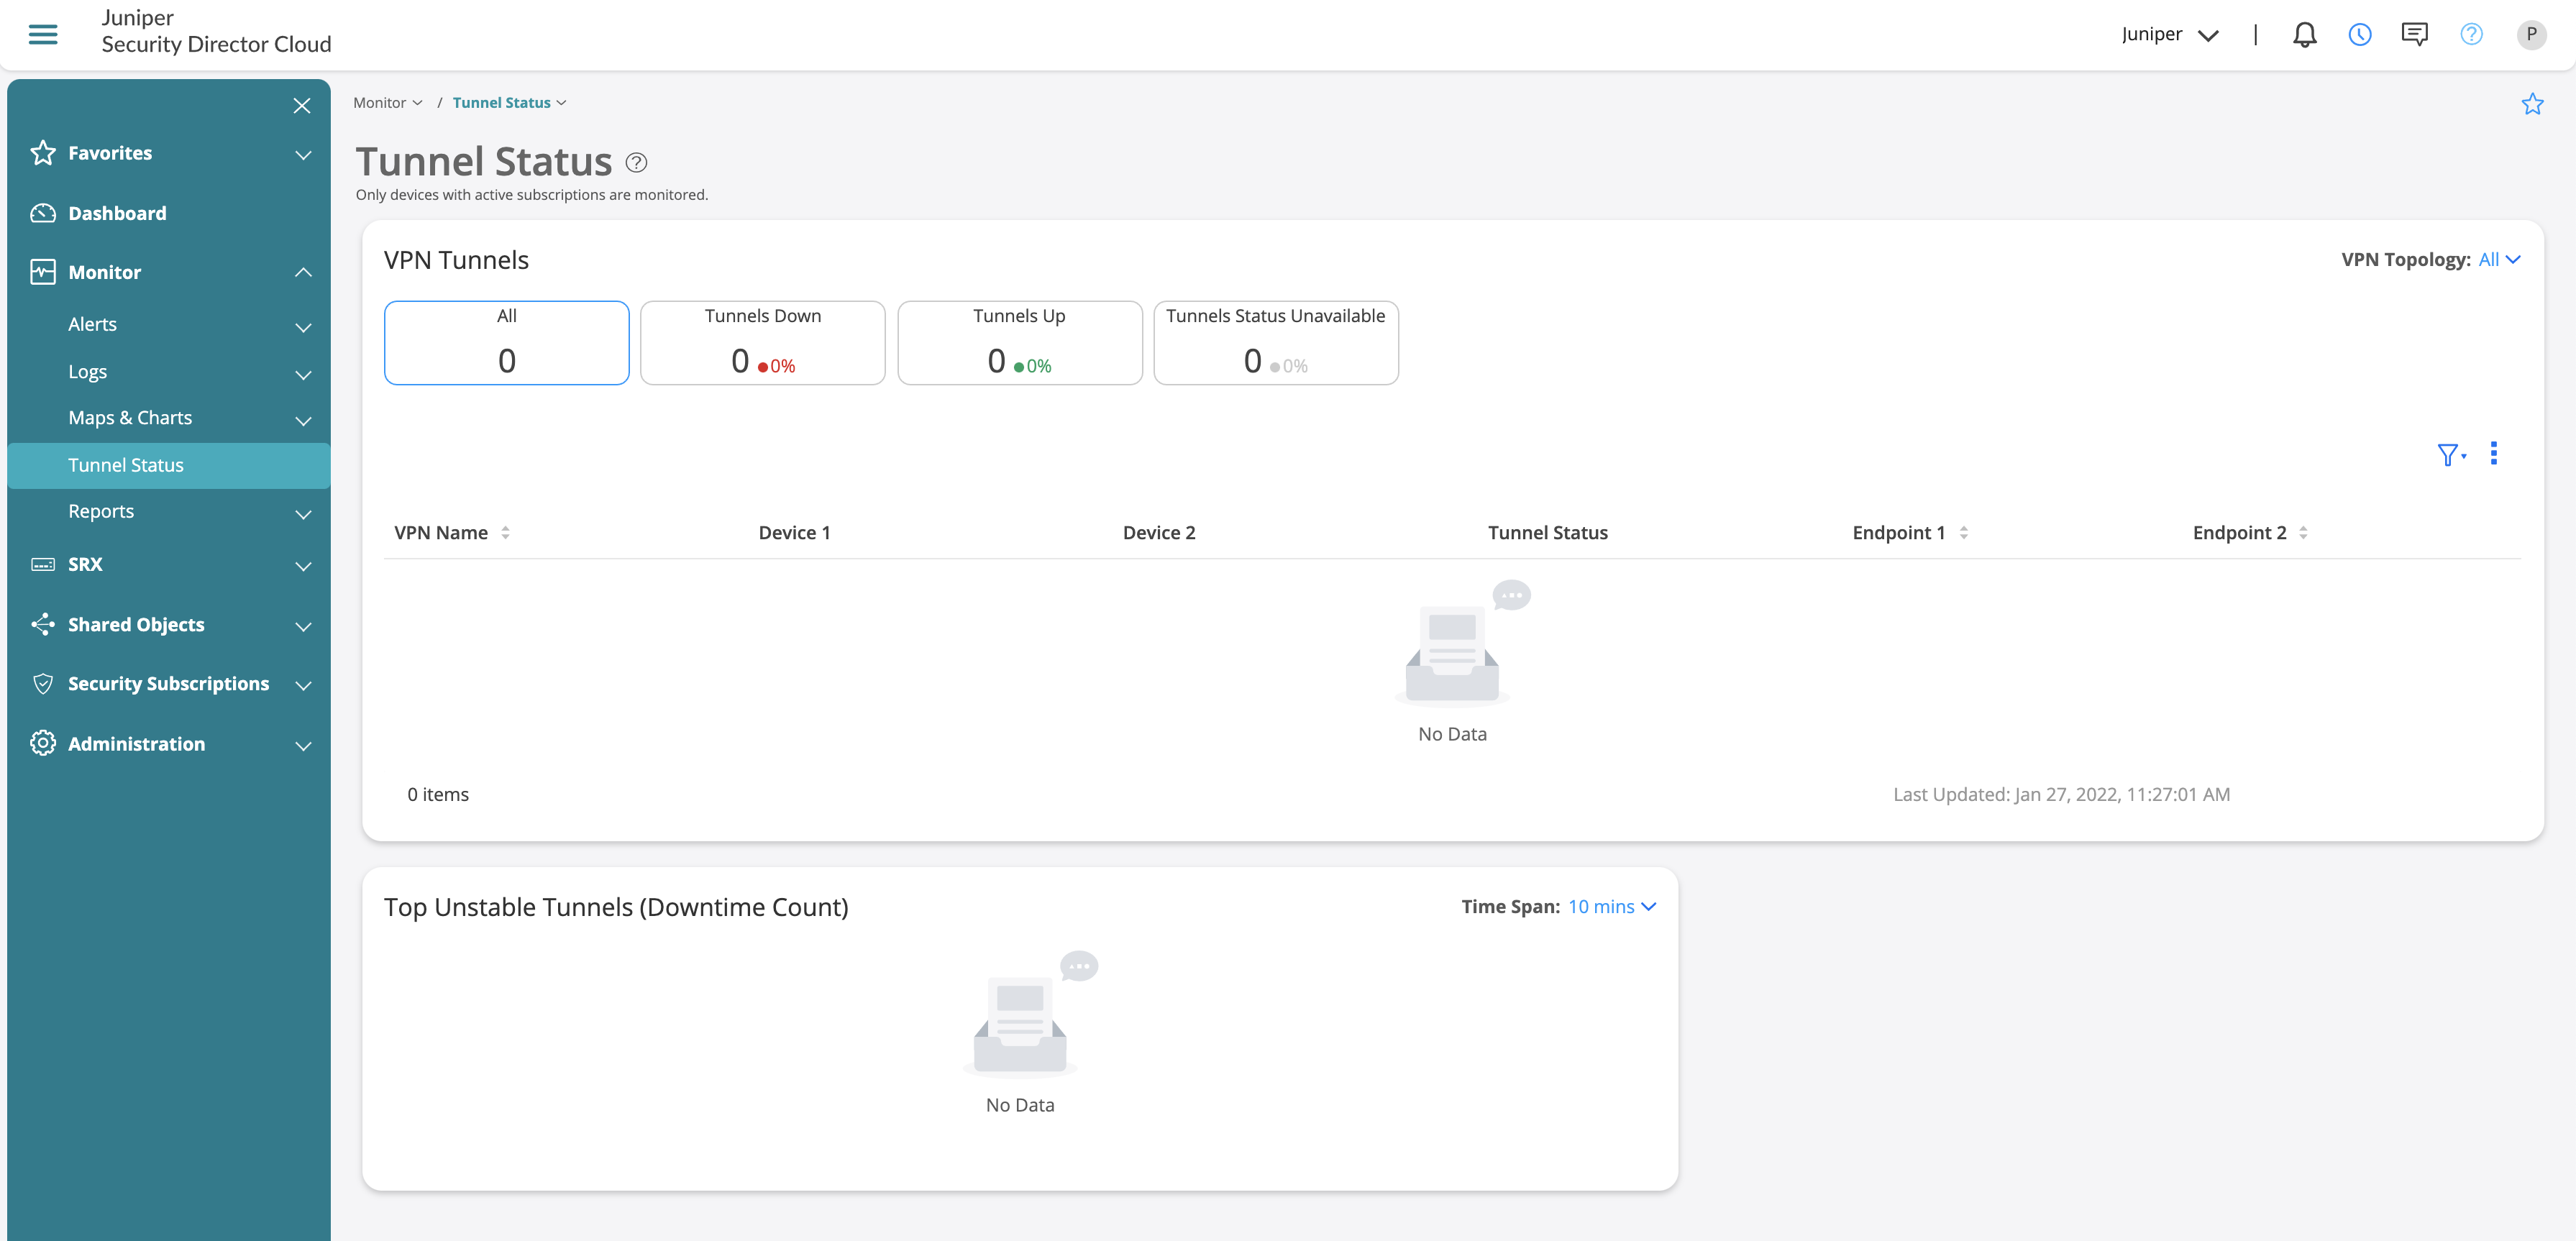
Figure 1 shows the VPN Tunnels dashboard for the VPNs, the VPN tunnels, and the VPN tunnel downtime count.
The VPN Tunnels dashboard contains widgets that display the total number of IPsec VPN tunnels, the number of VPN tunnels that are up, the number of tunnels that are down, and the number of tunnels whose status is unavailable. You can click the widgets to filter the VPN list and display all the tunnels, only tunnels that are up, or only tunnels that are down. You can also filter the VPN list based on the VPN topology—site-to-site and hub-and-spoke. You can also use the filter to specify custom search parameters and display the VPN list based on the VPN name and endpoints connected with the VPN tunnels.
The Top Unstable Tunnels dashboard displays the top five unstable VPN tunnels that were down for a specific period along with the downtime count. You can select a time span from 10 minutes to 30 days. The list of tunnels varies depending on the selected time span. Based on the selected duration, a time range and graph are displayed with the tunnel status data.


