Tunnel Status Overview
Juniper Security Director Cloud displays the status of IPsec VPN tunnels in a dashboard and tabular format. The number of tunnels for each VPN depends on the type of VPN, such as site-to-site, hub-and-spoke, or remote access VPN. Juniper Security Director Cloud supports a route-based tunnel mode. You can view the tunnel status of IPsec VPNs configured on devices that are managed by Juniper Security Director Cloud. The tunnel status micro-service runs at specified intervals and updates the status of the IPsec VPN tunnels as up or down every 10 minutes.
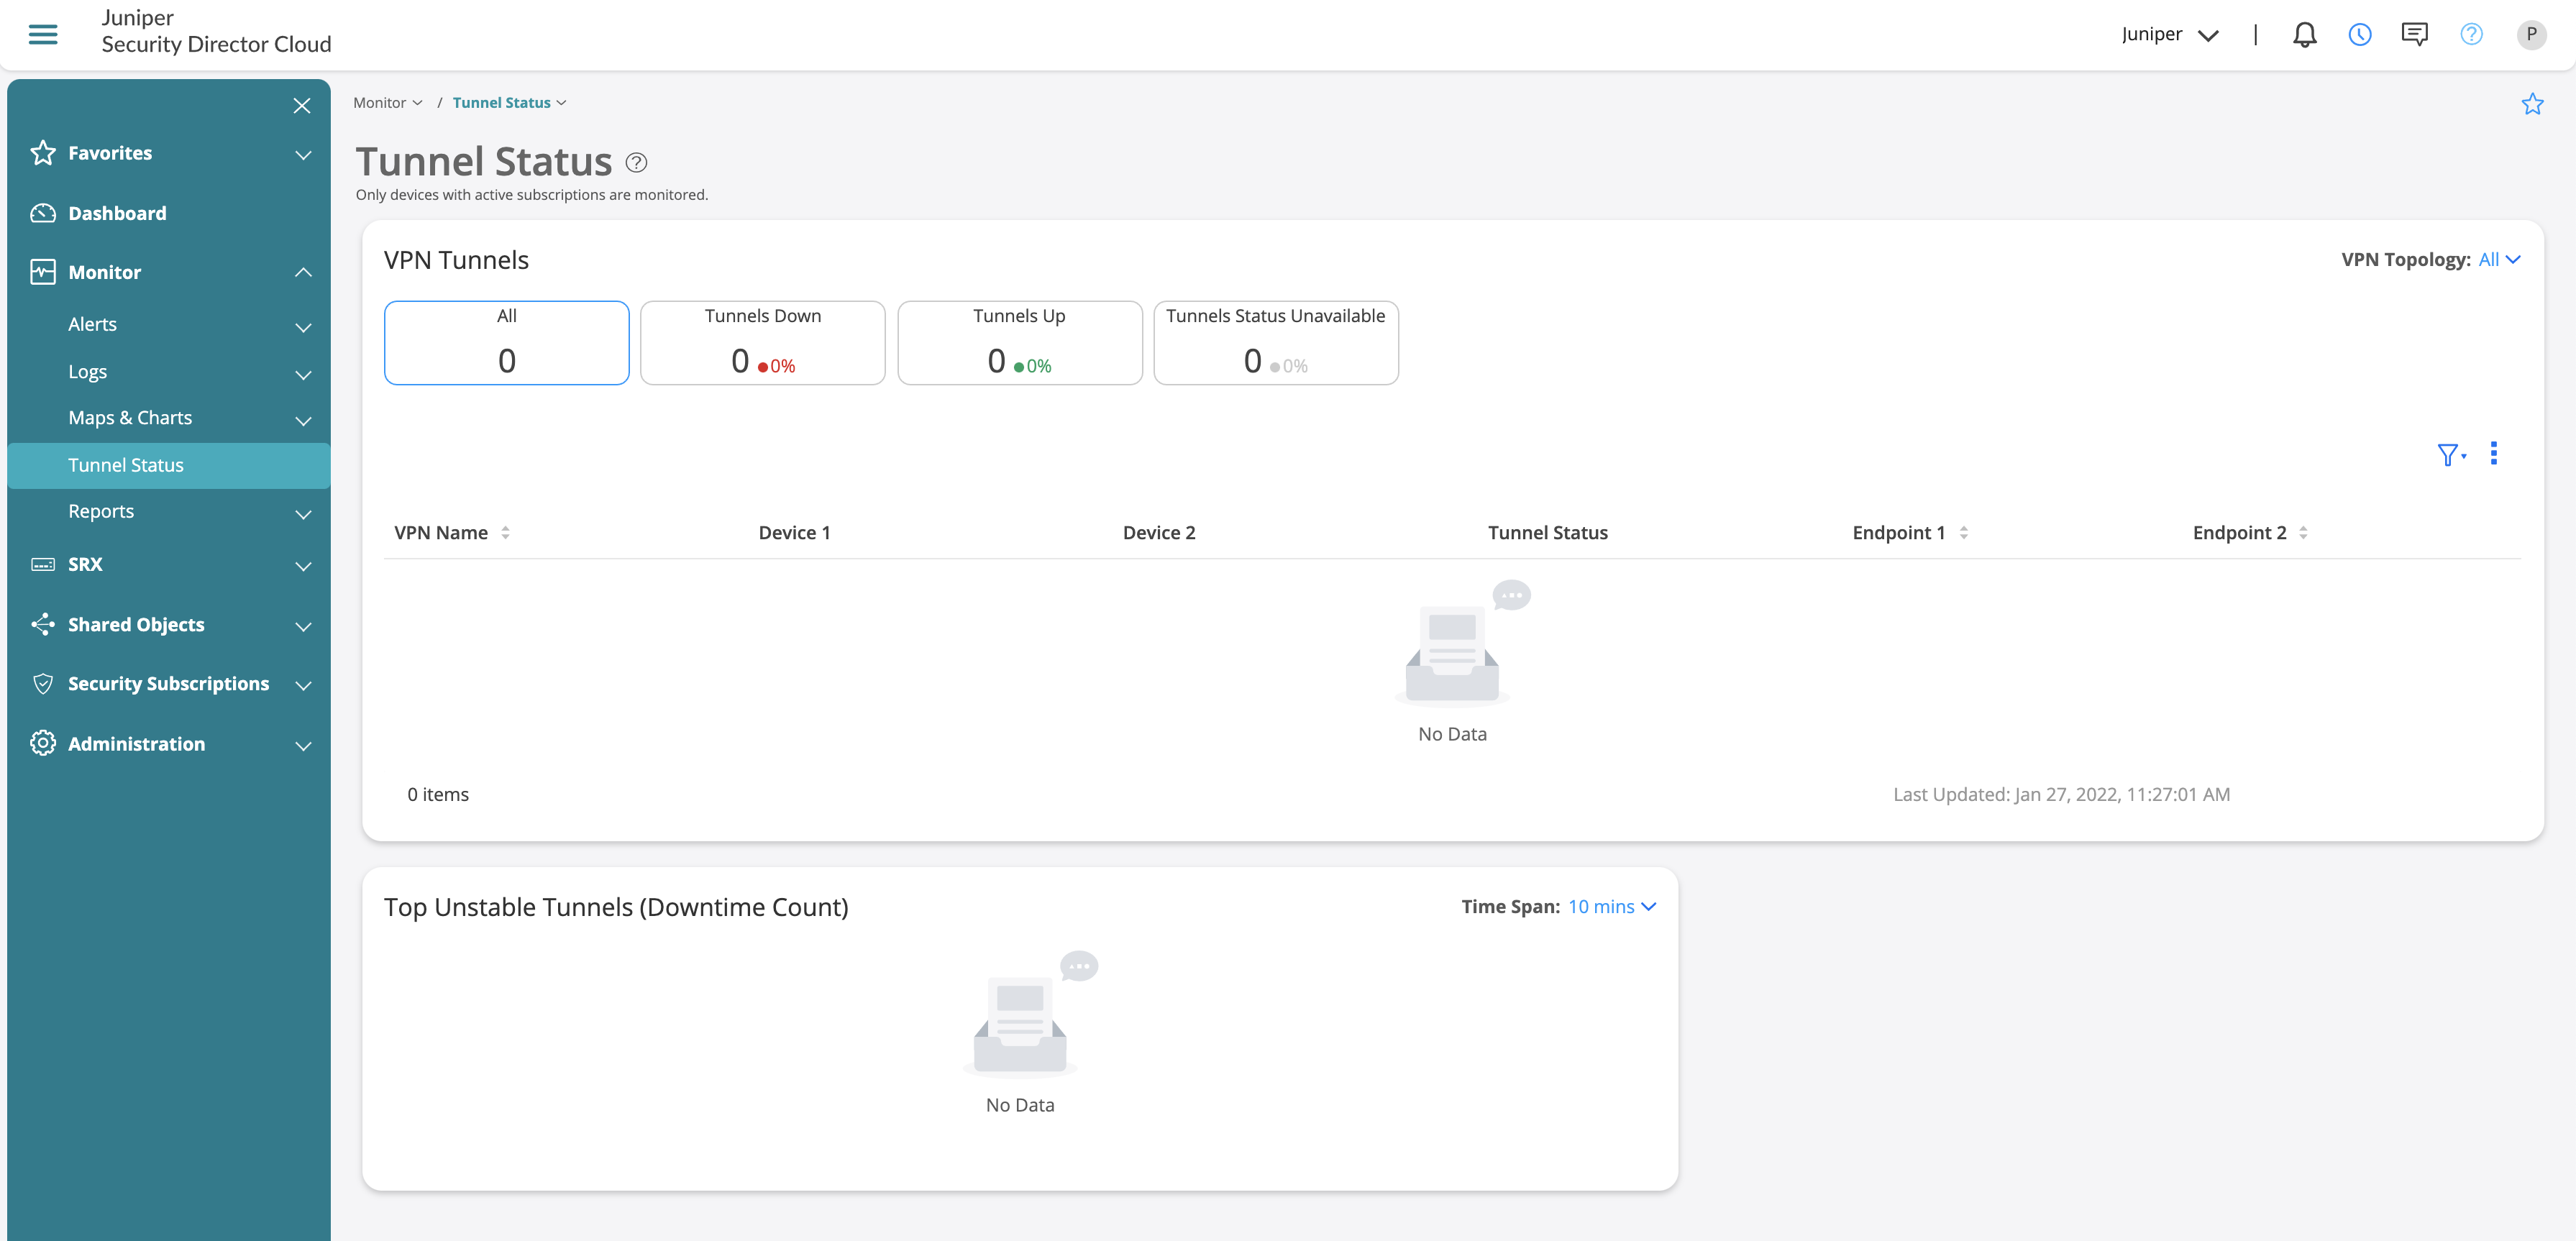
The VPN Tunnels dashboard contains widgets that display the total number of IPsec VPN tunnels, the number of VPN tunnels that are up, the number of tunnels that are down, and the number of tunnels whose status is unavailable. You can click the widgets to filter the VPN list and display all the tunnels, only tunnels that are up, or only tunnels that are down. You can also filter the VPN list based on the VPN topology—site-to-site and hub-and-spoke. You can also use the filter to specify custom search parameters and display the VPN list based on the VPN name and endpoints connected with the VPN tunnels.
The Top Unstable Tunnels dashboard displays the top five unstable VPN tunnels that were down for a specific period along with the downtime count. You can select a time span from 10 minutes to 30 days. The list of tunnels varies depending on the selected time span. Based on the selected duration, a time range and graph are displayed with the tunnel status data.
The following screenshot shows the VPN Tunnels dashboard for the VPNs, the VPN tunnels, and the VPN tunnel downtime count.
To access this page, click .
You can perform the following tasks from this page:
-
View the current VPN tunnel details in the VPN Tunnels dashboard.
-
Use the advanced filter to display the VPN list filtered by the VPN name or endpoints. See .
-
View the tunnel downtime count ranging from 10 minutes to 30 days in the Top Unstable Tunnels dashboard.
Field Descriptions
|
Fields |
Description |
|---|---|
|
VPN Name |
Specifies the name of the IPsec VPN. Click the name to navigate to the Tunnel Status page. |
|
Device 1 |
Specifies the IPv4 or IPv6 address of the source device. |
|
Device 2 |
Specifies the IPv4 or IPv6 address of the destination device. |
|
Tunnel Status |
Specifies the status of the tunnel: Tunnels Up, Tunnels Down, or Tunnels Status Unavailable. If the tunnel is down, also displays the reason for the failure. |
|
End Point 1 |
Specifies the name of endpoint 1. |
|
End Point 2 |
Specifies the name of endpoint 2. |